


Services on Demand
Journal

Article
 English (pdf)
 Article in xml format
 Article references
 Send this article by e-mail
Indicators
 Cited by SciELO
 Related links
 Similars in
SciELO
Similars in
SciELO Share

 Permalink
Atmósfera
Print version ISSN 0187-6236
Atmósfera vol.25 n.1 Ciudad de México Jan. 2012
Decision trees to determine the possible drought periods in Ankara
M. Taghi Sattari
Department of Water Engineering, Faculty of Agriculture, University of Tabriz, Tabriz 5166614766, Iran
Corresponding author: mtsattar@tabrizu.ac.ir
A. S. Anli, H. Apaydin and S. Kodal
Department of Farm Structures and Irrigation, Faculty of Agriculture,
University of Ankara,06110 Diskapi Ankara, Turkey
Received December 12, 2010; accepted September 27, 2011
RESUMEN
Al igual que en muchas otras partes del mundo el cambio climático global causa disminución de la precipitación en Turquía. Como resultado ahora las sequías ocurren sobre un área mayor y de manera más drástica que en el pasado. Determinar los factores de la formación de la sequía y su pronóstico temprano permitirá que las medidas requeridas de prevención se tomen a tiempo. El presente estudio evalúa, con base en las técnicas de árboles de decisión, las condiciones de sequía en la región de Ankara con mediciones anuales y mensuales de precipitación, viento, humedad y temperatura tomadas entre 1926 y 2006. Los resultados obtenidos demuestran que la provincia de Ankara generalmente tiene un clima seco normal y cuasi normal y que la precipitación en todos los meses y la precipitación y el viento en enero, deben ser considerados para determinar tal clima.
ABSTRACT
Global climate change causes a decrease of precipitation in Turkey, as in many other parts of the world. As a result, droughts have now occurred over a larger area and in a more drastic way than in the past. Determining the factors in the formation and early prediction of drought will allow required measures of prevention to be taken in time. The present study evaluates drought conditions on monthly and yearly bases, with the measurements of precipitation, wind, humidity and temperature taken in the Ankara region between 1926 and 2006 using the techniques of decision trees. The obtained results demonstrated that the province of Ankara has a generally normal and near-normal arid climate and that the precipitation amounts in all months and precipitation and wind in January, should be taken into consideration to determine such aridity.
Keywords: Standardized precipitation index, clustering, C5.0 algorithm, water shortage, time series, drought modeling, risk assessment.
1. Introduction
History has witnessed immense socioeconomic and environmental problems caused by severe and perpetual droughts. These have occurred in many areas open to human settlement and people have adapted themselves to its presence. The increasing need for water, growing global population, and increasing use of water for irrigation and industry all provide clues to how forceful and dangerous droughts can be. During drought periods, all kinds of constraints on or decrease in water use will result in economic losses. Current scenarios of global change assert that human activities increase the changes in the climate and flora, as well as the magnitude, frequency and effects of large-scale drought events.
Drought prediction and determining the potential disastrous impacts is a prerequisite in effective water management. Drought is a process that increases over time and begins when the amount of available water in an area is less than the average accessible amount. When this accessible amount is below normal conditions, the social effects, severity, and significance of drought are more evident in arid and semi-arid regions. Water and humidity rates observed over an extended period of time may reveal the degree of drought severity. When precipitation decreases over a large area for a long period of time, the phenomenon of 'meteorological drought' is the first stage in drought formation. Persistence of this phenomenon leads to different drought levels in the hydrological cycle. The amount of water in the soil decreases as a result of increased evaporation as precipitation decreases. The term 'agricultural drought' is used when the amount of soil humidity does not meet the needs of plants. As these conditions progress, the amount of underground water and overground streams decrease and thus 'hydraulic drought' occurs. If a drought continues, the recovery of underground water becomes impossible and underground water reservoirs are depleted (Stahl, 2001).
The effects of drought often accumulate slowly and have a long-lasting character (Wilhite et al., 2000). Recurring prolonged droughts have also caused far-reaching and diverse impacts (Nadarajah, 2009). In drought management and planning, the notion of risk management is fundamental to reduce the effects of drought. Experience from previous struggles against drought has revealed that momentary measures are not very effective and that wrong decisions might be taken (Wilhite, 1994).
A variety of research has been conducted on drought, from a range of perspectives. Drought has been examined by meteorologists in regards to the amount of precipitation, temperature, humidity, and evaporation; by engineers of water resources in terms of rivers, underground water, water accumulation reservoirs, and lakes; by agriculturalists in terms of plants; and by economists in terms of human life (Mishra et al., 2009). Relevant focuses which permeate these various studies are the duration, magnitude, and range of recurrence of an anticipated drought.
More intense droughts in the past decade, affecting an increasing number of people, are also frequently a consequence of the mismanagement of water resources and the neglect of risk assessment. The increased exposure to potential hazards has led to more awareness of integrated water resources development and management and risk assessment (Wang, 2010).
The probabilistic behaviour of drought characteristics has been generally derived analytically, assuming a given stochastic structure of the underlying hydrological series (Bonaccorso et al., 2003). Other common methods that reveal drought and identify common relationships are the De Martonne, Thornthwaite and Palmer drought severity indices, run analysis, and statistical and stochastic methods. In recent years, the use of database models has lead to the development of new methods for drought prediction, one of which is decision trees algorithm among the data mining techniques. Data mining is the extraction of formulae and rules that allow predictions for the future in large amounts of data, using computational technology. Assuming that the near future will not be significantly dissimilar from the past, the rules extracted from the previous data will allow accurate predictions that could remain valid in the future.
Recent studies have shown that, although drought effects on vegetation result from complex atmospheric and biophysical phenomena, data mining provides mechanisms for understanding drought characteristics in space and time (Harms et al., 2002). These studies illustrate the potential of data mining for drought analysis and prediction. Velickov and Solomatine (2000) briefly explained data mining techniques such as clustering, regression and decision tree algorithms and presented sample applications of these techniques for hydro-meteorological data. Solomatine (2002) explained the differences between the data-based and physics-based models and presented general definitions about data mining techniques and their applications in control of water resources applications. Solomatine and Dulal (2003) compared the M5 tree model with an artificial neural network (ANN) method for rainfall flow modelling and indicated that the M5 tree model yielded more meaningful results. Florian et al. (2003) in England and Sudha et al. (2006) in India determined reservoir water control rules by using linear programming and data mining methods in an "if-conditional" approach. Rules were determined in these studies by using a C5.0 decision tree technique developed by Quinlan (1993); results were evaluated by simulation techniques.
García-Barrón and Pita (2004) devised Autoregressive Integrated Moving Average (ARIMA) models for long-term monthly series of maximum and minimum temperatures from south-western Spanish observatories.
Tadesse et al. (2004) employed data mining to identify complex relationships involving atmospheric and oceanic variables that potentially cause droughts over selected stations and statewide areas of Nebraska, USA. Bhattacharya et al. (2004) carried out a study of sediment transportation and they estimated river bed load and total sediment load by using ANN and the decision tree technique of the data mining method. They compared the results of the study with commonly used models and determined that the data mining method was a valid and reliable method in complex sediment transportation studies. Tadesse et al. (2005) presented a rule-based regression tree models to modeling vegetation stress due to drought and mapping its spatial extent during the growing season. Khan and See (2006) used regression and M5 tree models in water level estimation for the Ouse River in England. Peralta-Hernández et al. (2008) tried to assess the impact of the El Niño (EN) phase of ENSO on air temperature, precipitation, and drought index during the canícula period. Seager et al. (2009) examined variability of Mexican hydroclimate using observations and model simulations. Pal and Deswal (2009) applied M5 tree approach for modeling the reference evapotranspiration. Results from their study showed that M5 model tree could be successfully employed in modeling the reference evapotranspiration. Bobba and Minetti (2010) used Lund's methodology to attempt to group the fields of atmospheric pressure anomalies with drought indexes.
Using the observations of precipitation, wind, humidity and temperature, as well as the SPI values as measured in the meteorological stations in the Ankara region with sufficient data, the present study aimed to determine the possible drought and rainy periods on a monthly basis, with the help of the decision tree technique, a method of data mining. As a result of the study, the drought and rainy periods, and drought severity will be identified on a monthly basis in Ankara in the previous years and prospectively, predictions could be made about which months, under which meteorological conditions, and at which levels a drought might occur. These predictions will provide information about a possible drought in "if-then" format and this information could be employed to implement sounder policies about drought. Although the concept of data mining is used in many areas, particularly in computer engineering, it has so far not been used in Turkey in any significant study on drought analysis.
The structure of the paper is organized as follows. The next section introduces data used between 1926 and 2006, in the Ankara region. Regional homogeneity analysis, drought indices and data mining and decision trees are described in their own sections. A section follows that presents obtained SPI values, results of data mining (two example months) and evaluation of 81-year data including discussions and finally; conclusions are given.
2. Material and method
2.1 Study area and data
Annual precipitation in Turkey ranges from 220 to 3000 mm, greatly varying from one region to another or one basin to another. The highest annual spatial precipitation is observed in the Eastern Black Sea region with 1198 mm, while the lowest average annual precipitation is observed in the closed basin of Konya with 417 mm. Long years of observations suggest that the average annual precipitation in Turkey is 643 mm, which corresponds with an annual precipitation volume of 501 x 109 m3. Average annual evapotranspiration losses are around 274 x 109 m3 (Burak et al., 1997).
The data used in this study were obtained from 18 meteorological stations in the province of Ankara, which are run by the Turkish State Meteorological Service (DMI) and have been conducting measurements for at least 20 years. These stations have various meteorological values on a monthly basis for 21-81 years between 1926 and 2006. Of these observations, measurements of precipitation, wind, humidity, and temperature were taken into consideration. Table I presents the stations that measured the amounts of rainfall used in the study and some of their characteristics. Table II presents the statistical attributes of the precipitation values obtained from Ankara station with the longest period of measurement.
2.2 Regional homogeneity analysis
This study used the Ward Linkage Method, a hierarchical method, for cluster analysis. In this method, the distance between two clusters is the sum of the square of the distances from each point to the centre, and the aim is to make the lowest the sum of squares in a cluster (Gordon, 1981). Euclidean Distance Measure was used to determine the similarities among the units. While conducting the clustering analysis, the parameters of latitude, longitude, and height presented in Table I for each station and long-year averages of annual instantaneous maximum rainfall amounts were used in the cluster matrix. Taking into consideration dendrograms and geographical affinities obtained from the results of cluster analysis, the province of Ankara was examined first as three and later as two regions in trials and finally, the province was taken as a single region according to the results of the analysis. Regional homogeneity analysis was carried out according to these regions and the most appropriate regionalisation was performed by the help of discordancy measure, heterogeneity measure, and goodness-of-fit measure, as presented by Hosking and Wallis (1997). Since Ankara was a single homogeneous region, only one station, Ankara station, was selected because it has the largest sample size and reliable data for those analyses.
2.3 Drought indices
Drought indices provide information about drought using climate elements such as precipitation and temperature in a certain time interval and position. These indices can be used when making decisions about the management of water resources to mitigate the effects of drought. In the present study, the method of Standardized Precipitation Index (SPI) was employed to analyse drought in the province of Ankara. The SPI method indicates the number of standard deviations or the deviation of observations from long-term averages (McKee et al., 1993). It is well accepted that SPI has been found suitable for quantifying most types of drought events (Mishra et al., 2009). As the only variable in the SPI method, precipitation has an advantage in implementation where the climate data is limited and is more flexible in short- and long-term monitoring of drought (Edwards and McKee, 1997; Redmond, 2000).
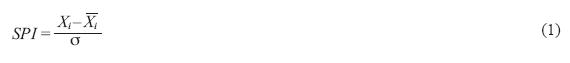
SPI is obtained through normalising, by subtracting the amount of rainfall in station i for a selected period of time (Xi) from the average amount of rainfall ( ) and dividing the difference by standard deviation (σ) and is explained by the following equation:
As a result of normalization of the SPI values, both dry and humid periods are similarly represented within the selected period. During a drought, an assessment is performed by considering the SPI values, a time period throughout which the index is negative is defined as a drought period (McKee et al., 1993). Table III gives the severity classes according to this method. The drought categories given in this table were used as the determining class labels in forming the decision trees.
2.4 Data mining and decision trees
Data mining models consist of techniques such as artificial neural networks (ANN), rule-based expert systems, fuzzy logic, decision extraction, machine learning systems, clustering, and classification. At times, hybrid models can also be established from a mixture of physics- and data-based models (Solomatine, 2002).
The decision tree method is an estimation model and often used for data clustering. An upside-down tree is created from top to bottom or from general to specific during the model training process.
Decision tree learning classifies the instances into a tree-like flowchart, whereby the human investigator can easily understand the relationship between the various variables. This algorithm works best when used to classify the data into discrete categories, which are often known as classification problems. This algorithm has been applied to such problems as learning to classify medical patients by their disease, equipment malfunctions by their cause, and loan applicants by their likelihood of missing payments (Mitchell, 1997).
Trees contain all trained cases in their roots in the first case. If all cases are in the same cluster, then the solution is achieved without the need for any decision about the future. If the cases in the root node form two or more clusters, then the root node will be divided by the tests performed for this node. Thus, this node will be the central node. This process is repeated for each new central node and finally, the whole tree is corrected. In this case, a decision tree is a potentially appropriate solution; in other words, the elements of a tree may offer special trained noises and outliers. After this fit is achieved, the method of multiple decision trees eliminates sub-trees during the pruning stage and achieves a more precise decision tree. Error prediction techniques play a significant role in pruning a tree. Modern models of multiple decision trees include both special criteria of separating tree branches and pruning noises. Except for a number of automatic decision tree correction techniques, the control rules in the reservoir are extracted using the C5.0 algorithm, an extension of the pre-acknowledged ID3, a decision trees system (Quinlan, 1993). ID3 algorithm employs the entropy criterion in decomposing the tree branches and nodes. For each t node, the decomposition criterion uses the following equation:

The probability for cluster pi is in node t. An attribute and decomposition is performed when there is minimum entropy (Sudha et al., 2006).
In statistical methods or artificial neural networks, after a function is learnt from the data, it is difficult to interpret this function as a rule that can be comprehended by humans. In decision trees, after the data are prepared, the rules can be written in an "if-then" format by moving from the root to the leaf in the tree. Thus, rule extraction allows validating the result of a study on data mining. These rules can be observed by an expert in the application to check the meaningfulness of the result. Even if another technique will be used later, conducting an initial study with decision trees will inform the analyst about important variables and rough rules, and may serve to guide subsequent analyses (Solomatine et al., 2003).
The most significant stage of data mining is data preparation (Han and Kamber, 2006). Other stages include data selection, preliminary processing, data mining, and interpretation. The data mining model is based on data set analyses expressed by attributes. Data sets contain previously determined classes. Described by the label of class attribute, these classes are defined by an attribute. After training the data sets, they are analysed to correct the model.
The process of data preparation and modelling is repeated until the most appropriate model is achieved. A simple validation test is the easiest method used to test the accuracy of a model. Typically, around 5 and 33% of the data is set aside as test data and the remaining part is subjected to a training process (Yaralioglu, 2004). In a classification model, error rate is calculated by dividing the number of cases categorised as false by the number of all cases, and accuracy rate is calculated by dividing the number of cases categorised as accurate by the number of all cases. Although small increases in the accuracy rates are very important in some applications, interpretation of why the decision in question was taken can be much more important in many business applications. In very rare situations, the results obtained are so complicated that they cannot be interpreted; yet, in general, decision tree and rule-based systems can reveal very clearly the causes of a case. An established and validated model can be directly used as an application and it may also be a part of another application. The changes that occur over time in the attributes and thus in the data they produce in all systems require that the established models are continuously monitored and reorganised, if necessary. Graphics that represent the differences between the anticipated and observed situations (values) constitute a useful method used in monitoring model results (Velickov and Solomatine, 2000).
3. Results and discussion
3.1 SPI values
According to the discordancy measure, heterogeneity measure, and goodness-of-fit measure performed by taking the stations used in the study as one region, none of the 18 stations in Ankara region were discordant. The heterogeneity measure was computed to be H = –0.184. Suitable distributions were determined to be Z = –0.81 and Z = –1.07 as generalised extreme values and generalised normal values, respectively. A negative heterogeneity measure indicates a positive correlation between the data from different stations. Therefore, it could be argued that any station selected will represent the entire province of Ankara. Finally, Ankara station was selected for the data mining studies with the longest observation period, with 81 years of data. After selection, the SPI values were calculated using the monthly rainfall data obtained from Ankara station. The normality of the rainfall data sets was checked using the Anderson-Darling test for calculating SPI values. While the rainfall data from January, March, July, August and September fit the two-parameter gamma distribution, the other months' rainfall data fit standard normal distribution.
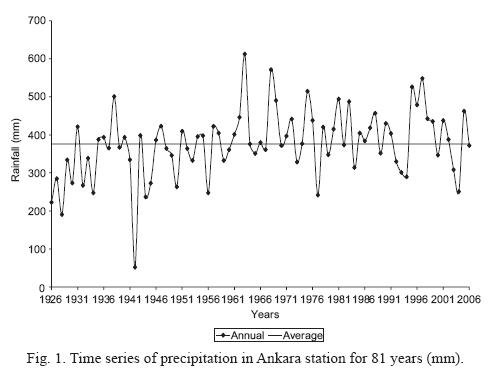
As seen in Table II, which presents the long-year monthly average amounts of rainfall from Ankara station, the highest rainfall (50.35 mm) was in May and the lowest rainfall (12.78 mm) was in August. Figure 1 shows the monthly changes in rainfall for a period of 81 years in Ankara station. As seen in the figure, the period between 1926 and 1960 was relatively dry, while the period after the 1960s was relatively humid. According to the 81-year rainfall data, the annual average amount of rainfall is 375.92 mm.
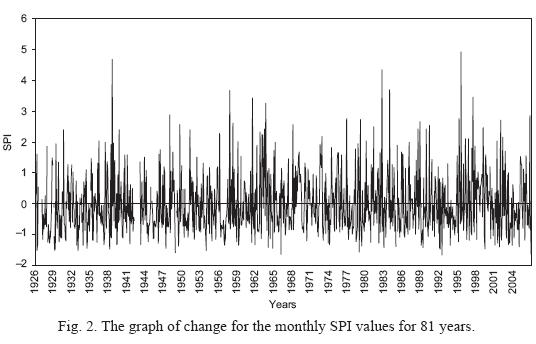
The drought classification used in the data mining method was performed according to the SPI method. After calculating the SPI values from Ankara station, among the 81-year data, 30 cases (months) could not be calculated due to lack of data (indefinite), 386 cases (months) were humid, and 556 cases (months) were determined to be dry. Figure 2 gives the calculated SPI values and the changes they represent for Ankara station. As seen in this figure, Ankara has a dry climate in general.
3.2 The results of data mining
During the study, the measurements of precipitation, wind, humidity and temperature, as effective factors in drought formation, were taken into account in the data mining model. However, the obtained data suggests that along with the amount of precipitation, wind was observed only in January as an additional criterion in decision trees and thus, in the establishment of drought rules. The attributes, with the exception of precipitation and wind, were observed to be ineffective in the formation of decision trees. In the data mining study, drought categories were determined according the SPI values given in Table III. The study examined all months during the year. Furthermore, an annual evaluation was also made by taking into consideration the 81 years of data. Here, the results of May, the month with the highest rainfall, and of August, the most dry month, as well as the results of the annual drought analysis, are provided as an example.
May
In May, 55 cases were reserved for the training of the decision tree model and 25 cases were reserved for testing the model. In the training period, precipitation amount was only one significant attribute. Five rules obtained for May are given in Table IV.

The explanation for the first rule obtained during the training period for May could be "if the amount of precipitation in May is higher than 19.5 mm and lower than or equal to 49.9 mm, then near-normal drought will occur". The Laplace accuracy measure of this rule is 95.8%. A total of 22 cases complied with this rule at the training period and there are no cases that do not comply. The second rule is "if the amount of precipitation in May is higher than 49.9 mm and lower than or equal to 78.6 mm, then the class of drought will be normal". The Laplace accuracy measure of this rule is 94.1%. At the training period, 15 cases complied with this rule.
The training data for May (55 cases) give as a result that five rules were obtained. Only one case that did not comply with these five rules was classified as false, which corresponds to 1.8%. Confusion matrix is a matrix that shows interclass distribution and possible false classifications according to all trained cases. The confusion matrix for the training period is given in the left half of Table V. As seen in Table V, at the training period for May, the classification process was accurate in all cases, except for one and only one case out of the diagonal (shown in grey in the table) was classified as false.
Utility of the rules obtained according to the training data in May is shown in the first row of Table VI. As seen in the table, error rate decreases with an increased number of rules for application. Thus, three cases are false (5.5%) when 1-4 rules are applied; however, when all five rules are considered, the number of cases classified as false decreases to one and the percentage of error margin to 1.8%.
Evaluation of the test data in May (25 cases): during this period, in the five rules obtained, 4 cases out of a total of 25 cases were determined to be false (16.0%). The confusion matrix for this period is given in the right half of Table V. As seen cases out of the diagonal of the matrix (shown in grey in the table) were classified as false. The process of false classification of the model is directly related to the fact that the periods assigned for the training and test periods have a similar data structure (Fig. 3). As seen here, there is a similarity between a large part of the training period in May and a considerable part of the test period. In the structure of the data used in the decision tree model, the differences decreased both in training and test periods. Due to these decreased differences, there is a relative agreement between the false (four cases) classification for the test period and the false classification (one case) for the training period. However, this agreement was expected to have been relatively higher, as the number of data for the training period was about twice the number of data for the test period.

Utility of the rules obtained according to the test data in May is shown in the second row of Table VI. As seen in the table, the number and percentage of errors decreases with an increased number of rules. As the results obtained from Table VI suggest, when only one rule is applied, the number of errors was 15 and the error rate was 60%, while the number of errors was only five, with the error percentage calculated to be 20.0% when 1-4 rules are applied. However, when all the rules are considered, 4 cases were identified to be false (16.0%).
August
In August, 54 cases were reserved for the training of the decision tree model, while 25 cases were reserved for testing the model. In constructing the decision tree model for August, precipitation was identified to be only one attribute. Table VII presents the rules six classes obtained for this month.

Evaluation of the training data in August (54 cases): during this period, 6 rules were obtained. Among these 54 cases, only one case was classified as false, which corresponds to 1.9%. The confusion matrix for the training period is given in Table VIII. As seen in the table, the classification process for the training period in August was accurate in all cases, except for one and it could be observed that only one case out of the diagonal was classified as false.
Utility of the rules obtained according to the training data in August is shown in Table IX. As seen in the table, error rate decreases with an increased number of rules for application. Thus, 5 cases are false when 1-4 rules are applied (9.3%); however, when all six rules are considered, the number of cases classified as false decreases to one and the percentage of error ratio to 1.9%.
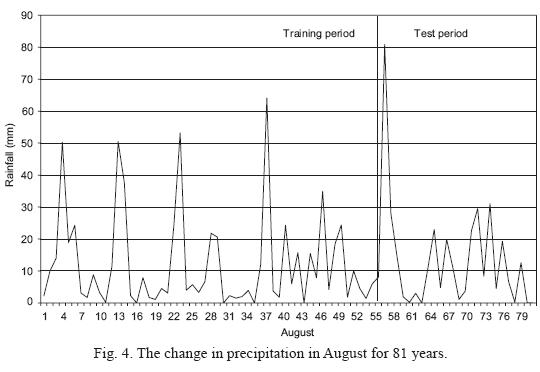
Evaluation of the test data in August (25 cases): during this period, in the 6 rules obtained, 0 cases out of a total of 25 were determined to be false (0%). The confusion matrix for this period is given in Table VIII. As seen in the table, 0 cases out of the diagonal of the matrix were classified as false. The change in the training and test periods is shown in Figure 4. Note that, there is a similarity between the final part of the training period and the test period in August. Within the training period, a high amount of precipitation occurred 4 times, with only one occurrence during the test period. Nevertheless, in the structure of the data used in the decision tree model, there are differences both in training and test periods. Due to these differences, there is a strong agreement between the false (0 cases) classification at the test period and the false classification (1 case) during the training period.
Utility of the rules obtained from the test data in August is shown in Table IX. As seen in this table, the number and percentage of errors decrease with an increased number of rules. The number of errors was 2 and error percentage was computed to be 8.0% when 1-4 rules were applied. When all the rules were considered, no differences were observed in the number of false cases and the percentage of errors.
3.3 Evaluation of 81-year data
On a yearly basis, 56 cases were reserved for the training of the decision tree model, while 25 cases were reserved for testing the model. In constructing the decision tree model, precipitation was identified to be the most significant attribute. Table X presents the rules obtained for the 81-year data. Of the 8 drought categories given in Table III, rules were determined for all the cases except for those which were humid.

Evaluation of the training data on a yearly basis (56 cases): seven rules were obtained for this period. For these seven rules, only one case was classified as false; thus, the percentage of error margin at this period corresponds to 1.8%. The confusion matrix for the training period is given in Table XI. As seen in this table, only one case was classified as false at the training period on a yearly basis and the remaining cases were classified as accurate on the diagonal.
Utility of the rules obtained according to the training data on a yearly basis is shown in Table XII. As seen in the table, error rate decreases with an increased number of rules for application. Thus, there are 35 false cases (62.5%) for one rule, while 3 cases are false when 1-6 rules are applied (5.4%). Here, when all 1-7 rules are considered, the number of cases classified as false decreases to one and the percentage of error margin to 1.8%.
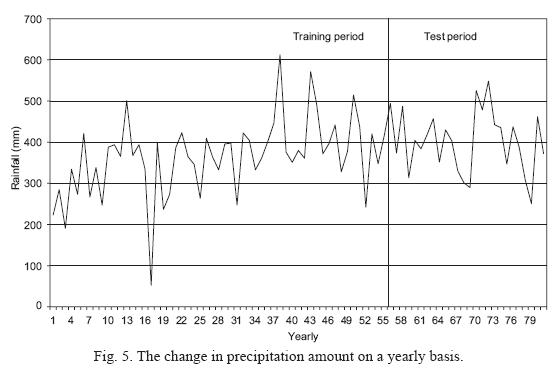
Evaluation of the test data on a yearly basis (25 cases): here, as for the training period, in the 7 rules obtained, 4 cases in a total of 25 were determined to be false (16.0%). The confusion matrix for this period is given in Table XI. As seen in this table, the classification process was performed incorrectly at the test period, just as at the training period. The incompatibility between these two periods was due to the relative difference in the data structures of the training and test periods (Fig. 5). Note that, there are differences between a large part of the training period and the test period on a yearly basis.
Utility of the rules obtained from the test data on a yearly basis is shown in Table XIII. As seen in this table, the number and percentage of errors decrease with an increased number of rules. The best case was identified as the one in which the number of errors was 4 and the error percentage was 16.0% when 1-3 rules were applied. Here, the number of errors was again 4 and error percentage was 16.0% until 1-7 rules were applied.
The summary table of the drought analysis for Ankara region is presented in Table XIII. The number of rules obtained from the decision trees varied between 4 and 8 and the lowest error amounts ranged between 0-4.5% for the training period and 0-16% for the test period. The most commonly observed classification was MiD, followed by MiW and ED. On a monthly basis, SW was formed only as the rarest. These results suggest that Ankara has the conditions of an arid and semi-arid climate.
4. Conclusions
In recent years, along with the developments in computers, databases, and information technologies, there have been certain developments in measuring and transferring into databases different hydrometeorological parameters on a daily basis in climate stations. As a result of these technological advancements, the number of observed data has increased. Transferring the measured data into databases provides a basis for application of the newly-developing data mining methods in different scientific areas, particularly in meteorology and water resources engineering. The present study demonstrates that decision tree, a sub-technique of data mining, may yield appropriate results in obtaining comprehensible drought rules on monthly and yearly bases. The obtained results suggest that the data mining method is successful in drought analysis and in determining the formation conditions for a possible drought.
As a result of the data mining research, it was determined that parameters such as wind, humidity and temperature are not as effective in drought analyses as precipitation. It is observed that rules obtained in the "if-then" format provide flexibility in and facilitate drought analysis. In a sense, such flexibility may lead to a more realistic interpretation by revealing the fuzziness in the drought structure in the form of rules. Furthermore, by using these rules, predictions can be made regarding the severity of a possible drought in the following months. In data mining studies, a large amount of data may offer advantages and ensure more reliable results. In this study, both during training and test periods, some decreases in the number of model input in some months was observed due to lack of data. As a result of such decreases, error margins were higher in some months. On the other hand, owing to the decreases in precipitation in recent years, some changes were observed in the data structure used in the training and test periods, which led to an increase in the error margin. If the number of data had been higher and incomplete data had been lower, the obtained results would have been sounder and more accurate. In this study, drought was classified only on the basis of the SPI values. The use of other drought indices is recommended for further studies.
Acknowledgements
This study was supported by the Scientific and Technological Research Council of Turkey (TUBITAK) with a project number of 108O285.
References
Bhattacharya B., R. K. Price and D. P. Solomatine, 2004. A data mining approach to modeling sediment transport. 6th International Conference on Hydro-informatics. World Scientific Publishing. Pages 1-8. Singapore. [ Links ]
Bobba M. E. and J. L. Minetti, 2010. South American atmospheric circulation anomalies related to droughts in the northwest of Argentina (1951-1980). Atmósfera 23, 263-275. [ Links ]
Bonaccorso B., A. Cancelliere and G. Rossi, 2003. An analytical formulation of return period of drought severity. Stoch. Environ. Res. Risk. Assess. 17, 157-174. [ Links ]
Burak S., I. Duranyildiz and U. U. Yetis, 1997. Water resources management. National Environment Act Plan (In Turkish). Turkish State Planning Organization, 116 pp. [ Links ]
Edwards D. C. and T. B. McKee, 1997. Characteristics of 20th century drought in the United States at multiple time scales. Climatology Report Number 97-2, Colorado State University, Fort Collins, CO, 155 pp. [ Links ]
Florian T. B., A. S. Dragan and A. W. Godfrey, 2003. Water Reservoir Control with Data Mining. J. Water Res. Plan. Man. 129, 26-34. [ Links ]
García-Barrón L. and M. F. Pita. 2004. Stochastic analysis of time series of temperatures in the south-west of the Iberian Peninsula. Atmósfera 17, 225-244. [ Links ]
Gordon A. D., 1981. Classification methods for the exploratory analysis of multivariate data. Chapman and Hall, London, 193 pp. [ Links ]
Han J. and M. Kamber, 2006. Data Mining: Concepts and techniques. Morgan Kaufmann Publishers, Elsevier, San Francisco, CA. USA, 770 pp. [ Links ]
Harms S. K., J. Deogun and T. Tadesse, 2002. Discovering sequential association rules with constraints and time lags in multiple sequences. In: Proc. of the 13th International Symposium on Methodologies for Intelligent Systems, Lyon, France (M. S. Hacid, Z. W. Ras, D. A. Zighed and Y. Kodratoff, Eds.). Foundations of Intelligent Systems, Lecture Notes in Artificial Intelligence, June 27-29. Springer, Berlin, 2366, 432-441. [ Links ]
Hosking J. R. M. and J. R. Wallis, 1997. Regional frequency analysis: An approach based on L-moments. Cambridge University Press, Cambridge, UK, 224 pp. [ Links ]
Khan A. S. and L. See, 2006. Rainfall-runoff modeling using data driven and statistical methods. International Conference on Advances in Space Technologies, Institute of Electrical and Electronics Engineers (IEEE), 2-3 September, Islamabad, 16-20, doi: 10.1109/ICAST.2006.313.789. [ Links ]
McKee T. B., N. J. Doesken and J. Kliest, 1993. The relationship of drought frequency and duration to time scales. In: Proceedings of the 8th Conference on Applied Climatology, 17-22 January, Anaheim, CA. American Meteorological Society, Boston, MA, 179-184. [ Links ]
Mishra A. K., V. P. Singh and V. R. Desai, 2009. Drought characterization: a probabilistic approach. Stoch Environ. Res. Risk Assess. 23, 41-55. [ Links ]
Mitchell T. M., 1997. Machine learning. McGraw-Hill, Boston, 414 pp. [ Links ]
Nadarajah S., 2009. A bivariate Pareto model for drought. Stoch. Environ. Res. Risk. Assess. 23, 811-822. [ Links ]
Pal M. and S. Deswal, 2009. M5 model tree based modeling of reference evapotranspiration. Hydrol. Process. 23, 1437-1443. [ Links ]
Peralta-Hernández A. R., L. R. Barba-Martínez, V. O. Magaña-Rueda, A. D. Matthias, and J. J. Luna-Ruíz, 2008. Temporal and spatial behavior of temperature and precipitation during the canícula (midsummer drought) under El Niño conditions in central México. Atmósfera 21, 265-280. [ Links ]
Quinlan J. R., 1993. C4.5 Programs for machine learning. Morgan Kaufmann Publishers, Inc., San Mateo, CA, USA, 299 pp. [ Links ]
Quinlan J. R., 1997. See5 (available from http://www.rulequest.com/see5-info.html. Last updated January 2011). [ Links ]
Redmond K. T., 2000. Integrated climate monitoring for drought detection. Drought: A global assessment (D. A. Wilhite, Ed.). DA, Routledge, London, 752 pp. [ Links ]
Seager R., M. Ting, M. Davis, M. Cane, N. Naik, J. Nakamura, C. Li, E. Cook and D. W. Stahle, 2009. Mexican drought: an observational modeling and tree ring study of variability and climate change. Atmósfera 22, 1-31. [ Links ]
Solomatine D. P., 2002. Application of data-driven modeling and machine learning in control of water resources. In: Computational intelligence in control. Idea Group Publishing, London, UK, 197-217. [ Links ]
Srdjevica B., Y. D. P. Medeirosb and R. L. Portoc, 2005. Data envelopment analysis of reservoir system performance. Comput. Oper. Res. 32, 3209-3226. [ Links ]
Stahl K., 2001. Hydrological drought. A study across Europe. Ph.D. thesis Albert-Ludwigs University Freiburg, Freiburg, Germany, 129 pp. [ Links ]
Sudha V., N. K. Ambujam and K. Venugopal, 2006. A data mining approach for deriving irrigation reservoir operating rules. Conference on Water Observation and Information System for Decision Support, 23-26 May, Orhid, Macedonia, 9 pp. [ Links ]
Tadesse T., D. A. Wilhite, S. K. Harms, M. J. Hayes and S. Goddard, 2004. Drought monitoring using data mining techniques: A case study for Nebraska, USA. Nat. Hazards 33, 137-159. [ Links ]
Tadesse T., J. F. Brown and M. J. Hayes, 2005. A new approach for predicting drought-related vegetation stress: Integrating satellite, climate, and biophysical data over the US. central plains. ISPRS J. Photo-gramm. Remote Sens. 59, 244-253. [ Links ]
Velickov S. and D. P. Solomatine, 2000. Predictive data mining: Practical examples. Artificial Intelligence in Civil Engineering. Proceed. 2nd Joint, Workshop. March, Cottbus, Germany, 17 pp. [ Links ]
Wang D., 2010. Accelerating entropy theory: New approach to the risks of risk analysis in water issues. Hum. Ecol. Risk Assess. 16, 4-9. [ Links ]
Wilhite D. A., 1994. Drought management in a changing west. New Directions for Water Policy, (Deborah and A. Wood, Eds.) IDIC Technical Report Series. Portland, Oregon, 94 pp. [ Links ]
Wilhite D. A., K. Cody, H. Mike and P. Tom, 2000. The basics of drought planning: A 10-step process. Drought Mitigation Center University of Nebraska, Nebraska, USA.(available from http://www.wamis.org/tools/info/droughtplanning.pdf. Date 2011-12-04). [ Links ]
Yaralioglu, K., 2004. Uygulamada Karar Destek Yontemleri (In Turkish), Ilkem Ofset, Izmir, Turkiye (available from http://www.deu.edu.tr/userweb/k.yaralioglu/dosyalar/ver_mad.doc. Date 2011-12-04). [ Links ]

