


Serviços Personalizados
Journal
Artigo
 Inglês (pdf)
 Artigo em XML
 Referências do artigo
 Enviar este artigo por email
Indicadores
-
 Citado por SciELO
 -
 Acessos
Links relacionados
-
 Similares em
SciELO
Similares em
SciELO
Compartilhar

 Permalink
Atmósfera
versão impressa ISSN 0187-6236
Atmósfera vol.22 no.2 Ciudad de México Abr. 2009
Quantification of eutrophic aerial compounds in Galicia (NW Spain): Part 2 — NOx inventory
A. GALLEGO, A. HOSPIDO, M. T. MOREIRA and G. FEIJOO
Departamento de Ingeniería Química, Escuela Técnica Superior de Ingeniería Universidad de Santiago de Compostela, Rúa Lope Gómez de Marzoa, Campus Universitario Sur, 15782 – Santiago de Compostela, España.
Corresponding author: A. Gallego; e–mail: alejandro.gallego@usc.es
Received July 23, 2007; Accepted November 27, 2008
RESUMEN
Este estudio es la segunda parte de una serie en la que se han calculado los inventarios de emisiones de NH3 y NOx en Galicia (NW España), una región con un riesgo importante de eutrofización. En este artículo se han estimado las emisiones de NOx de las principales fuentes así como sus incertidumbres asociadas. Los resultados demuestran que las fuentes móviles e industriales producen el 90% de las emisiones, principalmente debido al transporte por carretera, las plantas térmicas y las de cogeneración. La quema de combustibles para usos residenciales, el uso de fertilizantes, la quema de residuos agrícolas, los suelos, los incendios y los rayos son otras fuentes de emisión, aunque mucho menores. En el caso de los incendios, en regiones especialmente afectadas como Galicia, hay que prestar atención a las variaciones en número y tipo de hectáreas quemadas de un año a otro, porque pueden alterar significativamente el total de las emisiones de NOx. Las emisiones provocadas por vehículos y maquinaria agrícola, pesquera y forestal, y por el transporte ferroviario y marítimo son los principales focos de incertidumbre debido a la ausencia de datos específicos para Galicia como tipo, edad y potencia de las máquinas. Otros focos de incertidumbre importantes son las emisiones de suelos e incendios debido a la ausencia de una metodología de cálculo más específica.
ABSTRACT
This study is the second part of a series where NH3 and NOx emission inventories for Galicia (NW Spain), a region with a great risk of eutrophication, have been developed. The principal sources of NOx emissions in Galicia and their associated uncertainty have been calculated in this paper. The results prove that industrial and mobile sources produce 90% of the emissions, principally due to road transport, power and cogeneration plants. Use of fertilizers or fuels for residential purposes, burning of agricultural waste, soils, fires and lightning are minor sources of emissions. In the case of fires, in regions specially affected like Galicia, attention must be paid to variations in number and type of burnt areas from one year to another, because it can significantly change total NOx emissions. The emissions produced by agricultural, fishery and forest vehicles and machines as well as by maritime and railway traffic are the main focus of uncertainty due to the lack of specific data for Galicia like type, age and power of the machines. Other important focuses of uncertainties are the emissions from soils and fires owing to the absence of a more specific methodology.
Keywords: Eutrophication, inventory, NOx, Galicia, uncertainty, air emissions.
1. Introduction
As described in detail in Part 1 (pages 141–161, this issue) of this series, eutrophication is a major risk for both soils and watercourses in Galicia (NW Spain), being the emissions of aerial NH3 and NOx among the principal responsible causes (Rodríguez and Macías, 2006). In spite of these increasing environmental problems and although emission inventories are worldwide under development and in constant improvement (Parra et al., 2006), in Galicia, complete inventories of emissions of NOx and NH3 are still lacking and only a partial approximation for industrial emissions is available (Casares et al., 2005). For this reason, Part 1 of this series developed an inventory of NH3 emissions in Galicia, and the main objectives of this Part 2 are the estimation of NOx emissions in Galicia as well as the uncertainties associated therewith.
2. Methods
2.1 Source selection
As presented in Part 1, the 30 major focuses of emissions were obtained by CORINAIR for 28 European countries in September 1995 (EEA, 2007), these data being selected as basic criterion. However, some considerations need to be made:
• Nitric acid production was excluded, as no factories are located in the region of study.
• Regarding harbor emissions, only emissions related to arrival and departure of ships were calculated. Emissions from tug boats and harbor machinery could not be estimated due to lack of data.
• Some sources, such as fires and use of fertilizers, were included as they are expected to be significant contributors in Galicia.
• In addition, the main natural sources such as emissions derived from soils and lightning were also considered.
2.2 Methodologies for the calculation of emissions
As in Part 1, the methodologies proposed in the EMEP/CORINAIR Guidebook (EEA, 2007) were followed to calculate most of the source emissions. The reference year for this inventory was also 2001, unless otherwise properly specified in the text. NOx emissions are always reported in tonnes (t) of NO2.
2.3 Uncertainties
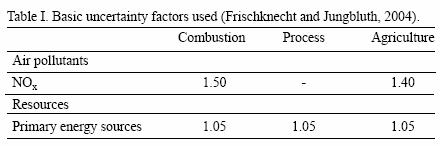
Uncertainty values were determined for every calculation. The methodology implemented is the one used for the NH3 inventory (Part 1 of the series) and described there in detail. The basic factors used in this study are presented in Table I.
A summary of the uncertainty factors used along the inventory is included in the Annex.
3. Emission calculation
3.1 Industrial sources
Industry is one of the major sources of NOx emissions, principally due to combustion processes, where NOx formation is mainly produced by the conversion of chemically bound nitrogen in the fuel and by fixation of atmospheric nitrogen stemming from combustion air (EEA, 2007). Casares et al.. (2005) calculated industrial NOx emissions in 2001 by surveys of the 370 main installations responsible for air pollution in Galicia, showing a total emission of 53,400 t NOx (value range between 50,857 and 56,070). Power and cogeneration plants were the main sources, accounting for 56 and 28% of the emissions, respectively.
3.2 Mobile sources
3.2.1 Road transport
NOx in road transport is caused by the oxidation of N2 from air in the combustion chamber (EEA, 2005). In 2005, transport (excluding international aviation and maritime transport) contributed 56% of total NOx in EU–15 (EEA, 2007), road transport being the main source of this share with a contribution of 75%.
In the same way as NH3 emissions in Part 1, NOx emissions have been calculated using the program COPERT 4.5 (http://lat.eng.auth.gr/copert/) which is recommended by the EMEP/CORINAIR guidebook (EEA, 2007). The required data have been obtained from numerous bibliographic sources (André et al., 1999; Bello et al., 2004; Camaleño, 2008; CMA, 2002; DGT, 2002; INE, 2008; MMA, 2007). The calculation of emissions is very similar to NH3 evaluation, and a detailed description can be found in Part 1 of these series.
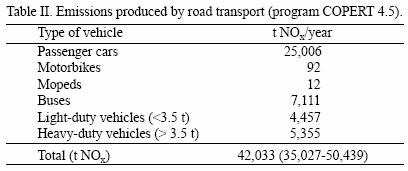
Due to the great number of vehicle types and emission factors (96 different classes and 480 emission factors), Table II only presents the aggregated results per passenger cars, motorbikes, mopeds, buses, light and heavy–duty vehicles (< and > 3.5 t, respectively).
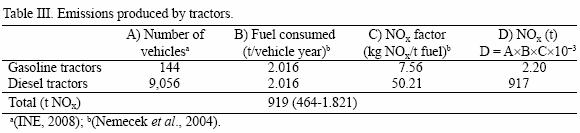
The program COPERT 4.5 only allows calculating emissions produced exclusively by road transport, and therefore, emission factors for tractors are not included. As in the case of NH3 in Part 1, the number of tractors, the amount of annually consumed combustible and the NOx emission factor (taking into account if the tractor is gasoline or diesel–driven) have been considered in order to calculate these emissions (Table III).
3.2.2 Railways
The simple methodology suggested by EMEP/CORINAIR guidance was used. This methodology considers the multiplication of the tonnes of diesel consumed, namely 87,722 t/year in Galicia according to Bello et al. (2004), by the specific NOx emission factor for railways (39.6 kg of NOx/t) (EEA, 2007). As a result, railway transport in Galicia emitted 3,474 t NOx (1840–6557).
3.2.3 Maritime traffic
The simple EMEP/CORINAIR methodology was used again to estimate emissions associated with maritime traffic. It consists in the multiplication of consumed fuel, for both international and national maritime traffic, by the NOx emission factor for maritime activity (72 kg NOx /t fuel) (EEA, 2007). Bello et al. (2004) estimated 44,361 tonnes of consumed fuel for the international maritime transport considering a 17 knots/hour velocity to cover the 200 nautical miles under Spanish jurisdiction. The result was an emission of 3,194 (2,090–4,670) t NOx/year.
Concerning national maritime traffic, it can be divided into interior (canals and rivers) and coastal transport. The former can be considered practically negligible in Galicia compared with the latter, and was therefore excluded from the analysis. In 2000, the consumed fuel associated with national transport was estimated to be 54,375 t/year (Bello et al., 2004), which means an emission of 3,915 (2,561–5,724) t NOx.
3.2.4 Air traffic
The detailed methodology applied by EMEP/CORINAIR guidance was used for the estimation of these emissions (EEA, 2007).
Aircraft operations were divided into two parts and associated emissions were calculated separately as they differ significantly (EEA, 2007):
• Landing/take–off (LTO) cycle, which includes all the activities (taxi–in and out, take–off, climb–out and approach–landing) that take place below an altitude of 1,000 m near the airport.
• Cruise, or the activities that take place at altitudes above 1,000 m. Cruise includes climb from the end of climb–out in the LTO cycle to cruise altitude, cruise and descent from cruise altitudes to the start of LTO operations of landing.
• The 86 different aircraft types that operated in 2001 in Galician airports (Bello et al., 2004) were reclassified according to their characteristics in 29 generic classes. Each of these categories has their specific emission factor per LTO cycle and cruise (EEA, 2007). Therefore, depending on the type of airplane, the number of LTO cycles (Bello et al., 2004) and the emission factor, the emissions associated with the landing and take–off were calculated (Table IV). Regarding emissions associated with cruise activities, data from the principal routes that cover the Galician air space were used and an average distance per flight of 260 km (130 km for entering Galicia and 130 for leaving it) for all the planes with origin or destination in a Galician airport was estimated. Only emissions caused by aircraft landing or taking–off in Galicia were considered, as air traffic that crosses the region without stopping was assumed to be negligible.
3.2.5 Other mobile sources and machinery
In 2001, the annual consumption of diesel B for agricultural use (tractors and other machinery), fishery and forest machines was 7,531,000 GJ (Bello et al., 2004). The NOx emission factor for the combustion of diesel in these sectors is 1.2 kg/GJ (IPCC, 1996). Therefore, total emission (subtracting the emissions associated with diesel tractors included already in subsection 3.2.1.) was 8,121 t NOx (2,967–16,595).
3.3 Residential combustion
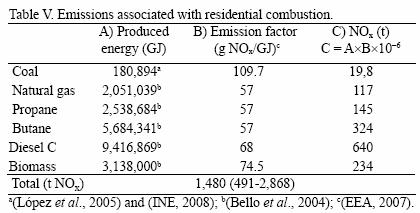
In 2001, a total of 2,721,550 GJ of energy for domestic purposes was produced from coal in Spain (López et al., 2005). An allocation of the Galician consumption was made on a population basis (data of Spanish and Galician population in 2001 from INE, 2008), the value obtained being 180,894 GJ. Using this figure together with the emission factor proposed by EEA (2007), the emission of NOx associated with the use of coal for residential purposes was calculated (Table V). The same method was used for residential use of natural gas, butane, biomass, propane and diesel C (diesel specifically developed for heating), although in these cases the data referring to combustibles were obtained from Bello et al. (2004).
3.4 Fires
As in the case of NH3 in Part 1, to compute the NOx emissions produced by fires (Table VI), first the emitted carbon mass (M(C)) was calculated by equation (1) (Crutzen et al., 1979):


where M(C) is the carbon mass emitted (kg C), 0.45 is the average fraction of carbon in wood, A the burnt area (m2), B the average biomass used as combustible referred to area (kg C/m2), α the fraction of biomass in the surface related to total biomass of B, and β the efficiency of burnt biomass in the surface. Once M(C) is obtained, the emitted NOx can be calculated using the factor of 8 g NOx /kg of emitted C (Andreae, 1991).
3.5 Nitrogen fertilizer application
After nitrogen is applied to the soils, nitric oxide (NO) may be released during nitrification and denitrification. Estimates of NO emissions are very uncertain, but soils (including natural emissions) may contribute 4–8% of total NOx emissions in Europe (EEA, 2007).
To calculate this source, both the amount of N in fertilizers used in 2001 (62,965 t; CMR, 2003a) and the emission factor of 0.007 t N–NO/t N in fertilizers (EEA, 2007) were considered, obtaining a value of NOx (expressed as NO2) emissions of 1,448 t (range 881–2,358).
3.6 Burning of agricultural waste
Similar to that observed in forest fires, burning of agricultural waste produces NOx emissions, being a source of special importance in developing countries (IPCC, 1996). For this source, IPPC methodologies were used, which allow to calculate NOx emissions from N emissions originated by burning of agricultural waste (IPCC, 1996). From the N2O emission data associated with these burnings in Galicia in 2000 (Bello et al., 2004) and using the IPCC emission factors (IPCC, 1996), N emissions were calculated first and, on the basis of these figures, NOx emissions were obtained (Table VII).
3.7 Lightning
Lightning and corona discharge during thunderstorm events cause atmospheric chemical reactions that take place at high voltages and temperatures. These reactions produce NOx in the atmosphere (Sisterson and Liaw, 1990).
The majority of lightning falls on land while a marginal percentage hits the sea (Christian et al., 2003). Taking into account that 0.33 lightning descends per km2 and year (personal communication by Dr. Luis Rivas Soriano, Departmento de Física General y de la Atmósfera, Universidad de Salamanca, Spain), February 15, 2007; ljrs@usal.es) and that the Galician surface is 29,574 km2 (INE, 2008), it was estimated that 9,759 lightning strokes occurred per year. However, and as EMEP inventories do, only the emissions of lightning produced within a range of 1 km above soil level were considered (20% of the total). EEA (2007) establishes an emission factor of 2.75 kg NOx/lightning. Altogether, this results in a NOx emission of 5.37 t (range 1.79–16.1).
3.8 Soil emissions
NOx emissions, mainly in the form of NO, are produced by microorganisms in soil (EEA, 2007). Natural ecosystems tend to have modest fluxes, but soils that are nitrogen–enriched, especially agricultural regions, may have NOx fluxes approaching those of anthropogenic sources (Williams et al., 1992).
For this source, the detailed methodology of EMEP/CORINAIR guidance is used (EEA, 2007). The N–NO emission flux in ng/m2s (FNO) is calculated by the following equation (Williams et al., 1992):

where A is an experimental constant for grazing lands, forests and moist zones and Ts is the soil temperature in °C. These parameters were calculated by Novak and Pierce (1993) for different values of environmental temperature (Ta) (Table VIII).
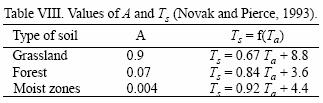
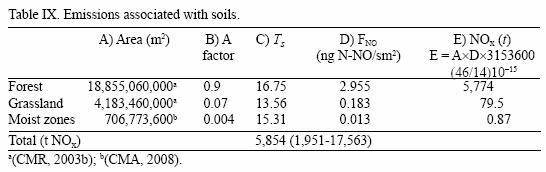
Based on the data of the Climatologic Yearbook of Galicia for 2001 (CMA, 2002), Ta for Galicia was found to be 11.86°C. The data of N–NO flux calculated in equation (2) are multiplied by the area assigned for each use of the soil and thus NOx emissions (expressed as NO2) are obtained (Table IX).
4. Summary of results and discussion
4.1 Inventory of NOx emissions
The main result of this study is the inventory of NOx emissions for the region of Galicia (Table X). To the best of our knowledge, this is the first complete inventory for this specific region and therefore, no full comparison is possible with previous reports.
However, some particular comments can be made with reference to other reported data, such as the values obtained by the EMEP program (EMEP, 2008). The EMEP researchers divide Europe in 50 x 50 km2 grids and publish yearly values of emissions of NOx (among others pollutants) per grid based on officially reported data by countries and expert criteria.
For frontier grids between countries, the percentage of the grid that belongs to each country is known, but these percentages are not available for internal regions of a country. Therefore, the percentage of each frontier grid that belongs to Galicia was calculated here. The total and source–based NOx emissions and their comparison with the EMEP data for Galicia (year 2001) are summarized in Table X.
The major origins of NOx emissions are mobile (road transport, railways, air traffic, etc.) and industrial sources, contributing both 90% of the total. Regarding the former, road transport causes 33% of all emissions, principally by passenger cars, followed by trucks and buses. Emissions associated with agricultural, fishery and forest machineries as well as maritime transport are also important (8,121 and 7,109 t, respectively), representing in both cases around 6% of the total.
To make these figures comparable to EMEP results, the following clarification is needed. When reporting their emissions to EMEP, countries are requested to report their national shipping emissions by grid cell, but international maritime data are separately reported and not allocated to member states. For this reason, the emission of 3,194 t NOx associated with international maritime transport was subtracted in our inventory and the resulting comparison shows that the values are quite similar (59,021 versus 51,009 t).
Concerning industrial sources, power and cogeneration plants stand for 24 and 12%, respectively, of the total emissions of NOx in Galicia. The sum of NOx emissions from industrial activities and from heating for commercial and residential purposes given in our inventory (54,880 t NOx) was almost the same as the equivalent emissions calculated by the EMEP (55,051 t NOx).
After considering those two main streams, the remaining sources represent only 10% of the emissions. Agricultural sources (use of N–fertilizers and burning of agricultural wastes) account for 2,315 t NOx (around 2% of total emissions), which is a value slightly higher than that reported by the EMEP, namely 1,487 t.
The EMEP program (EMEP, 2008) follows the classification of emission–generating activities listed in the current version of the Selected Nomenclature for Air Pollution (SNAP97) (EEA, 2007). This classification sets up 11 major sectors. Sector 11 (other sources and sinks) includes both natural sources (volcanoes, lightning, etc.) and sources related to human activity (forest and grassland conversion, abandonment of agricultural land, etc.). These emissions should also be reported, but only emissions from sources included in SNAP97 sectors 1 to 10 can be considered by the emission reduction protocols. This could be the reason why emissions produced by sources stated in sector 11 for the Galician selected grids are zero. In our inventory, the emission equivalents to the ones of sector 11 are 7,848 t NOx, with soils being the major source. If we disregard emissions of sector 11 as well as emissions from international maritime transport, we will obtain a new figure for our inventory (116,216 t NOx) that is closer to the figure of the EMEP (107,547 t NOx).
4.2 Analysis of uncertainties
In order to estimate the uncertainty, where not established by the calculation methodology, the method developed by Frischknecht and Jungbluth (2004) was used (see section 2.3). As in the NH3 inventory, the geographical and temporal factors (U1 and U2 in Table AI in the Annex) have low values because the used data are mostly elaborated for Galicia and reported for the reference year (2001). With regard to the reliability factor (U3), all data are on level 2 or 4 (from a total of 5) because they are verified data partly based on assumptions or qualified estimation (according to expert criteria). For example, the amount of kg fuel consumed/tractor and year has been classified as level 4 because it is based on the criteria of experts, in this particular case, Nemecek et al. (2004). The basic factor (Ub) has been developed in accordance with the values proposed by Frischknecht and Jungbluth (2004) and for the categories established by these authors (energy and resources demand, infrastructures, transport, waste treatment and emissions of pollutants to air, soil and water), adopting the value of 1 in the remaining cases. Exceptionally, this basic factor has been considered 1 for the NOx emissions of road transport and industry (instead of 1.5 as proposed by Frischknecht and Jungbluth, 2004) due to the high precision of the calculated emissions. As in Part 1, the uncertainty values proposed by the methodologies are shown in Table AII in the Annex.

The estimation of emissions produced by agricultural, fishery and forest vehicles and machines involves a great uncertainty. The application of an unspecific factor was the only option due to the lack of specific data for type, age and power of the machines in Galicia. Equally, the lack of specific data is responsible for the high uncertainty associated to maritime and railway traffic.
The other great focus of uncertainty is related to natural emissions from soils and fires. In both cases, the most detailed methodologies were used (EEA, 2007); however, uncertainty is associated with the methodologies as such, which require more specific future development of the calculations.
4.3 Sensitivity analysis of the importance of fires as a source
From all the sources analyzed in Galicia, only fires are likely to suffer high variability from year to year (Fig. 1). In fact, it can be argued that emissions from other sources (such as mobile, industrial, etc.) may also change within a short time, but they are controlled by regulation and those changes will be gradual. However, anthropogenic reasons (economic, number of fire–fighting squads, etc.) and climatic characteristics (temperature, wind and humidity) can severely affect the number of burnt hectares from year to year in a region like Galicia and, therefore, the associated annual emissions of NOx.
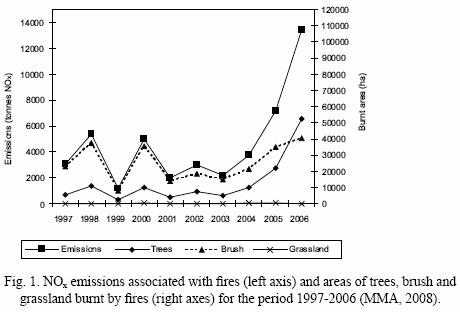
The period of study was then expanded and calculations for several years were carried out (Fig. 1). The average emissions for the period 1997–2004 were 3,195±1,457 t NOx, with the emission for 2001 (the year of reference for the whole inventory) being one of the lowest values for that period. However, the annual variation within those years seems not to have a great influence when compared with the absolute values of emission. Moving towards the years 2005 and 2006, when a high incidence of fires occurred, the level of NOx emissions produced was 7,195 and 13,434 t NOx, respectively. This can be really important when compared with other sources included in the global inventory (considering that the rest of the sources will remain in the same order of magnitude since 2001). Special attention should therefore be paid to the variability of fires when choosing the year of reference for the inventories as emissions can suffer a high variability.
5. Conclusions
The main aim of this study was the calculation of a complete regional NOx inventory for Galicia (NW Spain) together with the associated uncertainties. Although it was applied to a specific area, the procedure described in this paper can serve as a useful basis for the estimation of NOx inventories and their uncertainties in other regions.
The principal results concerning the values obtained can be summarized as follows:
• Industrial activities and mobile sources are the major sources of NOx emissions, accounting for 90% of the total inventory. In the case of industry, power and cogeneration plants are the main focus, with a share of 24 and 12% of the total emissions, respectively. Road transport stands for 33% of the emissions, principally due to passenger cars, followed by trucks and buses.
• Agricultural sources (use of fertilizers and burning of agricultural waste), soil emissions and fires represent minor sources of emissions (2, 1.6 and 5%, respectively).
• In regions that have especially been affected by fires, as in the case of Galicia, attention has to be paid to the variability over the years when defining the year of reference as this source can significantly alter the total NOx emissions.
• The emissions produced by agricultural, fishery and forest vehicles and machines as well as by maritime and railway traffic are the main focus of uncertainty due to the lack of specific data for Galicia like type, age and power of the machines. In addition, the absence of a more specific methodology is also an important source of uncertainty for the emissions originated by soils and fires.
Acknowledgments
The authors want to thank the Xunta of Galicia (PGIDIT04TAL269003PR) for the financial support of this research work. Dr. Hospido is funded by the Isidro Parga Pondal Program (Xunta de Galicia).
References
André M., U. Hammarström and I. Reynaud, 1999. Driving statistics for the assessment of pollutant emission from road transport. INRETS Report LTE 9906. Paris, France, 194 pp. [ Links ]
Andreae M. O., 1991. Biomass burning. Its history, use, and distribution and its impact on environmental quality and global climate. In: Global biomass burning: Atmospheric, climatic, and biospheric implications (J. S. Levine, Ed.). MIT Press, Massachusetts, USA, 3–21. [ Links ]
Bello P., G. Grueiro, F. Macías, D. Rodríguez, R. Rodríguez, L. Rodríguez and Y. Romero, 2004. Inventario de emisións de gases de efecto invernadoiro en Galicia. Colección Técnica de Medio Ambiente. Consellería de Medio Ambiente. Santiago de Compostela, Spain, 168 pp. [ Links ]
Camaleño, M., 2008. Inventario de emisiones procedentes de los sectores primario y terciario en Castilla y León, 2002–2005. Propuestas de mejora de la calidad ambiental. Doctoral Thesis. Universidad de Valladolid, Valladolid, Spain, 1074 pp. [ Links ]
Casares J. J., R. Rodríguez, P. Maceira, J. A. Souto, S. Ramos, M. A. Costoya, A. Sáez and J. M. Vellón, 2005. Inventario, análisis y proyección de las emisiones atmosféricas industriales en Galicia. Universidade de Santiago de Compostela. Servizo de Publicaciones e Intercambio Científico, Santiago de Compostela, Spain, 281pp. [ Links ]
Christian H. J., R. J. Blakeslee, D. J. Boccippio, W.L. Boeck, D. E. Buechler, K. T. Driscoll, S. J. Goodman, J. M. Hall, W. J. Koshak, D. M. Mach and M. F. Stewart, 2003. Global frequency and distribution of lightning as observed from space by the Optical Transient Detector. J Geophys. Res. 107 (D1), 4005. [ Links ]
CMA, 2002. Anuario climatolóxico de Galicia. Centro de Desenvolvemento Sostible. Consellería de Medio Ambiente, Santiago de Compostela, Spain, 108 pp. CMA, 2008. http://medioambiente.xunta.es/. Consellería de Medio Ambiente. July 2008. [ Links ]
CMR, 2003a. Anuario de estatística agraria 2001. Consellería do Medio Rural, Santiago de Compostela, Spain, 260 pp. [ Links ]
CMR, 2003b. Macromagnitudes agrarias 2001. Consellería do Medio Rural, Santiago de Compostela, Spain, 153 pp. [ Links ]
Crutzen P. J., L. E. Heidt, J. P. Krasnec, W. H. Pollock and W. Seiler, 1979. Biomass burning as a source of atmospheric gases CO, H2, N2O, NO, CH3C and COS. Nature 282, 253–256. [ Links ]
DGT, 2002. Anuario general estadístico, 2001. Dirección General de Tráfico, Madrid, Spain, 48 pp. [ Links ]
EEA, 2005. ETC–ACC Air emissions spreadsheet for indicators 2004. Environmental European Agency, Copenhagen, Denmark, 33 pp. [ Links ]
EEA, 2007. EMEP/CORINAIR Emission inventory guidebook – 3rd edition. 2007 Update. Technical report No. 30. Environmental European Agency, Copenhague, Denmark, 2734 pp. [ Links ]
EMEP, 2008. www.emep.int. July 2008. [ Links ]
Frischknecht R. and N. Jungbluth, 2004. Overview and methodology. Ecoinvent Database v1.1. Swiss Centre for Life Cycle Inventories, Dübendorf, Switzerland, 75 pp. [ Links ]
INE, 2008. www.ine.es. Instituto Nacional de Estadística. July 2008. [ Links ]
IPCC, 1996. Revised 1996 IPCC Guidelines for national greenhouse gas inventories: Reference manual. Workbook (Volumen 2). UK Meteorological Office, Bracknell, United Kingdom, 366 pp. [ Links ]
López J. M., L. J. Sánchez and V. Meneu, 2005. Impactos sobre el sector energético. In: Evaluación preliminar de los impactos en España por efecto del cambio climático (J. M. Moreno, Ed.). Madrid, España, 617–653. [ Links ]
MMA, 2007. Inventario de emisiones de gases de efecto invernadero de España. Años 1990–2005. Ministerio de Medio Ambiente, Madrid, Spain 396 pp. [ Links ]
MMA, 2008. http://www.incendiosforestales.org/estadisticas.asp. Ministerio de Medio Ambiente. July 2008. [ Links ]
Nemecek T., A. Heil, O. Huguenin, S. Meier, S. Erzinger, S. Blaser, D. Dux and A. Zimmermann, 2004. Life cycle inventories of agricultural production systems. Ecoinvent Database v. 1.1. Report No. 15. The Swiss Centre for Life Cycle Inventories, Zurich, Switzerland, 289 pp. [ Links ]
Novak J. and T. Pierce, 1993. Natural emissions of oxidant precursors. Water Air Soil Poll. 67, 57–77. [ Links ]
Parra R., P. Jiménez and J. M. Baldaseno, 2006. Development of the high spatial resolution EMICAT2000 emission model for air pollutants from the north–eastern Iberian Peninsula (Catalonia, Spain). Environ. Pollut. 140, 200–219. [ Links ]
Rodríguez L. and F. Macías, 2006. Eutrophication trends in forest soils in Galicia (NW Spain) caused by the atmospheric deposition of nitrogen compounds. Chemosphere 63, 1598–1609. [ Links ]
Sisterson D. L. and Y. P. Liaw, 1990. An evaluation of lightning and corona discharge on thunderstorm air and precipitation chemistry. J. Atmos. Chem. 10, 83–96. [ Links ]
UNECE, 1997. Procedures for estimating and reporting emission data under the convention on long–range transboundary air pollution. Steering Body to the Cooperative Programme for Monitoring and Evaluation of the Long–range Transmission of Air Pollutants in Europe (EMEP). Twenty–first session, Geneva, Switzerland, September 1997. [ Links ]
Williams E., A. Guenther and F. Fehsenfeld, 1992. An inventory of nitric oxide emissions from soils in the United States. J. Geophys. Res. 97, 7511–7519. [ Links ]

