


Services on Demand
Journal

Article
 English (pdf)
 Article in xml format
 Article references
 Send this article by e-mail
Indicators
 Cited by SciELO
 Related links
 Similars in
SciELO
Similars in
SciELO Share

 Permalink
Atmósfera
Print version ISSN 0187-6236
Atmósfera vol.20 n.2 Ciudad de México Apr. 2007
Tropical cyclone statistics in the Northeastern Pacific
E. ROMERO–VADILLO
Universidad Autónoma de Baja California Sur (UABCS)
La Paz, Baja California Sur, México
O. ZAYTSEV
Centro Interdisciplinario de Ciencias Marinas, Instituto Politécnico Nacional
La Paz, Baja California Sur, 23096, México
Corresponding author's e–mail: ozaytsev@ipn.mx
R. MORALES–PÉREZ
Instituto Mexicano de Tecnología del Agua (IMTA),Yautepec, Morelos, México
Received December 14, 2005; accepted September 11, 2006
RESUMEN
La principal región de la formación de ciclones en el océano Pacífico Este es el Golfo de Tehuantepec, entre los 8 y los 15° N. En su fase inicial los ciclones se mueven hacia el oeste y el noroeste. El análisis histórico de los ciclones que se han generado durante los últimos 38 años (de 1966 a 2004) muestra un promedio de 16.2 ciclones por año, consistentes en 8.8 huracanes y 7.4 tormentas tropicales. El análisis muestra una gran variabilidad geográfica en la trayectoria de los ciclones, de los cuales un gran número impacta las costas de México. Alrededor del 50% de los ciclones tropicales que se generan en el Pacífico Este recurva hacia el noreste. Los ciclones rara vez pasan de los 30° de latitud norte debido a la corriente fría de California. Las trayectorias de los ciclones del Pacífico Este pueden separarse en 5 grupos. Los datos históricos de las anomalías en la temperatura superficial del mar (SST) relacionados con los eventos de El Niño, fueron comparados con un conjunto de datos de ciclones tropicales, incluyendo frecuencia, intensidad, trayectoria y duración. Aunque la dependencia estadística entre la frecuencia de los ciclones tropicales de las categorías más abundantes en esta región, 1 y 2, y los datos de SST no fue significativa, el porcentaje de huracanes de alta intensidad (categorías 4 y 5) y los huracanes con una larga duración (mayor a 12 días) fue mayor durante los años Niño que durante los años no Niño.
ABSTRACT
The principal area of tropical cyclogenesis in the tropical eastern Pacific Ocean is offshore in the Gulf of Tehuantepec, between 8 and 15° N, and most of these cyclones move towards the west and northwest during their initial phase. Historical analysis of tropical cyclone data in the Northeastern (NE) Pacific over the last 38 years (from 1966 to 2004) shows a mean of 16.3 tropical cyclones per year, consisting of 8.8 hurricanes and 7.4 tropical storms. The analysis shows great geographical variability of cyclone tracks, and that there were a considerable number of hurricane strikes along the Mexican coast. About 50% of the tropical cyclones formed turned north to northeast. It was rare that any passed further north than 30° N in latitude because of the cold California Current. Hurricane tracks that affected the NE Pacific may be separated into 5 groups. We compared the historical record of the sea surface temperature (SST), related with the El Niño events with a data set of tropical cyclones, including frequency, intensity, trajectory, and duration. Although the statistical dependence between the frequencies of tropical cyclones of the most abundant categories, 1 and 2, over this region and SST data was not convincing, the percentage of high intensity hurricanes and hurricanes with a long life–time (greater than 12 days) was more during El Niño years than in non–El Niño years.
Keywords: Tropical cyclone, Northeastern Pacific, hurricane track statistics.
1. Introduction
Every year a number of tropical cyclones have impact on the NE Pacific subtropical zone. Sadler (1964) stated that the NE Pacific is second after the Western Pacific in its annual frequency of hurricanes. Renard and Bowman (1976) determined that a mean of nine tropical storms and five hurricanes are generated every year in the NE Pacific. Jáuregui (1981) described characteristics of the NE Pacific hurricanes, and particularly the ones that affected the northwest coast of México, using the 1962–1979 data sets. This author emphasized that the western Mexican coast was exposed to a greater number of hurricanes than the coast of the Gulf of México. The most devastating part of hurricane impact on the western Mexican coast is due to the high rainfall associated with NE Pacific hurricanes, which can reach 400 mm per day in the coastal mountain areas.
Tropical cyclones of the NE Pacific are normally generated above waters with surface temperatures higher than 27 °C between May and October, and outside the low–pressure equatorial belt. Figure 1 shows the distribution of the origins of tropical storms in the NE Pacific from 1966 to 2004. The maximum frequency zone of cyclone origin was between latitude 10 and 15° N, and between longitudes 93 and 110° W, close to the Mexican Pacific coast.

The formation of NE Pacific tropical cyclones is the topic of extensive ongoing research, and is still not fully understood. There are several favorable environmental factors in tropical cyclogenesis: warm ocean waters throughout a sufficient depth, high low–level relative vorticity, low vertical shear of zonal wind, the Coriolis parameter and pre–existing near–surface disturbance (McBride and Zehr, 1981). Cyclonic horizontal shear of the low–level (850 mb) zonal wind corresponded to high relative velocity and low vertical wind shear support tropical cyclogenesis. Tropical cyclones tend to form near regions of zero vertical shear of the zonal wind because higher vertical shear would tend to tilt the vortex circulation and suppression of convection.
Montgomery and Farrel (1992) mentioned that tropical cyclones are initiated by asymmetric interactions associated with migrating upper–level vortices and low altitude disturbances. This mechanism that explains well the genesis of many tropical cyclones in the Atlantic, is probably not very common in the NE Pacific, since the upper–level troughs migrate into the subtropics from latitude higher than 15 °C.
Many researchers (e.g. Avila and Pasch, 1992; Molinari et al., 1997) believe that eastern Pacific tropical cyclones develop frequently in association with synoptic–scale easterly waves that originate in Africa and propagate westward across the Atlantic Ocean, the Caribbean and into the NE Pacific, providing substantial convection conditions at these regions. At least, these authors note the existence of easterly waves in the western Caribbean prior to the cyclogenesis. However, localized easterly waves can be characterized as dispersive Rossby wave packets, in which a local wave disturbance upon poor conditions of convection would weaken and lose its structure before reaching the NE Pacific (Molinari et al., 1997). Initially the eastern wave disturbances contain considerable convection, but typically convection is not maintained over the cool central Atlantic (Carlson, 1969). So, the amplitude of easterly waves leaving Africa has little correlation with the likelihood of a wave over the NE Pacific region. Although synoptic–scale easterly waves reach the NE Pacific regularly, it is not obvious that all of them could be sufficiently intensive to affect significantly tropical cyclogenesis. Nevertheless, some periodical features of the easterly waves have been registered over the NE Pacific region (Molinari and Vollaro, 2000; Fuller and Stensrud, 2000).
Easterly waves may interact with other, low–frequency phenomena over the Pacific, such as the eastward–propagating Madden–Julian Oscillation (MJO) that has a baroclinic mixed Kelvin and Rossby wave structure with a characteristic period of 30–60 days (Madden and Julian, 1994). During certain phases of the MJO a modulation of both the 850 mb zonal wind and convective activity occurs over the NE Pacific near México and Central America (Maloney and Hartmann, 2000). Maximum positive amplitude of the MJO cycle provokes westerly 850–mb wind anomalies with intensified convection and high relative vorticity, and negative amplitude accompanies easterly 850–mb anomalies with suppressed convection and low relative vorticity. Figure 2, adapted from Maloney and Hartmann (2000), shows favorable conditions for cyclone formation in the NE Pacific during the maximum MJO period. These authors assumed that the interaction between intensified convection of easterly waves and westerly 850 mb wind anomalies during active period of the MJO wave may be considered the hypothetical mechanism of tropical ciclogenesis modulation, and about 50% of the June–September time series and about 60 % of the May–November series during 1979–95 are spanned by significant MJO events.
The trajectories of the tropical cyclones varied over a wide range. Rosendal (1962) found that a third of the NE Pacific hurricanes moved towards the land or passed close to the coast, but almost all of them reached Mexican territory or coastal waters. The typical moving velocity of cyclones reaching Mexican territory or coastal waters was 20 to 30 km h–1. Their diameter varied from 75 to 1300 km, which was partly related to the maturity of the hurricane, with older ones at peak intensity being larger. The life–time of tropical cyclones in the NE Pacific varied from 9 to 25 days, and they traveled up to 3000 km from their initiation points.
Until 1966, tropical hurricane tracking was mainly based on sea and land observations, with aerial surveys sometimes being used as well. After 1966, satellite observations provided high resolution information to study all the physical features and fields related to cyclonic activity.
The intensity of tropical cyclones and their trajectories depend on several variables such as atmospheric pressure, sea surface temperature (SST), and evaporation rate. An empirical, nonlinear relationship has been established between SST and the maximum intensity that a hurricane can reach (De Maria and Kaplan, 1994). Whitney and Hobgood (1997) analyzed the influence of SST on the maximum potential intensity of tropical cyclones over the NE Pacific and found that during 1963–1993 these storms did not attain the intensity of the tropical cyclones over the Atlantic Ocean.
It was also found that tropical cyclones that developed to the west of 110° W more frequently attained a higher intensity than those that developed to the east of 110° W.
Hobgood (1998) tested the influence of 10 climatologic and persistence variables (latitude, maximum wind speed, 12–h change of maximum wind speed, longitude, distance from land, Julian date, SST, speed of displacement, and latitudinal and longitudinal components of the motion) on cyclone intensity overtheNE Pacific from 1982to 1987 and from 1988 to 1993. Latitude, maximum wind speed, and the 12–h change of maximum wind speed were the most significant variables.
One of the most important statistical characteristics of cyclonic activity is frequency or return period. Peredo, et al. (1998) studied the NE Pacific hurricane return period for hurricanes from 1949 to 1995, and roughly estimated that the return period of category 4 hurricanes touching the Mexican coast was about 11 years.
Chu and Wang (1998) studied the return period of wind velocity in the vicinity of Hawaii. For velocities of 125, 110, 100, 80, 64, 50, and 34 km h–1 the return periods were estimated as 137, 59, 33, 12, 6.6, 4, and 3.2 years. Previously, Chu and Wang (1997) had statistically tested historical records (1949–1995) of the intensity of cyclonic storms during El Niño and non–El Niño periods. They found there was a significantly greater frequency of the more intense storms during El Niño events.
Our work analyzes the frequency, trajectory and intensity of tropical cyclones generated in the NE Pacific transition zone for the period when satellite data was available (1966–2004).
2. Data and methods
The data used (number of cyclones, intensities, trajectories, maximum wind speeds, central pressures and categories) were provided by the Unisys Corporation on its web page http://www.weather.unisys.com/hurricane/e_pacific/ (consulted in April, 2004) by courtesy of the NOAA National Hurricane Center.
The number of tropical hurricanes by category, month of occurrence and their duration was compared for El Niño years and non–El Niño years, from 1966 to 2004, using the chi–square statistical test (Emery and Thompson, 1997).
To compare the historical record of the equatorial NE Pacific SST index provided by the NOAA Climate Prediction Center (CPC) on its web page http://www.cpc.ncep.noaa.gov/data/indices/, (consulted in June, 2006) with a data set of tropical cyclones, a cross spectral analysis was applied, calculating the spectral densities for both time–series, cross– and coherence spectra.
Monthly climate composites for the low–troposphere wind and sea level pressure were analyzed to establish the relationship between these parameters and trajectories of tropical hurricanes. To do this we used the data base of the NOAA–CIRES Climate Diagnostics Center provided on its web page http://www.cdc.noaa.gov/cgi–bin/Composites/printpage.pl (consulted in June, 2006) .
4. Results and discussion
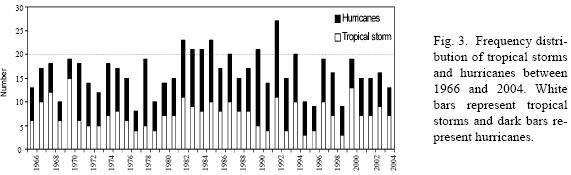
Averaging all the data from 1966 to 2004, 16 cyclones were generated annually in the NE Pacific (Fig. 3), with the largest number recorded (28) in 1992. About 55% of the cyclones reached hurricane status with wind speeds above 117 km h –1. The annual mean values of hurricanes of category 1, 2, 3, and 4 were 4, 2, 2 and 2, respectively (Table I). During the 38–year period, only 9 hurricanes of category 5 were recorded. The months with major cyclonic activity were from July to September (70%) and cyclone life–times varied from 1 to 25 days with a mean of 6.5 days.

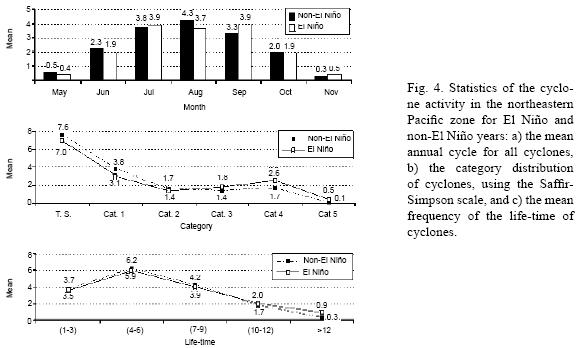
We analyzed the difference between the hurricane frequencies in the El Niño (1969, 1972–73, 1976–77, 1982–83, 1986–87, 1991–93, 1997–98 and 2002) years and non–El Niño years. All categories of the tropical hurricanes were analyzed separately to establish a relationship between tropical hurricane intensity and El Niño activity (Fig. 4). The number of tropical hurricanes observed between 1966 and 2003 is shown in Table I. Figure 4a presents a comparison between the monthly mean number of cyclones for El Niño and non–El Niño periods. Chi–square testing (for the confidence interval of 0.95) showed that the difference between these parameters was statistically significant for the tropical storms and for the strong hurricanes only (categories 4 and 5); there were no statistical difference between the hurricane frequencies in El Niño and non–El Niño years for the most abundant categories 1 and 2. So, there would appear to be a slight trend toward more intense and long–lived hurricanes of categories 3, 4 and 5 during El Niño years. Hypothetically we suppose that the only reason of the no significant statistical difference for the 1 and 2 categories of the hurricanes in this analysis may be due to the insufficiently large time series during El Niño years and the small number of hurricanes in some categories. Further data collection in subsequent years will verify if this apparent trend is real, but the possibility of its existence warrants some discussion here. Warm surface waters during El Niño years promote latent heat increasing in the lower atmosphere and provide good conditions for the development of stronger hurricanes. In these years, an increased percentage of high–energy hurricanes would be expected. Analysis of the hurricane frequencies for both the El Niño and non–El Niño years (Fig. 4b) shows that the mean number of tropical storms was actually less during the El Niño years than during the non–El Niño years. Contrastingly, the mean frequencies for categories 3, 4, and 5 were larger during El Niño years than during non–El Niño years. These two points are in good agreement with the idea that higher surface temperature and evaporation should maintain the advanced stages of hurricane evolution. In addition, as was predicted, there is some evidence that during El Niño years, hurricanes have greater life–time (Fig. 4c; Table II).

The time–series of cyclone periodicity has been compared with the anomaly of the equatorial NE Pacific SST index. We calculated spectral densities for time–series, cross– and coherence spectra (Fig. 5). Well–marked 12 month and 6 month peaks in the spectral density of cyclone frequency (Fig. 5a) did not become apparent in the SST anomalies spectral density (Fig. 5b), what points to weak direct coupling between these processes for the periods of 1 year and less than 1 year. But the cross amplitude spectrum, and, especially the squared coherency spectrum, show joint periodicity for the 18, 30 and 46 months periods.
Magaña et al. (1999) analyzed physical conditions that could affect cyclogenesis and the evolution of hurricanes during El Niño and La Niña years, by considering the SST anomalies, air humidity in the lower atmosphere; and the wind shear between the lower level and the top of the troposphere (850 and 200 mb) in the area between 120 and 95° W longitude and between 10 and 20° N latitude. The most marked changes between El Niño and La Niña years occurred in the SST distributions. Appreciable changes in the amount of humidity were not observed in the region and they found that the role of wind shear was minimal.
The tropical cyclone trajectories varied widely, covering a great part of the NE Pacific zone between latitude 8 and 30° N (Fig. 6a). Figure 6b shows spatial density of tropical cyclone trajectories, demonstrating that the region between longitude 97 and 130° W and between latitude 10 and 20° N was heavily affected by tropical cyclones, with the highest cyclonic activity being between 105 and 110° W and between 15 and 20° N.

Analysis of historical data shows that all trajectories of the cyclones in the NE Pacific may be separated into 5 main groups.
The first group consisted of cyclones that formed and moved westward. Fifty percent of all cyclones have this type of trajectory. All these trajectories were long, and the cyclones had a long life–time (Fig. 7a). They moved westward above a hot sea surface and did not touch the coast, so they could maintain their energy for a long period, traveling a long way and reaching high intensities. The greatest frequency was recorded in July (Fig. 7b), when tropical storms and hurricanes of category 4 were most frequent (Fig. 7c).
The cyclones that moved towards the northwest constituted the second group. They paralleled the coasts until they disappeared (Fig. 8a). Although the eye of the hurricane did not usually touch land and did not enter the Gulf of California, the Mexican coast was heavily affected by precipitation. Sometimes the surge–favorable storm winds caused near–shore sea level variations. This type of trajectory occurred mainly in August and September (Fig. 8b) and was dominated by category–1 tiged to this group.

The third group was formed by cyclones that moved first to the northwest and then curved towards the northeast between latitudes 15 and 22° N (Fig. 9a). About 10% of the hurricanes followed this path. These trajectories are close to being parabolic. In the first portion of the trajectory, cyclones moved towards the west or west–northwest with a speed of 15 to 20 km h–1 and maximum winds to 80 km h–1. Before turning to the northeast, their speed was between 7 and 11 km h–1. This reduction in speed may have been indicative of the change of direction during the following 6 hours. At the same time, wind intensity increased up to 160 – 200 km h–1, converting the hurricane into its most ferocious stage. The third part of the parabola was generally located between the tropic of Cáncer (23° 27' N) and 30° N, where the cyclones moved onshore into México. At this point the cyclones speed increased to about 28 – 30 km h–1, and the maximum wind speed decreased to about 130 km h–1, indicating weakening and termination (Flores, 1998). These cyclones crossed land, causing great damage to the human population because of strong winds and heavy precipitation. This group of trajectories were most frequent in September (Fig. 9b), and they were mainly category–1 hurricanes (Fig. 9c).
The cyclones of the fourth group moved towards the northwest, parallel to the Mexican coast, and curved towards the west between 20 and 25° N latitude (Fig. 10a). These trajectories were more frequent in July (Fig. 10b), and there were more hurricanes of category 2 than of category 1, with the same number of tropical storms as category 2 hurricanes (Fig. 10c). This type of trajectory was not common (8%), but they also affected the Mexican coasts.

The fifth group comprised the least number of cyclones, only about 2% of the cyclones of the NE Pacific. They moved towards the north (Fig. 11a). These cyclones moved up into the Gulf of California, sometimes passing close to the peninsular coast, until they arrived at the coast of Sinaloa or Sonora. The cyclones of this group affected the upper water layer dynamics in the mouth of the Gulf of California. September was the month of their greatest frequency (Fig. 11b), and there were the same number of tropical storms as category–1 hurricanes (Fig. 11c).
The remaining 5% had anomalous trajectories. They had different spirals, meanderings, or zigzag movements. Tropical cyclones with changeable tracks generally have weak steering flow. In these cases, secondary effects like interactions with mesoscale circulations and meanders, binary interactions with other storms, etc. may affect storm moving. Flores (1998) explained these erratic trajectories in the Eastern Pacific by cold water, which was displaced southward or penetrated into the warm equatorial countercurrentthat enters the Gulf of Tehuantepec. Holland and Lander (1992) suggested that many meandering paths occurred because of the interaction between meso–scale vortices and the convective system of the cyclone circulation.
The cyclone trajectories depend significantly on the tropospheric wind circulation around high–pressure areas. Figure 12 shows monthly climatic fields for both the vertically averaged (850– 200 mb layer) low–troposphere winds and the sea level pressure for June (a), July (b), August (c), September (d) and October (e), during the period from 2001 to 2005.

In June, the hurricanes traveled mainly westward below the 20° N latitude (Fig. 7) following the pattern of winds that is shown in the Figure 12a.
Fig. 12b shows that in July an intensive anticiclonic structure was developed in the troposphere (mainly in the 400 – 200 mb layer) over both the Mexican territory and the Gulf of México (between the 20 and 30° N, and 120 and 80° W), which remained during August (Fig. 12c). In these months southeastern winds were observed along the costs of México, propitiating trajectories that belong mainly to the group 2 and moved towards the northwest (Fig. 8).
In September, the intensity of the anticyclone diminished, causing winds from the west over most of the Baja California peninsula that affected the trajectories of the hurricanes, propitiating a turn towards the north (Fig. 11) and northeast (Fig. 9). These hurricanes of groups 3 and 5 can impact the Mexican costs.
In October the anticyclone has practically vanished, and winds from the west dominated above almost the whole Mexican territory. In October, hurricanes of group 3 with trajectories curving towards northeast were frequently observed.
The charts of surface atmospheric pressure (Fig. 12, right panels) show that in the period from June to October there was a low pressure trough between the California High anticyclone and the anticyclonic structure over the Mexican territory. This trough permits tropical cyclones to move northward.
During June and July a zonal gradient of pressure to the west from the 120° W longitude was practically negligible, allowing hurricanes to move westward.
The pressure maps corresponding to August and September (Fig. 12c and d) show that the low–pressure area extended as far as 35° N. This trough, coupled with the high SST during this period, forms favorable conditions for the 3 and 5 groups trajectories, when hurricanes can reach higher latitudes and even curve towards the east. Hurricanes that have sufficient energy to pass north the 22° N may move up into the Gulf of California and on Sinaloa, México.
Forty–eight hurricanes have affected Mexican coastal lands from 1965 to 2003. There was one per year on average, causing considerable loss of human lives and disruption of the economy. The most notable hurricanes that have touched the Mexican coast and caused massive destructions have been:
– hurricane Olivia (cat. 3, 22–25 Oct, 1975) affected the coast of Nayarit (Fig. 13a);
– hurricane Liza (cat. 4, 25 Sep – 2 Oct, 1976) heavily affected Baja California Sur (Fig. 13b);
– hurricane Madeline (cat. 4, 29 Sep – 8 Oct, 1976) entered Michoacan (Fig. 13c);
– hurricane Kiko (cat. 3, 25 –29 Aug, 1989) crossed the south of Baja California (Fig. 13d);
– hurricane Virgil (cat. 3,1–5 Oct, 1992) entered Michoacán and Jalisco (Fig. 13e);
– hurricane Winifred (cat. 3,6–10 Oct, 1992) touched land in Jalisco (Fig. 13f);

It is remarkable that seven of the eight mentioned strong hurricanes have developed in the end of September and the begining of October under the dynamic conditions showed in Figure 12d.
3. Conclusions
From 1966 to 2004 a mean of 16 tropical cyclones, 9 hurricanes and 7 tropical storms, have affected the Mexican Pacific zone annually. The principal area of tropical cyclogenesis was located offshore in the Gulf of Tehuantepec, between 8° N and 15° N latitudes. The main cyclonic activity was in July, August, and September. The percentages of high intensity hurricanes (categories 3, 4, and 5) and hurricanes with a life–time longer than 12 days were greater in El Niño years than in the non–El Niño years.
The hurricane trajectories affecting the Mexican Pacific zone may be separated into 5 main groups. Fifty percent of all cyclones generated in the NE Pacific maintained their trajectory westward. About 25% of the total moved to the northwest along the coast and 15 % moved first to the northwest and later curved to the northeast. Hurricanes moving northwest and then curving west composed the fourth group at about 8% and just 2% of the hurricanes moved north into the Gulf of California.
In June and July most of the hurricanes moved towards the west, and tropical storms were more numerous than hurricanes. During August and September, hurricanes reached higher latitudes (sometimes up to 30° N) and had greater intensity. In October, a number of the strongest hurricanes impacted Mexican coast were observed.
Acknowledgments
This research was supported by Mexico's Instituto Politécnico Nacional (research project 990430). We thank UNISYS and NOAA–CDC for their permission to use the data set of trajectories and the intensity of the cyclones in the NE Pacific. We also thank Dr. Darren Sage who edited the English–language text. The paper greatly benefit from the comments of two anonymous reviewers.
References
Avila L. A. and R. J. Pasch, 1992. Atlantic tropical systems of 1991. Mon. Wea. Rev. 120, 2688–2696. [ Links ]
Carlson T. N., 1969. Some remarks on African disturbances and their progress over the tropical Atlantic. Mon. Wea. Rev. 97, 716–726. [ Links ]
Chu P–S. and J. Wang, 1997. Tropical cyclone occurrences in the vicinity of Hawaii: are the differences between El Niño and non–El Niño years significant? J. Climate 10, 2683–2689. [ Links ]
Chu P–S. and J. Wang, 1998. Modeling return periods of tropical cyclone intensities in the vicinity of Hawaii. J. Applied Mete orol. 37, 951–960. [ Links ]
De Maria M. and J. Kaplan, 1994. Sea surface temperature and the maximum intensity of Atlantic tropical cyclones. J. Climate 7, 1324–1334. [ Links ]
Emery W. J. and R. E. Thompson, 1997. Data analysis methods in physical oceanography. Pergamon Press, 634 pp. [ Links ]
Flores Z. E., 1998. Geografía, agua y ciclones. In: Geosudcalifornia, (Z. Flores, Ed.)Universidad Autónoma de Baja California Sur, México, 23–59. [ Links ]
Fuller R. D. and D. J. Stensrud, 2000. The relationship between tropical easterly waves and surges over the Gulf of California during the North American Monsoon. Mon. Wea. Rev. 128, 2983–2989. [ Links ]
Hobgood J. S., 1998. The effects of climatological and persistence variables on the intensities of tropical cyclones over the Eastern North Pacific Ocean. Wea. Forecasting, 13, 632–639. [ Links ]
Holland G. J. and M. Lander, 1992. The meandering nature of tropical cyclone tracks. J. Atmos. Sci. 50, 1254–1266. [ Links ]
Jauregui, E. (1981). Vulnerability to tropical cyclones in the northwest coast of México. Third international symposium on urban emergencies, La Paz, B. C. S., SAHOP, Institute de Geografía UNAM, Nov., México, 1–14. [ Links ]
Madden R. A. and P. R. Julian, 1994. Observations of the 40–50–day tropical oscillation –A Review. Mon. Wea. Rev. 122, 814–837. [ Links ]
Magaña V., J. L. Pérez, J. L. Vázquez, E. Carrisoza and J. Pérez, 1999. El Niño y el clima. In: Los impactos de El Niño en México. V. Magaña– Rueda (Ed.), Centro de Ciencias de la Atmósfera, UNAM, México, 23–66 pp. [ Links ]
Maloney E. D. and D. L. Hartmann, 2000. Modulation of Eastern North Pacific Hurricanes by the Madden–Julian Oscillation. J. Climate 13, 451–1460. [ Links ]
McBride J. L. and R. Zehr, 1981. Observational analysis of tropical cyclone formation. Part II: Comparison of Non–developing versus developing systems. J. Atmosph. Sci. 38, 1132–1151. [ Links ]
Molinari J. , D. Knight, M. Dickinson , D. Vollaro and S. Skubis, 1997. Potential vorticity, easterly waves, and eastern Pacific tropical cyclogenesis. Mon. Wea. Rev. 125, 2699–2708. [ Links ]
Molinari J. and D. Vollaro, 2000. Planetary– and synoptic–scale influences on eastern Pacific tropical cyclogenesis. Mon. Wea. Rev. 128, 3296–3307. [ Links ]
Montgomery M. and B. F. Farrell, 1992. Tropical cyclone formation. J. Atmosph. Sci. 50, 285–310. [ Links ]
NOAA Climate Prediction Center Web page, 2006. www.cpc.ncep.noaa.gov/data/indices/ (consulted in June, 2006). [ Links ]
NOAA–CIRES (Cooperative Institute for Research in Environmental Sciences) Climate Diagnostics Center Web page, 2006. www.cdc.noaa.gov/cgi–bin/Composites/printpage.pl, consulted in June, 2006) [ Links ]
Peredo J. I., I. Jimenez, V. J. Ledezma and B.C. Nava, 1998. Un modelo estadístico para la estimación del periodo de retorno de huracanes en el Nor–Pacífico Mexicano, p. 1–11. In: Oceanología, Vol. 19, DECYTEM, SEP, México. [ Links ]
Renard R. and W. Bowman, 1976. The climatology of Eastern North Pacific tropical cyclones. Naval Prediction Research Facility, Tech. Paper 7–76, Monterrey, CA, p.113. [ Links ]
Rosendal H., 1962. Eastern North Pacific tropical cyclones. 1947–63. Mariners Wea. Log, 6, 195–201. [ Links ]
Sadler J. C, 1964. Tropical cyclones of eastern north Pacific as revealed by TIROS. J. Appl. Meteorol. 3, 347–66. [ Links ]
UNISYS Corporation Web page, 2004. www.weather.unisys.com/hurricane/e_pacific/ (consulted in April, 2004). [ Links ]
Whitney L. D. and J. S. Hobgood, 1997. The relationship between sea surface temperatures and maximum intensities of tropical cyclones in the Eastern North Pacific Ocean. J. Climate 10, 2921–2930. [ Links ]

