


Services on Demand
Journal
Article
 English (pdf)
 Article in xml format
 Article references
 Send this article by e-mail
Indicators
-
 Cited by SciELO
 -
 Access statistics
Related links
-
 Similars in
SciELO
Similars in
SciELO
Share

 Permalink
Atmósfera
Print version ISSN 0187-6236
Atmósfera vol.16 n.3 Ciudad de México Jul. 2003
Meteorological objective analysis using three-dimensional numerical variational technique
S. K. Sinha*, S.G. Narkhedkar, M. Mahakur and P.N. Mahajan
Indian Institute of Tropical Meteorology, Dr. Homi Bhabha Road, Pune - 411 008, India. *Corresponding author: e-mail: sinha@tropmet.res.in.
Received September 5, 2002; accepted March 20, 2003.
RESUMEN
En este artículo se desarrolla un esquema objetivo de análisis utilizando una técnica de variación numérica tridimensional sobre la región de la India y sus alrededores suponiendo condiciones del viento cuasigeostróficas y térmicas. Se realizaron análisis de altitud, viento y temperatura de campos a diferentes niveles de presión para el caso de la depresión que se formó sobre la bahía de Bengala durante el periodo del 26 al 31 de julio de 1991. El esquema de análisis es capaz de capturar el sistema y de resaltar la importancia del calentamiento troposférico superior antes de la formación de la depresión del monzón.
ABSTRACT
In this paper an objective analysis scheme using a three-dimensional numerical variational technique has been developed over India and the surrounding region based on the assumption of quasi-geostrophic and thermal wind conditions. Analyses of height, wind and temperature fields at different pressure levels have been made for the depression case which is formed over the Bay of Bengal during the period 26 to 31 July 1991. The analysis scheme is able to capture the system and to bring out the importance of upper tropospheric warming before the formation of the monsoon depression.
Key words: Numerical variational objective analysis, upper tropospheric warming, monsoon depression.
1. Introduction
In order to produce balanced analysed data two kinds of schemes are available viz. multivariate optimum interpolation method, which is a multivariate version of the optimum interpolation method formulated by Gandin (1963), and numerical variational objective analysis (NVOA) which was first formulated by Sasaki (1958) by applying the technique of calculus of variations by subjecting the meteorological variables to dynamical constraints. The basic approach of this method is to optimize a function in a domain under certain constraints, such as diagnostic or prognostic relations. Sasaki (1969, 1970) extended his original formulation to include time varying functions and catagorize the constraints as strong or weak constraints.
Lewis and Grayson (1972) applied Sasaki's variational technique for the adjustment of surface wind and pressure. They used horizontal momentum equations as dynamical constraints for the adjustment of sea level pressure and wind field. Their case study exhibited pronounced small scale features when the wind information was incorporated in the pressure field. Lewis (1972) has also applied the variational optimization technique for the upper air analysis using hydrodynamical equations as constraints. A two-dimensional numerical variational objective analysis scheme which was developed by Sinha et al. (1998) has been further extended to include temperature and a case of depression which formed during 26-31 July 1991 over the Bay of Bengal was considered for this study.
2. Methodology
2.1 Variational scheme
In regard to the variational optimization of meteorological parameters the functional constraints considered are quasi-geostrophic and thermal wind equations. Using the techniques of calculus of variations and the quasi-geostrophic and thermal wind equations, the geopotential increment (Φ') can be obtained by solving the following equation (details in Appendix):

where α, β and γ are weights and

is the relative vorticity of the observed wind, and the three dimensional Laplacian operator is given by

In the finite difference form equation (1) can be expressed as
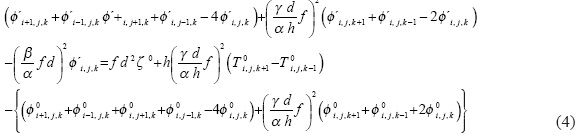
where d and h represent the horizontal and vertical sizes respectively. The values of the ratios involving α, β, γ in terms of the parameter of accuracy (e) are given by


where L and H are the horizontal wave length and vertical extent of a system respectively.
2.2 Decoupling of geostrophic approximation
Geostrophy is used to relate the height with velocity and stream function. But this approximation is not valid within a radius of deformation from the equator (250 km=0.044 rad). Hence the height and velocity fields are decorrelated by introducing a latitudinal (θ) dependent decoupling factor K (Carton and Hackert, 1989), such that

Once the geopotential height increments (Φ') are obtained the wind temperature increments (u', v' and T') are obtained from


3. Data and synoptic situation
In this study, objectively analysed values of height, wind and temperature fields by univariate optimum interpolation method at 850, 700, 500, 300 and 200 hPa levels for 26 to 31 July 1991, 00Z were used as input field. The observations from INOSHAC charts at the above levels including surface were collected for said period over India and the surrounding region. The first guess fields used were taken from the daily global data analysis system at the National Centre for Medium Range Weather Forecasting (NCMRWF), New Delhi.
During this period a cyclonic circulation extending up to the mid-tropospheric level was observed on 25 July over the North Bay and the adjoining Central Bay. Under the influence of this cyclonic circulation a low pressure area was formed over the Northwest Bay and surroundings on 26 July. It concentrated into a depression with its centre at 20.5°N and 89.5°E on 27 July. On the next day, it further intensified into a deep depression with its centre about 150 km Southeast of Kolkata (21.5°N, 88.0°E). It crossed the Orissa coast near Paradeep on 29 July and lay over North Orissa, adjoining Bihar Plateu and East Madhya Pradesh. It moved in westnorthwest direction and on 30 July it was laying over the central parts of Madhya Pradesh (centred at 22.5°N, 80.0°E). It weakened into a depression with its centre at 21.5°N, 76.5°E on 31 July.
4. Results and discussions
In studying the development and movement of the depression and the conditions that may have influenced it, attention was given towards the formation of the initial perturbation and the intensification of the depression in contest with the temperature field. The scarcity of observations make the analyses at upper levels extremely difficult and uncertain. As it is well known that although all the upper levels are important for understanding the intensification and movement of the depression, 500 and 200 hPa levels are of main concern. The flow at 200 hPa is frequently used to determine the conditions favourable for development of depression, while the 500 hPa flow is used to forecast the motion.
The domain of our analysis extends from 0° to 40°N and 40°E to 110°E with a grid resolution of 2°. The input field for the variational analysis was obtained from the univariate optimum interpolation method (Gandin, 1963). The ratios involving α, β, γ in terms of the parameter of accuracy e (equations 5, 6) play an important role in leading to the analysis of meteorological fields. Sasaki (1958) has theoretically discussed the impact on the analysis due to the changes in the values of e. Figure 1 shows the variation of W2 and W3 as a function of ratios (L/d) and (d/L)(H/h) respectively for different combinations of e2 and e3.
Objective analyses with different combinations of e2 and e3 have been carried out and satisfactory analyses are obtained for e2= 0.66 and e3 = 0.66 x 10⁻⁵. The second order partial differential equation in finite difference form equation (4) was solved with the boundary conditions as the observed values in the boundary. The relaxation technique was used to solve equation (4). As mentioned earlier, analyses for the levels 850, 700, 500, 300 and 200 hPa have been made and results for the height and wind analysis at 850 hPa and temperature analyses for 500, 300 and 200 hPa are presented here.
4.1 Height and wind analysis
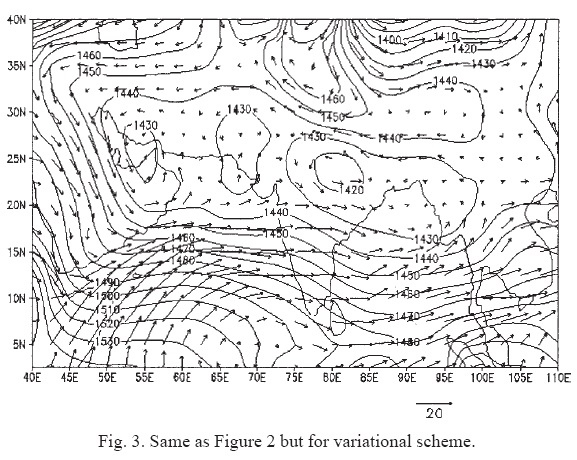
The objective of the study is to produce analyses of height and wind in balance. In order to examine this feature, height and wind analyses were plotted on the same chart for 850 hPa level for 26 and 27 July separately.
Figures 2 and 3 correspond to analyses using univariate and variational schemes respectively for 26 July. Figures 4 and 5 are for 27 July. From figures 2 and 4 cross isobaric flows can be observed in a number of places. In the case of the analysis with variational technique (Figs. 3 and 5) the winds are parallel to the isobars. This suggests that after the variational technique has been applied to the UOI analysis the height and wind fields are in balance. Similar features are observed on different days and levels. The low pressure area on 26 July at 850 hPa level over the Bay of Bengal that was observed in the input field (Fig. 2) is well reflected in the variational analysis. Since geostrophic coupling is not valid near the equator, the height and wind fields are decoupled using equation (7). Analyses obtained by variational scheme are similar to those reported from climatological studies (Rao, 1976) as well as to the synoptic features associated with the monsoon depression as published by India Meteorological Department.


4.2 Temperature field
Climatological aspects of the monsoon depression show the upper tropospheric warm anticyclonic circulation centred over Tibet with its ridge extending up to very large distances in the east-west direction and the meridional temperature gradient in the troposphere with the higher temperature centred near 30°N (Sikka, 1977) (Figs. 6a and 6b).
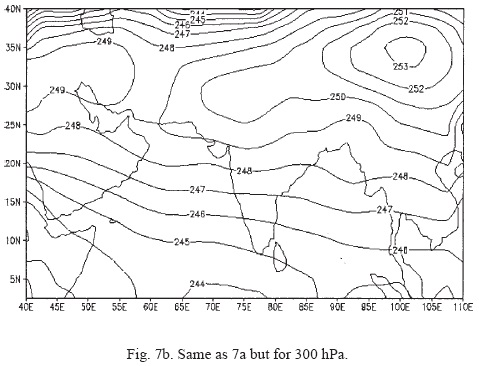
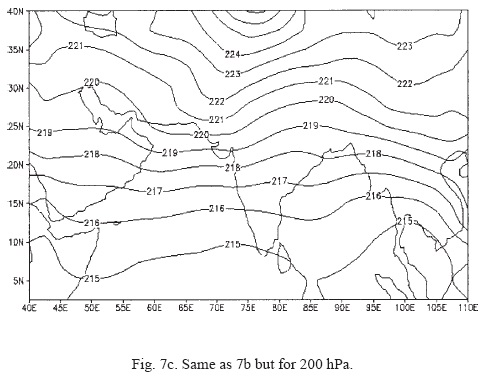
In the present study we have made temperature analyses using the variational technique for the levels and date mentioned earlier. We present here the analyses of 500, 300 and 200 hPa levels. We examined the temperature analyses in association with the life cycle of the monsoon depression mentioned above and described the changes in the upper air temperature during the formation, development and maintenance of the system.
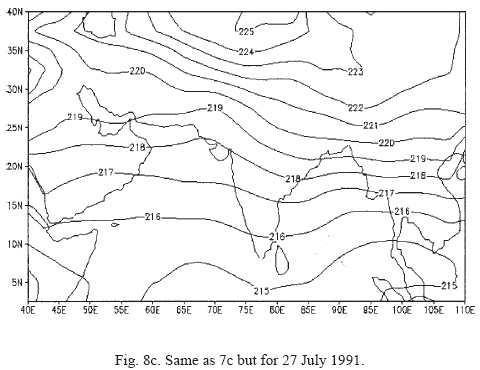
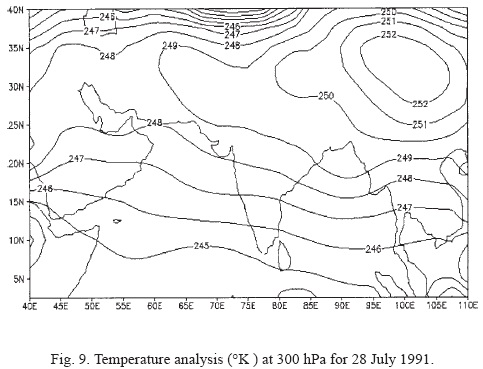
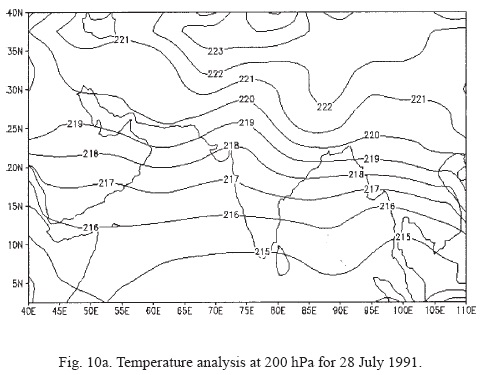
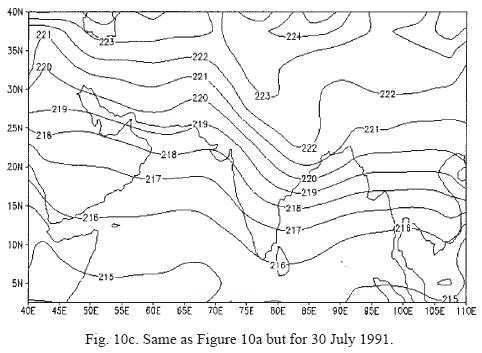
The analysis of temperature field shows a similar picture as observed in comparable systems over the Bay of Bengal region. Temperature analyses of 26 July 1991 (Figs. 7a-b-c) showed that the highest temperatures at 500, 300 and 200 hPa levels were in normal positions, i.e., east of 80°E, 30°N, 90°E and 30°N, 88°E respectively, and their magnitudes were 270°K at 500 hPa, 253°K at 300 hPa and 222°K at 200 hPa. Temperature analysis of 27 July, when the low pressure concentrated into a depression, are shown in figures 8a-b-c. A maximum temperature of252°K was observed over the depression area on 28 July at 300 hPa level (Fig. 9). Figures 10a-b-c show the temperature analysis at 200 hPa for 28 to 30 July. -south temperature gradient weakened. Thus, the temperature analysis made using the variational scheme is able to reflect the formation and life cycle of monsoon depression consistent with the observations.


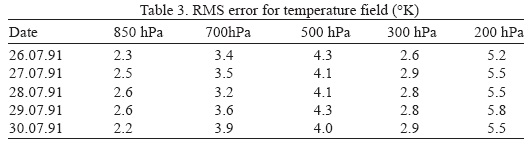
For quantitative analysis root mean square (RMS) errors were computed by comparing the variational analysis with the observations. For this purpose the analysed values of height, wind and temperature were interpolated at the observation locations. Tables 1, 2, and 3 showed the RMS errors for different levels and days for height, wind and temperature fields respectively.


5. Conclusions
A three-dimensional numerical variational objective analysis scheme has been developed to study geopotential height, wind and temperature fields simultaneously. Objective analyses for a typical synoptic disturbance which formed over the Bay of Bengal during 26 to 31 July 1991, 00Z have been made and the following conclusions have been drawn.
• This scheme produced a balanced field of height and wind in middle and high latitude.
• As geostrophic coupling is not valid near the equator, the height and wind fields are decoupled using a decoupling factor.
• The variational scheme is able to capture the system well and the analyses are comparable to the analyses produced by the global data analysis system at NCMRWF, New Delhi.
• Upper air temperature analyses have brought out the shift of the Tibetan anticyclone and strong meridional temperature gradient before the formation of the monsoon depression and also the development and maintenance of the system consistent with the observations. Thus, it can be concluded that this new scheme is able to depict the system and bring out the influence of upper tropospheric warming on lower tropospheric flow.
Acknowledgements
The authors would like to thank Dr. G.B. Pant, Director, Indian Institute of Tropical Meteorology, Pune, for his encouragement and Dr. S.S. Singh, Head, F.R.D., for his interest in this study. Thanks are also due to the Indian Meteorological Department for the data.
References
Carton, J. A. and E. C. Hackert, 1989. Application of multivariate statistical objective analysis to the circulation in the tropical Atlantic ocean. Dynamics of Atmospheres and Oceans 13, 491-515. [ Links ]
Daley, R., 1991. Atmospheric data analysis. Cambridge Univ. Press, Cambridge, Ch.8, 457. [ Links ]
Gandin, L. S., 1963. The objective analysis of meteorological fields. Israel program for scientific translations, Jerusaleam, 240. [ Links ]
Lewis, J. M., 1972. An operational upper air analysis using variational method. Tellus 24, 514-530. [ Links ]
Lewis, J. M. and T. H. Grayson, 1972. The adjustment of surface wind and pressure by Sasaki's variational matching technique. J. Appl. Meteor. 11, 586-597. [ Links ]
Rao, Y. P., 1976. Southwest Monsoon, Meteorological Monograph. No. 1, Indian Meteorological Department. [ Links ]
Sasaki, Y., 1958. An objective analysis based on the variational method. J. Meteor. Soc. Japan 36, 77-88. [ Links ]
Sasaki, Y., 1969. Proposed inclusion of time variation terms, observational and theoretical, in numerical variational objective analysis. J. Meteor. Soc. Japan 47, 115-124. [ Links ]
Sasaki, Y., 1970. Some basic formalisms in numerical variational analysis. Mon. Wea. Rev. 98, 875-883. [ Links ]
Sikka, D. R., 1977. Some aspects of life history, structure and movement of monsoon depression, PAGEOF 115, 1501-1529. [ Links ]
Sinha, S. K., S. G. Narkhedkar and S. Rajamani, 1998. Application of Sasaki's numerical variational technique to the analysis of height and wind fields over Indian region. Mausam 49, 1-10. [ Links ]

