


Services on Demand
Journal
Article
 English (pdf)
 Article in xml format
 Article references
 Send this article by e-mail
Indicators
-
 Cited by SciELO
 -
 Access statistics
Related links
-
 Similars in
SciELO
Similars in
SciELO
Share

 Permalink
Atmósfera
Print version ISSN 0187-6236
Atmósfera vol.15 n.2 Ciudad de México Apr. 2002
Pacific Decadal Oscillation and the filled capacity of dams on the rivers of the Gulf of California continental watershed
BRITO-CASTILLO, L.
Centro de Investigaciones Biológicas del Noroeste, S.C., Unidad Guaymas. Apdo. Postal 349, Guaymas, Sonora, 85465, México
A. LEYVA-CONTRERAS
UNAM, Instituto de Geofísica. Circuito Exterior, Ciudad Universitaria. Coyoacán, 04510, México, D.F.
A.V. DOUGLAS
Creighton University, Department of Atmospheric Sciences, Omaha, Nebraska, 68178, USA
D. LLUCH-BELDA
CICIMAR, Av. Instituto Politécnico Nacional, S/ N. Colonia Palo Playa de Santa Rita, Apdo. postal 592, La Paz, B.C.S., 23096, México
(Manuscript received April 8, 2001; accepted in final form Sept. 21, 2001)
RESUMEN
En este trabajo se presentan resultados acerca de la variabilidad de los volúmenes mensuales de entrada a las presas (MIV), localizadas en los ríos de la vertiente continental del Golfo de California. Para los análisis se utilizaron series mensuales del índice de la Oscilación Decadal del Pacífico PDO (1900 a 1999), de lluvia (1921 a 1999) y de MIV (1939 a 1999). Aplicando el análisis de funciones empíricas ortogonales con rotación Varimax a las series MIV, se separaron las regiones "Norte" y "Sur", lo que estuvo en concordancia con las características climáticas dentro de la zona de estudio. En invierno, la variación de largo período de la lluvia permaneció en fase con el PDO durante todo el período analizado (1921-1999) en ambas regiones. En verano, esta relación resultó fuera de fase durante 1956-1974 y en fase durante 1987-1991. Los resultados revelan una relación estable en invierno entre las lluvias y las condiciones oceánicas, lo que concuerda con el carácter árido de la zona de estudio. En verano, los resultados implican una mayor influencia de factores climáticos, distintos a los locales, como son los sistemas convectivos de mesoescala, el Monzón mexicano y las tormentas del Pacífico tropical. La relación encontrada entre lluvias de invierno y PDO sugiere que durante la siguiente década los inviernos podrían continuar siendo secos y los MIV permanecer por debajo de lo normal.
Palabras clave: Sequía, variabilidad interanual, patrones de circulación, Oscilación Decadal del Pacífico, vertiente continental, Golfo de California.
ABSTRACT
In this work, several results are presented on the variability of monthly water inflow volumes (MIV) for the dams located on the rivers of the Gulf of California continental watershed. Monthly series of the Pacific Decadal Oscillation index PDO (1900 to 1999), rainfall (1921 to 1999), and MIV (1939 to 1999) were used for the analyses. Applying the Varimax Rotated Empirical Orthogonal Function analysis to MIV series, "Northern" and "Southern" regions were separated, being this result in agreement with the climatic characteristics of the study area. The rainfall-PDO relationship was found to be in-phase in winter for both regions during the entire analyzed period (1921-1999). In summer, the relationship was out-of-phase during 1956-1974 and in-phase in 1987-1991 for both regions. The results show a stable relationship in winter between the rainfall and the oceanic conditions, which agrees with the arid character of the study zone. In summer, the results imply a more remarkable influence of other than local factors of climate variability, like the mesoscale convective systems, the Mexican Monsoon and the Pacific tropical storms, the main sources of humidity in summer. The relationship between rainfall and PDO-index in winter suggests that during the next decade, in which the PDO seems to change to its cool phase, winters could continue to be dry and the inflow volumes for the dams could continue to be below normal.
Keywords: Drought, interannual variability, circulation patterns, Pacific Decadal Oscillation, continental watershed, Gulf of California.
1. Introduction
The Gulf of California continental watershed (GCCW) is limited by the summits of Sierra Madre Occidental, to the east, and by the sea of Cortez, to the west. This area is an extensive region that covers the states of Sonora, Sinaloa, northern Nayarit, western Chihuahua, Durango and northwestern Zacatecas (Fig. 1). In the GCCW, annual precipitation decreases from south to north and from east to west, even when, in a secondary way, precipitation increases with the elevation (Felger, 1993). Concerning the phenomena that generate cloudiness and precipitation over the GCCW, a variety of literature exist (Reyes and Mejía-Trejo, 1991; Douglas et al., 1993; García and Trejo, 1994; Reyes et al., 1994; Douglas and Englehart, 1995, 1996 and 1998a).
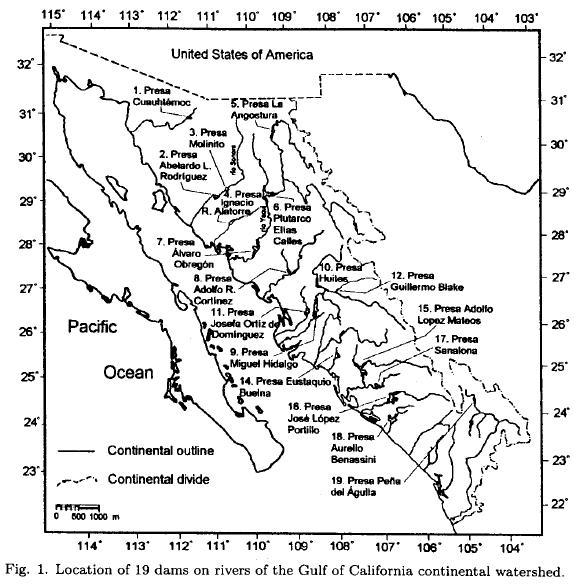
The first dam built in this area is La Angostura (5) (865 x 106 m3 storage) on Río Yaqui (Historia General de Sonora, 1985 p. 297), that was finished in 1942 (Table 1). In 1948, Abelardo L. Rodriguez dam (3) (564 x 106 m3 storage) was built on Río Sonora. The most recently constructed dam is Huites (10) (3 676 x 106 m3 storage), on Río Fuerte, that was finished in 1995. Thanks to the construction of the dams, the irrigable land in the valleys of the GCCW increased from 90,642 ha in 1929 to 1'285,000 ha at the end of the 1960s. 38% of the irrigative land in Mexico is concentrated in Sinaloa (21%) and Sonora (17%) (Cámara-Durán, 1994) coastal states considered among the most productive of the country.
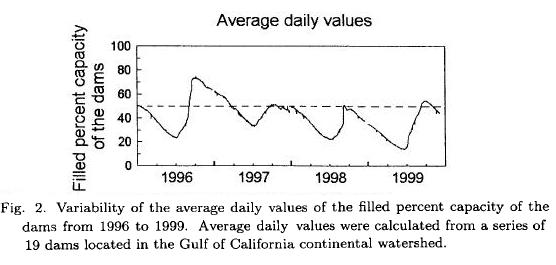
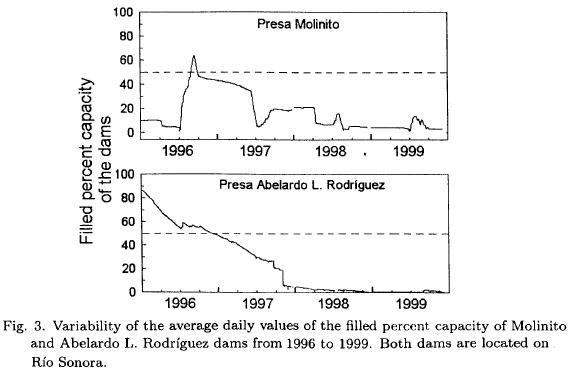
Toward the middle of 1999, 19 of the main dams located on the rivers of the GCCW (see Fig. 1) were in a situation that could be labeled catastrophic. On average, the filled percent capacity (FPC) of the dams was lower than 20% (Fig. 2) a deficit that reached historical proportions in the useful life of the reservoirs. Although from 1996 the FPC of the dams reached levels lower than 40% during the dry season (from November to June), the summer rains reduced the risk of maintaining the storage capacity of the reservoirs lower than 50%. The situation has been unfavorable since 1997, when the FPC of the dams was on average below 50%. The most affected dams were El Molinito (2) and Abelardo L. Rodríguez (3), both on Río Sonora, whose reservoirs began to empty since 1997 and were completely empty at the end of 1999 (Fig. 3).
Periods of record breaking precipitation deficiencies can last a month, a season, a year, or a number of years, and although some physical understanding has been achieved for droughts that last from a month to a season (Douglas and Englehart, 1998b), spells of years characterized by drought are poorly understood (Namias, 1978, 1980, 1983). The GCCW is particularly vulnerable to periods of water shortage, consequently, a better comprehension of the climate variability and its effect over the water volume variability for the dams results necessary. The goal of this study is to correlate the indices of the Pacific Decadal Oscillation and rainfall series and to analyze simultaneously the 700 mb atmospheric flow patterns, in summer and winter, in order to find some explanation of variability in the monthly inflow volumes for the dams of the study zone.
1.1. Pacific Decadal Oscillation
The Pacific Decadal Oscillation (PDO) is a long-term ocean fluctuation of the Pacific Ocean that was discovered for the first time in 1996 in records of sea-surface temperature for the Pacific Ocean (Mantua et al., 1997). The PDO has since been described as a long-lived El Niño-like pattern of Pacific climate variability (Zhang et al., 1997). The PDO waxes and wanes approximately every 20 to 30 years (Mantua et al., 1997). In the warm phase of the event, sea surface temperatures (SSTs) tend to be anomalously cool in the central North Pacific coincident with unusually warm SSTs along the west coast of the Americas. In the cool phase of the event cooler SSTs in the east and center of the Pacific are surrounded by warmer temperatures in the north, west and south that form a horseshoe shape (Mantua et al., 1997). Tracking PDO variations is typically done with indices constructed from observed Pacific SST and sea level pressure patterns (see, for example, Zhang et al., 1997 and Mantua et al., 1997). For example, the monthly values of the index of the PDO that can be obtained in http://tao.atmos.washington.edu/pdo/ are standardized values derived as the leading Principal Component of monthly SST anomalies in the North Pacific Ocean, poleward of 20N. The monthly mean global average SST anomalies are removed to separate this pattern of variability from any "global warming" signal that may be present in the data.
2. Materials and methods
For this study, the longest series of data (monthly rainfall totals in mm) between 1921 and 1999 were selected from climatologic stations distributed throughout the study area (Fig. 4). The consulted sources were: the climatologic database of CIBNOR, S.C., with monthly data in the period between 1921 and 1990, (Cesar Salinas-Zavala, personal communication); technical reports elaborated by Hastings (1964), Hastings and Humpherey (1969), and Schmidt (1978). The ERIC (1996) database was also consulted, elaborated by Instituto Mexicano de Tecnología del Agua (IMTA), México, with data from 1960 to. 1990. The update of rainfall series after 1990 to April of 1999 was a courtesy of Comisión Nacional del Agua (CNA), México.

The historical records (1938-1999) of average monthly inflow volumes for the dams (MIV, in 106 m3) for a total of 19 reservoirs located on the rivers of the GCCW (see Table 1 and Fig. 1) also were used in this study. This information was provided by the CNA. Rainfall totals and average MIV series were transformed to percent normal values, dividing each value of the series by their monthly average (MA), calculated by the common period of the series, 1950 to 1985 for the rainfall series and 1958 to 1999 for MIV series. The analysis was made for the summer, July to September, and for the winter, November to February, assigning the year to the resulting value of the last month. The three monthly summer season was defined in such a way because almost 70% of total annual rain fall in this period and it is coincident with the summer monsoon (Douglas et al., 1993). To add one month more (June or October) doesn't modify esentially the conclusions of the work, but could introduce an additional variability, related to the start or the end of the Mexican monsoon.
Regions were derived applying the Varimax Rotated Empirical Orthogonal Function (EOF) analysis to 19 series of average MIV for the dams in the period of 1958 to 1999. The rotated loading factors (ai) obtained were plotted on a map and isolines were produced from these values (Fig. 5). Regions were then produced using the a = 0.80 loading contours as boundaries. Series that remained fixed in the same factor for summer and winter were assigned to each region. This second approach, not of statistical but of climatological nature, was imposed to compare the results of the analysis in both seasons. Series that did not fulfill either approach (a ≥ 0.8, and fix in the same factor for each season) were labeled as "unclassified". The selection of a value of a = 0.80, as the limit among the borders of each region, might be arbitrary but allows to assign to each region only those series well correlated with a statistical significance higher than the 99.9% level (Manly, 1992). Finally, instead of considering the series of time calculated for each factor as the regional series, the series assigned to the corresponding factor were averaged. The resulting average series was considered as the regional monthly inflow volumes (RMIV) for the dams. Averaging the series in that way allowed for the study of all possible regional variability within the period of records while the series of time for each factor only showed the variability of the common period of the series and the rest of the information was ignored. The regional rainfall (RR) series was obtained averaging the rainfall series from climatologic stations located inside each region.

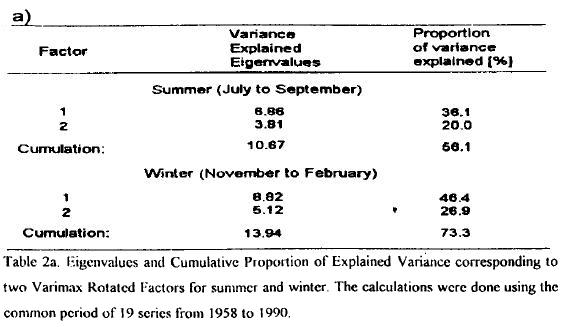
In this work, two factors for the summer and two factors for the winter were retained; the reason for this decision was that, the few number of samples (19) and the low quantity of values used in each sample (42), resulted in "effective degeneracy" (North et al., 1982) for more than two factors when the varimax rotated EOF analysis was applied. In this case, the sampling error in the second eigenvalue was comparable to the distance of the third eigenvalue, then the sampling errors in the second factor were comparable to the third factor (North et al., 1982). When this happened, mixing of the true eigenvalues occurred making the retention of more than two factors unjustifiable.
The historical RR and RMIV series and the indices of the PDO (for summer and winter averaging from monthly values in the same months as in rainfall) were smoothed using a 10-year Hamming window filter (Blackman and Tukey, 1958; Oppenheim and Schafer, 1989). The idea of filtering the series was to identify tendencies, of decades, as occurred in PDO.
The images of each seasonal composite map at 700 mb geopotential height and of sea surface temperatures (NCEP Reanalysis Model) were obtained from the program of the Climate Diagnostic Center of the NOAA-CIRES, Boulder, Colorado, at http://www.cdc.noaa.gov/Composites. Each map was graphed on a grid of 2.5 degrees latitude (between 15°N and 65°N) by 2.5 degrees longitude (between 60°W and 140°E).
3. Results
The varimax-rotated EOF analysis of the MIV series showed that the first two factors (F1 and F2) explained 56.2% of the variation in summer and 73.4% in winter (Table 2a). The space distribution of the loading coefficients (Table 2b) is shown in Fig. 5.

The F1 highest loading coefficients (ai ≥ 0.80) cover an area that extends along the western Sierra Madre, increasing in the NW-SE direction and covering the central and southeast parts of the study zone. Here, this area is called arbitrarily "Southern region", a mountainous area composed of coniferous and with abrupt slopes and precipitation higher than 800 mm/year, with an increment in the NW-SE direction. The MIV series associated with F1 were (see Table 2b and Fig. 5): Miguel Hidalgo(9), Huites(10), Gustavo Díaz Ordaz(13), Adolfo López Mateos(15), José López Portillo(16), Sanalona(17) and Peña del Águila(19).
The F2 highest loading coefficients (ai ≥ 0.80) cover a small area in the northwest part of the study zone, decreasing southeastward. In this area, called here "Northern region", compounded by two series in the basin of Río Sonora, the aridity is more intense than in the Southern region, being the predominant vegetation cactaceous plants, grazing and small thorny shrubs. In summer, maximum temperature of the air is higher than 40°C under shadow, precipitation rarely surpasses 400 mm/year, while annual evaporation is higher than 1200 mm. The MIV series associatted with F2 were The Molinito(2) and Abelardo L. Rodriguez(3).
The dams considered as "unclassified" were, in the north, Cuauhtémoc(1), Ignacio R. Alatorre(4), with less than 100 x 106 m3 storage capacity each and consequently more affected by local factors. The Angostura(5), Plutarco Elias Calles(6), and El Oviachic(7), are dams located along the main stream of the Río Yaqui and they are closed to belong to a specific cluster. Finally, in the south, Adolfo Ruíz Cortinez(8), Josefa Ortíz de Domínguez(11), Guillermo Blake Aguilar(12), Eustaquio Buelna(14), and Aurelio Benassini(18) are dams, each of them with specific characteristics in both storage capacity and operation.
3.1. Historical fluctuations in the Northern region
Data suggest that, since 1992, summer regional rainfall (RR) series in the Northern region began a period of low precipitation whose percent normal departures in 1998 were the lowest in 70 years of observations (Fig. 6). The corresponding departure in 1998 surpassed in magnitude the three previous dry periods. In the same way, regional monthly inflow volumes (RMIV) for the dams reached the lowest values on record, with negative percent normal departures of -50%, that surpassed the two previous dry periods. Negative percent departures in RMIV began one year after than in RR series. However, the last two decades of common data show a positive correlation among both variables. The period of 1982 to 1991 was extremely wet, surpassing two previous wet periods. Starting from the present, the discrepancies among both variables become more evident, and delays in the occurrence of wet and dry periods are observed (Fig. 6).
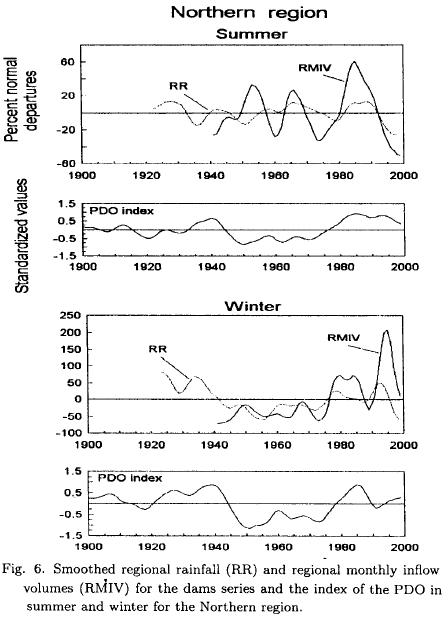
In winter, data suggest a delay from 1 to 2 years in the RMIV series relative to the RR series. Since 1996 winter RR series show negative percent departures that reached values of -60% in 1998, comparable with the negative percent departures of 1955, equal to -58%. The RR period of 1942 to 1975 was a period of negative percent departures while from 1976 to 1995, a RR period of positive percent departures was recorded, except for a short period between 1986 and 1989 in that near normal negative percent departures were observed. In a similar way, in RMIV series the winter period of 1941 to 1976 was a period of negative percent departures while the 1977 to 1999 was a period of positive percent departures, except for a short period between 1988 and 1990 in that near normal negative percent departures were also observed. The historical fluctuation of both variables shows a positive tendency (with values in increment) since the 1950s. Previous to this decade, the tendency in the rains was negative. The fluctuation of the index of the PDO (Zhang et al., 1997; Mantua et al., 1997) also shows these tendencies. The correlation between the index of the PDO and the winter RR series was statistically significant at the 95% level (r = 0.53) (Fig. 6).
3.2. Historical fluctuations in the Southern region
In the Southern region, although the correlation between RR and RMIV series was higher than correlation between these two variables in the Northern region, some delays between both variables were observed (Fig. 7).
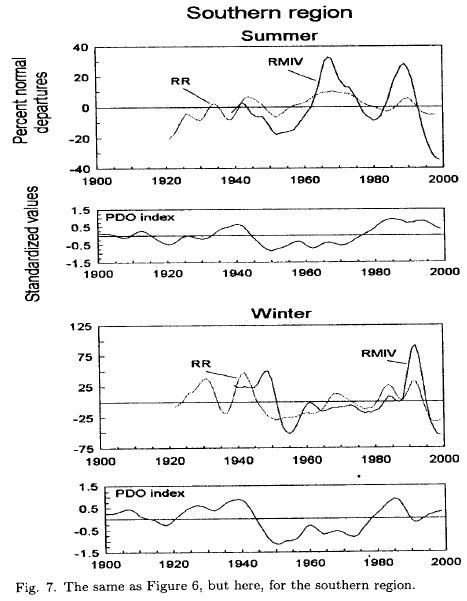
Since 1993, the summer RR series showed close to -5% negative percent departures. In the previous dry period, departures were smaller and in the precedent, around 1950, they had almost the same value. In the RMIV series, summer negative percent departures also began in 1993, but in this case the value they reached (-35%) was the lowest in 70 years of observation. Like in the rains, 1987 to 1992 was a period of positive percent departures in RMIV series. However, this period was not as wet nor prolongued as the extremely wet period of 1956 to 1979 in rains, and of 1963 to 1976 in RMIV series. The rains during this period showed departures of 10% while in the RMIV departures were > 30%.
In winter, the most recent negative percent departures began in 1996 in RR series, and in 1995 in RMIV series. In 1998 negative percent departures reached the lowest value in 70 years of observation in both variables. In rains, this value was -33% while in RMIV it was -53%. These departures were only comparable with those that occurred in 1951 (-29%) in rains, and in 1955 (-52%) in RMIV series. Since the 1950s, a positive tendency is observed in both variables until 1996, when an opposite tendency occurred. The correlation between the index of the PDO and the winter rains of the southern region was significant at the 95% level (r = 0.57).
4. Discussion
According to the previous section, 1992-1999 was a dry summer period in the Northern region, 1993-1999 was a dry summer period in the Southern region, and 1996-1999 was a dry winter period in both regions. In this section, we discuss the conditions of the atmospheric flow patterns, phenomena of scale greater than regional, leading up to drought during each of these periods and associated with moisture transport toward the both regions. The association between the winter and summer PDO indices and the dry periods is also discussed.
4.1. Dry and wet periods in summer rains
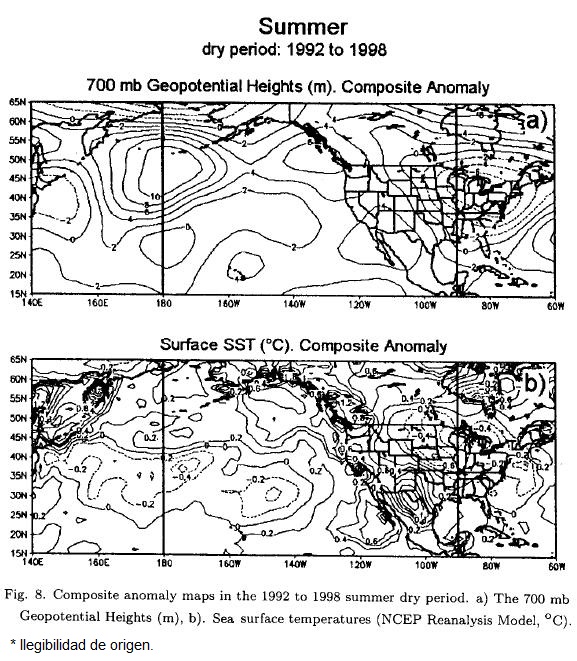
Causes of drought from 1992 to 1999 (Figs. 6 and 7), in the Northern and Southern regions, were associated with a recurrent pattern of anticyclonic atmospheric flow centered over the Gulf of California (Fig. 8a). The flow from the northwest blocked the entrance of moisture from the Atlantic and the Pacific (García and Trejo, 1994) causing below normal precipitations over the GCCW. The MIV for the dams were also affected by these conditions causing the low filled percent capacity of the dams during this period. Associations between episodes of El Niño conditions and dry summers are reported in literature (Reyes et al., 1994; Douglas y Englehart, 1998a). During the summer dry period of 1992 to 1998, episodes of El Niño conditions (in accordance with the classification of the Climate Prediction Center at http://www.cpc.ncep.noaa.gov/) were common (i.e. 1992, 1993, 1994, and 1997). Along the western coast of North America, positive departures of sea surface temperatures dominated, while in the subtropical, central Pacific waters remained cool (Fig. 8b). This thermal behavior of the ocean corresponded to an extended pattern of El Niño conditions with the warm phase of the PDO (Figs. 6 and 7). These conditions also might have contributed to the intensification of the 1992 to 1998 summer dry period since El Niño conditions in summer mean weak monsoons (Douglas and Englehart, 1998a).
Long-term summer fluctuation was out-of-phase between the index of the PDO and rainfall in 1956 to 1974 for the northern region, and in 1956 to 1976 for the southern region, and was in-phase in 1982 to 1991 and 1987 to 1992 for the northern and southern regions, respectively. Long-term anomaly summer fluctuation between rainfall and the index of the PDO in 1921 to 1999 resulted in near-zero correlation (r = 0.03) for the northern region and negative correlation (r = -0.35) for the southern region. Possible causes of these correlations could be related to the combined effect of variability of monsoons (Douglas et al., 1993), Mesoscale Convective Systems (Reyes, et al., 1994), and the penetration of tropical storms (Reyes and Mejía-Trejo, 1991), which are important sources of summer rainfall in the study area. Consequently, it results difficult to use just the knowledge of the PDO phases to suggest what kind of period, either below or more than normal will happen in summer. Moreover, summer rainfall variability could also be modulated by other factors in summer. For example, the study carried out by Douglas and Englehart (1998b), showed evidence that the stratrospheric Quasibiennial Oscillation (QBO) can modulate the summer rains in Mexico: during the East phase of the QBO drought dominates Mexico.
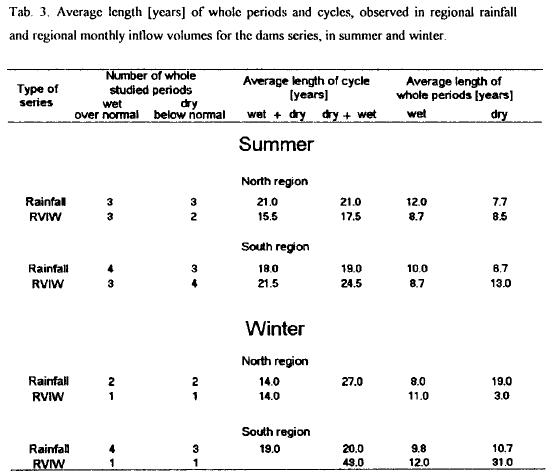
The long-term fluctuations of RR series show that dry periods have appeared with an approximate ratio of 1:1 in relation to wet periods (Table 3). However, the most recent dry period reached proportions of concern due to its magnitude. Although the RMIV series also show these periods, their characteristics are different in both magnitude and duration in relation to the rains. When analyzing the complete periods, summer RR series showed a 21-year cycle in the Northern region, and a 19-year cycle in the Southern region (Table 3) with wet and dry periods of 12 and 8 years, and of 10 and 7 years in the Northern and Southern regions, respectively. The duration of summer rainfall cycles is well coincident with the average duration of the double solar cycle (of ≈ 22 years) for the Northern region, and of the nodal tides cycle (of ≈ 19 years) for the Southern region. In the Northern region, the average duration of the cycles in the RMIV was 16 to 17 years while in the Southern region, the duration was 22 to 25 years, approximately. Several authors have analyzed the relationships between the solar activity and the fluctuations of the rains, particularly during extended dry periods (Padmanabhan and Rao, 1990; Mazzarella and Palumbo, 1992; Cook et al., 1997), however, the mechanisms involved in these relationships have not been completely established.
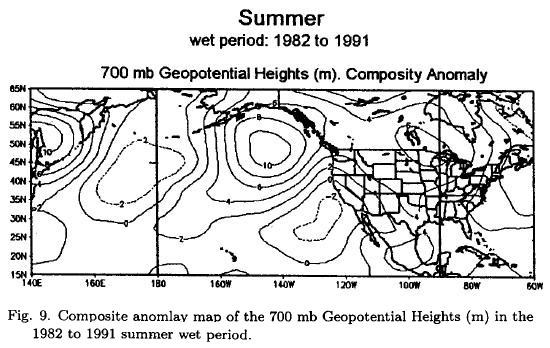
Wet conditions that occurred during the 1982 to 1991 summer wet period in the Northern region (Fig. 6), were favored by a recurrent atmospheric pattern of anomalous cyclonic flow over the southwest of the United States (Fig. 9). The subtropical high was displaced to the north, allowing the displacement of the tropical Pacific storms toward the Northern region producing the rains observed during this period. In the 1982 to 1991 summer wet period, episodes of La Niña conditions were common (i.e. in 1984, 1985, 1988 and 1989). The association in summer between a warm sea along the western North America (corresponding to the warm phase of the PDO) and La Niña conditions in the equatorial Pacific, favored the displacement northward of the tropical convective activity producing the rains over the Northern region (Higgins et al., 1998; Douglas and Englehart, 1998a).
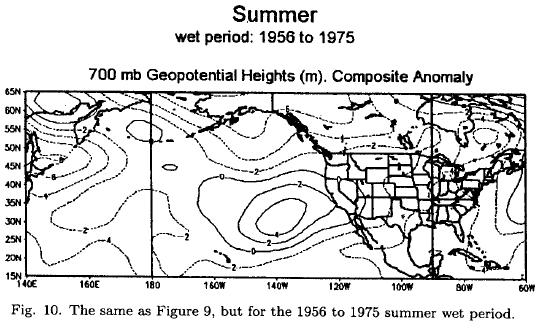
The 1956 to 1975 period was an extensive summer wet period observed in the Southern region (Fig. 7). During this period a recurrent atmospheric pattern of negative 700 mb geopotential heights anomalies prevailed over the entire Mexican territory, allowing the displacement of moisture from the Gulf of Mexico toward the Southern region (Fig. 10). The trough at southeast of Mexico resulted from the increment in the activity of the hurricanes.
4.2. Dry and wet periods in the winter rains
During the winter dry period of 1996 to 1999, observed in the Northern and Southern regions (Figs. 6 and 7), the composite map of 700 mb geopotential height anomalies (Fig. 11) identifies a wave-like pattern of mid tropospheric pressure anomalies over the North Pacific with anomalous anti-cyclonic systems along the subtropical North Pacific (below 30N) and northeastern Canada, and a cyclonic system in the Gulf of Alaska. The polar jet stream followed a meridional track and was displaced well to the north along the Pacific coasts of Canada and through the Alaska Peninsula. The deflection of the polar jet stream causes the displacement of extratropical storm-tracks to the north (Namias, 1983) causing below normal rainfall during the 1996 to 1999 winter period affecting both regions. The index of the PDO (Zhang et al., 1997; Mantua et al., 1997), in winter, for the 1921 to 1999 period explained 28% of the variance (r = 0.53, P > 95%) of the rains for the Northern region, and 32% of the variance (r = 0.57, P > 95%) of the rains for the Southern region. This means that the long-term rainfall fluctuations in both regions can be explained by the fluctuation of this index. With the warm phase of the PDO wet winter periods are common, while with the cool phase of the PDO winter periods are generally dry (Figs. 6 and 7). Changes in Pacific climate observed from late 1998 through February 2000 suggest that the post-1977 era of unusually warm coastal ocean sea surface temperatures may have ended (Hare and Mantua, 2000). This means that the PDO is entering its cold phase. Consequently, it is possible that after 1999 and in the next decade, the winters in the Northern and Southern regions of the study area will continue to be dry as a response to the change of phase of the PDO. Possible causes of the mechanisms involved could be related to changes in location of the cold and warm water masses over the north Pacific that alters the path of the jet stream. When the jet stream is steered further north over the Western United States, as it seems to occur during the cold phase of the PDO, the extratropical storms are displaced in the same direction leading to dry high-pressure conditions in the study area.

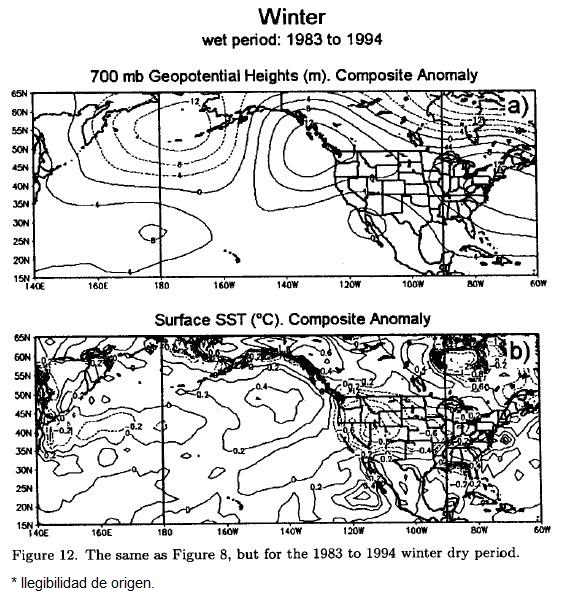
During the winter period of 1990 to 1995 in the Northern region (Fig. 6) and during the more extended period of 1983 to 1994 in the Southern region (Fig. 7), wet conditions prevailed. The average flow pattern of 1983 to 1994 shows the recurrence of anomalous High over the Gulf of Alaska and a cyclonic flow in the periphery between the southwest of the United States and the northwest of Mexico (Fig. 12a). This recurrent mid-tropospheric flow pattern allowed the path of cold fronts from the Pacific toward the northern and southern regions causing the increment of cloudiness and precipitation over both regions. A warm sea along the Pacific coasts (Fig. 12b) favored the increment of cloudiness.
During the extended wet period of winter for the Southern region episodes of El Niño years were common (i.e. 1987, 1988, 1991, 1992, 1993 and 1995). The El Niño years are related to an increment of winter precipitation over the northwest of Mexico (Cavazos and Hastenrath, 1990). Although the magnitude of precipitation during the 1983 to 1994 period for the Southern region, and the 1990 to 1995 period for the Northern region was not as high as that of previous wet periods (Figs. 6 and 7), winters like those of 1991 and 1992 were so rainy that floods in the rivers were observed and the full-filled of the reservoirs was common in several parts of Mexico (Reyes et al., 1994).
5. Conclusions
The 1990s, on the whole, were below normal rainfall years in the GCCW. In the summers of this decade, the drought began in 1992 in the Northern region and in 1993 in the Southern region of the study zone. In the winters, the drought began in 1996 for both regions. Long-term winter fluctuation in 1921 to 1999 was characterized by an in-phase relationship between rainfall and the PDO index for the Northern (r = 0.53, P > 95%) and Southern (r = 0.57, P > 95%) regions. Though the relationship between the PDO index and rainfall in winter is not perfect some indications do exist to suggest that the correlation between these two variables is real since the change in location of the cold and warm water masses over the North Pacific alters the path of the jet stream. When the jet stream is steered further north over the Western United States, as it seems to occur during the cold phase of the PDO, the extratropical storms are displaced in the same direction leading to dry high-pressure conditions in the study area. On the other hand, a warm sea along the eastern Pacific coasts, as occurred in the warm phase of the PDO, favored the increment of cloudiness and the path of the extratropical storm-tracks into the study area, leading to wet low-pressure conditions. Changes in Pacific climate observed from late 1998 through February 2000 suggest that the Pacific is entering its cold phase. Consequently, it is possible that in the next decade the winters in the Northern and Southern regions will continue to be dry.
Long-term summer fluctuation was out-of-phase between rainfall and the index of the PDO in 1956 to 1974 for the Northern region and 1956 to 1976 for the Southern region, and it was in-phase in 1982 to 1991 and 1987 to 1992 for the Northern and Southern regions, respectively. Long-term summer fluctuations of rainfall and PDO index in 1921 to 1999 resulted in practically zero correlation (r = 0.03) for the Northern region and negative correlation (r = -0.35) for the Southern region. Possible causes of these results could be related to the combined effect of monsoons, Mesoscale Convective Systems and tropical storms variability, which are the most important sources of summer rainfall in the study area, on one hand but, on the other hand, being an area located in an intrinsically (of planetary significance) arid zone. Because of that, it results unreliable to use just the knowledge on the PDO phases to infere what kind of period, either below or higher than normal humidity will happen in summer.
Acknowledgements
The first author thanks the financial support of Centro de Investigaciones Biológicas del Noroeste, S. C. (CIBNOR), of Consejo Nacional de Ciencia y Tecnología (CONACyT) and of Universidad Nacional Autónoma de México (UNAM) to carry out this work. Part of activities was supported by resources of the following grants: AYCG-15 and AYCG-13 of CIBNOR, 118761, 27964T and E130-1690/99 of CONACyT, and by means of an academic stay at Instituto de Geofísica UNAM in April-May 1999. Thanks to Comisión Nacional del Agua, México, for given relief to obtain the data of the dams and to anonymous reviewers and editorial staff for their comments and suggestions. The authors express special acknowledgement to Mrs. Thelma del Cid, technical editor, for her highly professional assistance.
REFERENCES
Blackman, R. B., and J. W. Tuckey, 1958. The measurement of power spectra: Dover, New York, 190 p. [ Links ]
Cámara-Durán, O. A., 1994. Impacto de la agricultura bajo riego sobre la calidad del agua: caso del Valle del Yaqui, Sonora. Ingeniería Hidráulica en México, 9(1): 57-71. [ Links ]
Cavazos, T. and S. Hastenrath, 1990. Convection and rainfall over Mexico and their modulation by the Southern Oscillation. Int. J. of Climatology, 10, 377-386. [ Links ]
Cook, E. R., D. M. Meko, and Ch. W. Stockton, 1997. A new assessment of possible solar and lunar forcing of the bidecadal drought rhythm in the western United States. J. of Climate, 10, 1343-1356. [ Links ]
Douglas, A. V., P. J. Englehart, 1995. Diagnostic studies of the mexican monsoon. Proceedings of the Nineteenth Annual Climate Diagnostics Workshop, pp. 202-206, Nov. de 1994. [ Links ]
Douglas, A. V., P. J. Englehart, 1996. An analysis of the starting date for the summer monsoon in western Mexico and southeast Arizona. Proceedings of the Nineteenth Annual Climate Diagnostics Workshop, pp. 207-211, Octubre de 1996. [ Links ]
Douglas, A. V., and P. J. Englehart, 1998a. Inter-monthly variability of the Mexican Summer Monsoon. Twenty-Second Annual Climate Diagnostics and Prediction Workshop. U.S. Department of Commerce, NOAA, 246-249. [ Links ]
Douglas, A. V., and P. J. Englehart, 1998b. The historic 1997-98 drought in Mexico. Proceedings of the Twenty-Third Annual Climate Diagnostics and Prediction Workwhop, October 26-30, 26-29 pp. [ Links ]
Douglas, M. W., R. A. Maddox, K. Howard, and S. Reyes, 1993. The Mexican Monsoon. J. of Climate, 6, 1665-1677. [ Links ]
ERIC, 1996. Extractor Rápido de Información Climatológica. Instituto Mexicano de Tecnología del Agua, CD y manual de usuario. Colección proyectos IMTA. Serie programas. Primera Edición, México, ISBN 968-7417-11-0. [ Links ]
Felger, R. S., 1993. Investigación ecológica en Sonora y localidades adyacentes en Sinaloa: una perspectiva. Noroeste de Sonora 12, INAH, Hermosillo, Sonora, 244 p. [ Links ]
García, E. y R. I. Trejo, 1994. La presencia del monzón en el noroeste de México. Investigaciones geográficas. Boletín del Instituto de Geografía. No 28, 33-64 pp. [ Links ]
Hare, S. R. and N. J. Mantua, 2000. Empirical evidence for North Pacific regime shifts in 1977 and 1989. Progress in Oceanography, 47, 103-145. [ Links ]
Hastings, R. J., 1964. Climatological Data for Sonora and Northern Sinaloa. Technical Reports on the Meteorology and Climatology of Arid Regions, No 15. James Rodney H. (ed.). The University of Arizona, Institute of Atmospheric Physics, 152 pp. [ Links ]
Hastings, R. J. and R. R. Humpherey, 1969. Climatological Data for Sonora and Northern Sinaloa. Technical Reports on the Meteorology and Climatology of Arid Regions, No 19. James Rodney H. And Robert R. Humpherey (eds). The University of Arizona, Institute of Atmospheric Physics, 96 pp. [ Links ]
Higgins, R. W., Y. Chen, K. C. Mo, and A. V. Douglas, 1998. Influence of the North American Monsoon System on the Summer Precipitation Regime. Proceedings of the Twenty-Third Annual Climate Diagnostics and Prediction Workshop, NOAA, Miami, Florida, 101-104. [ Links ]
Historia General de Sonora, 1985. Historia contemporánea de Sonora (1929-1984). Gobierno del Estado de Sonora, Vol. V, Hermosillo, 387 p. [ Links ]
Manly, B. F. J., 1992. Multivariate Statistical Methods. A primer. Chapman & Hall, 158 p. [ Links ]
Mantua, N. J., S. R. Hare, Y. Zhang, J. M. Wallace, and R. C. Francis, 1997. A Pacific Interdecadal Climate Oscillation with impacts on Salmon Production. Bulletin of the American Meteorological Society, 78(6): 1069-1079. [ Links ]
Mazarella, A. and A. Palumbo, 1992. Rainfall fluctuations over Italy and their association with solar activity. Theoretical and Applied Climatology, 45, 201-207. [ Links ]
Namias, J., 1983. Some causes of United States drought. J. of Climate and Applied Meteorology, 22, 30-39 pp. [ Links ]
Namias, J., 1980. Severe drought and recent history. J. of Interdisciplinary History, x:4 (spring), 697-712. [ Links ]
Namias, J., 1978. Recent drought in California and western Europe. Reviews of Geophysics and Space Physics, 16(3): 435-458. [ Links ]
North, G. R., T. L. Bell, and R. F. Cahalan, 1982. Sampling errors in the estimation of empirical orthogonal functions. Monthly Weather Review, 110, 699-706. [ Links ]
Oppenheim, A. V. and R. W. Schafer, 1989. Discrete-Time Signal Procesing. Englewood cliffs, NJ: Prentice-Hall. [ Links ]
Padmanabhan, G. and A. R. Rao, 1990. On the crosscorrelation between drought indices and solar activity. Theoretical and Applied Climatology, 41, 55-61. [ Links ]
Reyes, S., M. W. Douglas y R. A. Maddox, 1994. El monzón del suroeste de Norteamérica (TRAVASON/SWAMP), Atmósfera, 7, 117-137. [ Links ]
Reyes, S., A. Mejía-Trejo, 1991. Tropical perturbations in the eastern Pacific and the precipitation field over north-western Mexico in relation to the ENSO phenomenon. Int. J. of Climatology, 11, 515-528. [ Links ]
Schmidt, R. H., 1978. Climatological data for the state of Sinaloa, Mexico. Climatology Series, No. 1, Arizona, Office of the State Climatologist, Laboratory of Climatology, Arizona State University, 160 p. [ Links ]
Zhang, Y., J. M. Wallace, D. S. Battisti, 1997. ENSO-like interdecadal variability: 1900-93. J. of Climate, 10, 1004-1020. [ Links ]

