


Services on Demand
Journal

Article
 English (pdf)
 Article in xml format
 Article references
 Send this article by e-mail
Indicators
 Cited by SciELO
 Related links
 Similars in
SciELO
Similars in
SciELO Share

 Permalink
Atmósfera
Print version ISSN 0187-6236
Atmósfera vol.15 n.1 Ciudad de México Jan. 2002
Some aspects of the convective boundary layer over the Bay of Bengal
SAVITA B. MORWAL
Indian Institute of Tropical Meteorology, Dr. Homi Bhabha Road, Pashan, Pune 411 008, India
(Manuscript received August 18, 2000; accepted in final form June 11, 2001)
RESUMEN
Se ha llevado a cabo un estudio para investigar las características termodinámicas de La Capa Límite (CBL) sobre la región de La Bahía de Bengala. Con tal fin han sido consideradas unas observaciones aerológicas colectadas del Monzón 77 empleando las naves de investigación de la, en otro tiempo, Unión de Repúblicas Socialistas Soviéticas (USSR) (es decir, Shirshov, Priboy, Shokalsky y Okean) en la región 15-19°N, 87-91°E durante 11 a 18 de agosto de 1977 y BOBMEX-98 a bordo de Sagar Kanya en 13°N, 87°E. Los resultados del análisis de cuatro barcos mostraron que no se encuentran diferencias marcadas en las características de la Capa Límite Convectiva durante el periodo en cuestión. Perfiles verticales seis horarios de los parámetros termodinámicos mostraron una evolución de la estructura de La Capa Límite Convectiva (CBL) durante el día en todos los sitios, la cima de la CBL se encuentra entre los 700-580 hPa y varía con el tiempo cronológico. Los valores seis horarios de tos parámetros meteorológicos, a saber: p, T y Td mostraron variaciones. Es evidente también que los parámetros meteorológicos en superficie, así como la estructura de la CBL sobre la región mencionada arriba está influenciada por las condiciones meteorológicas predominantes y las perturbaciones asociadas con las perturbaciones a escala sinóptica transitorias.
Palabras clave: Capa Límite Convectiva, Capa Límite Marina, Capa Límite durante la estación veraniega del Monzón, estructura termodinámica vertical, Bahía de Bengala.
ABSTRACT
A study has been carried out to investigate the thermodynamic characteristics of the Convective Boundary Layer (CBL) over the Bay of Bengal region. For this purpose aerological observations collected from MONSOON-77 utilizing the erstwhile USSR research vessels (i. e. Shirshov, Priboy, Shokalsky and Okean) in the region 15-19°N, 87-91°E during 11-18 August 1977 and BOBMEX-98 onboard Sagar Kanya at 13°N 87°E have been considered. The results of the analysis showed that no marked differences are found in the Convective Boundary Layer characteristics over the four ships during the period under consideration. 6-hourly vertical profiles of the thermodynamical parameters showed the evolution of the CBL structure during daytime at all the locations. The top of the CBL is found between 700-580 hPa and it varied with time. The daily 6-hourly values of surface meteorological parameters viz, p, T and Td showed diurnal variation. Also, it is evident that the surface meteorological parameters as well as structure of the CBL over the region mentioned above is influenced by the prevailing weather conditions and associated synoptic/transient scale disturbances.
Key words: Convective Boundary Layer, Marine Boundary Layer, Boundary Layer during the summer monsoon season, Vertical thermodynamic structure of the Boundary Layer, Bay of Bengal.
1. Introduction
The Convective Boundary Layer (CBL) over the oceans plays an important role in regulating the transport of energy and moisture upward into the atmosphere from the lower layers of the oceans. The transfer of energy and moisture subsequently depends upon the prevailing weather conditions and the associated disturbances such as lows/depressions/cyclones, etc. Over the Bay of Bengal region, many monsoon lows/depressions/cyclones are formed during the summer season and they move westwards toward India (Dube et al., 1997). For the better understanding of monsoon activity in association with the CBL thermodynamic structure over the oceanic regions, a deep investigation of the processes influencing the vertical structure of the CBL is needed.
In order to study the vertical mixing processes, in a very simplified manner, conserved variable method was developed by Alan K. Betts in series of papers (Betts, 1982a, b; 1983; 1985; 1986). He showed how convective structure and mixing processes could be simplified using Saturation Point (SP) approach during the summer monsoon season. Using these approaches CBL structure was studied over the Pacific Oceanic regions by many workers (Kloesel and Albrecht, 1989; Betts and Albrecht, 1987). Parasnis and Morwal (1991), Morwal (1998; 2000) used the same approaches to investigate the CBL structure over the Indian land/oceanic regions. The aim of this paper is to explore the vertical structure of the Convective Boundary Layer over the Bay of Bengal region using the approaches of Saturation Point and conserved variable diagrams during the summer monsoon season.
2. Location of observations and meteorological conditions
Aerological observations collected during Phase III of Monsoon-77 experiment by erstwhile USSR research vessels during the period 11 - 18 August 1977 over the northern Bay of Bengal have been considered for the present study. This includes upper air data form Radiosonde/RAWIN observations directly teleprinted to International MONEX Management Centre (IMMC), New Delhi and also processed by ADGM(R) Office of India Meteorological Department, Pune. Four ships viz Shirshov (17.2°N, 91°E), Priboy (19.3°N, 89°E), Shokalsky (17.3°N, 87°E) and Okean (15.2°N, 89°E) formed a polygon and were stationary during the period 11 - 18 August 1997 (Fig. 1). The four corners of the polygon in the anticlockwise direction from east are designated as E (Shirshov), N (Priboy), W (Shokalsky) and S (Okean) in the following sections.

In order to make comparison with the latest data, which is made available from Pilot BOBMEX-98 (Bay of Bengal Monsoon Experiment - 1998), radiosonde observations on 5 November 1998 at 00 and 12 UTC at 13°N, 87°E have been considered. The data source is the Department of Science and Technology, New Delhi, India.
Six-hourly (00, 06, 12 and 18 UTC) high resolution radiosonde observations from surface up to 500 hPa at an interval of 25-30 hPa, collected over each ship, have been used in this study. Each 6-hourly aerological observation was subjected to simple linear interpolation in order to compute T and Td (temperature and dew point temperature) at every 10 hPa interval. These interpolated values have been used to compute 6-hourly averaged vertical profiles of T and Td during the period 11-18 August 1977 for each ship, from surface up to 500 hPa level. Using average values of T and Td thermodynamic parameters such as mixing ratio (q, gm kg-1), potential temperature (θ, K), virtual potential temperature (θv , K) equivalent potential temperature (θe , K) saturated equivalent potential temperature (θes , K), saturation level pressure (pSL, hPa) and saturation pressure deficit (P*, hPa) have been computed.
The surface pressure charts over the observational region for 11, 14 16 and 18th August at 0300 UTC are shown in Figure 2. As far as the meteorological conditions are concerned the following features were observed: (1) To the west of the observational area on 11th August 1977 the North-south trough on the sea level chart was close to Andhra-Tamil Nadu coast and extended up to 1.5 km on 12th August 1977. (2) Northwest of the position of the ships, a low pressure area developed on 14th August 1977 over north Orissa and neighborhood. However, it became less marked on 15th August 1977. (3) The axis of the seasonal monsoon trough is shifted to the foot of the Himalayas causing break condition in the monsoon. (4) A north-south trough along the east coast of India formed on 15th August and lasted till the end of the period of observation. (5) North of the site of observation, the upper air trough over the West Bengal persisted throughout the period of observation. (6) An incipient low appeared on 18th August intensified into a depression over the northern Bay of Bengal centered at 0300 UTC on 19th within half degree of 19°N and 91°E. It further intensified into deep depression and crossed the Orissa coast.

3. Method of analysis
Saturation Point (SP) concept was introduced by Alan K. Betts in one of his papers during 1982. When an air parcel is lifted dry adiabatically along constant mixing ratio line so that it reaches saturation, then that level is known as saturation level. A point on this level is specified by parameters such as θSL, qSL and pSL and it is termed as saturation point. Since the environment considered in the present study is unsaturated, SP means the Lifting Condensation Level (LCL) for all practical purposes. SP is unchanged during dry/moist adiabatic ascent or descent. However under the influence of some physical processes there is possibility of change of SP. These processes are radiative cooling/warming and precipitation/evaporation of falling rain. A parameter called saturation pressure deficit is defined as

Here, p is the air parcel pressure. P* represents the lack of saturation in the layer p to pSL. P* is positive in the cloudy region and negative in the unsaturated region. Also, it is a very useful parameter to differentiate the different sub-layers in the CBL (Betts, 1982).
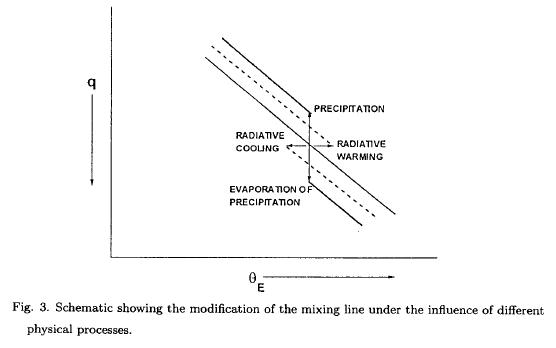
Conserved variable diagrams are very useful to understand the influence of convective mixing and different physical processes on the CBL structure. Both the axis, viz. θe on X axis and q on Y axis, are represented by conserved variables. The mixing lines are straight lines on these diagrams (Fig. 3). The CBL which is dominated by convective mixing processes is represented by a single mixing line (thin solid line). Under the influence of physical processes like radiative cooling/warming (dashed line) or precipitation/evaporation of the falling precipitation (thick solid line) it changes as shown in Figure 3. These diagrams are used extensively by many workers (Betts and Albrecht, 1987; Parasnis and Morwal, 1991, 1993a, 1993b, Parasnis et al., 1991).
4. CBL structure over different ships
In order to explore the CBL structure, for the four ships i.e. Shirshov (E), Priboy (N), Shokalsky (W) and Okean (S) situated in the observational region (15 - 19°N, 87 - 91°E), a detailed study is carried out for each individual ship in the following subsections. Betts and Albrecht (1987), while studying the CBL structure over the Pacific Oceanic region, observed that the CBL top is associated with minimum values of θe and P* and maximum of θes. However, all the soundings used by them were associated with the inversion soundings. Also, P* was found to be more or less constant in the cloud layer. While investigating the CBL structure over the Deccan plateau region, Pune, India, Parasnis and Morwal (1991) noticed that the sub-cloud layer nearly follows a constant θv profile. In the present paper the above criteria have been used to examine the CBL structure over the Bay of Bengal region during the summer monsoon season of 1977 and northeast monsoon season of 1998.
Research vessel Shirshov (17.2° N, 91° E), E location
Figure 4a shows 6-hourly (00 and 06 UTC) average (each contains 6 soundings) vertical profiles of q, θv, θe, θes and P* from surface up to 500 hPa at an interval of 10 hPa at the E location. During all four hours (00, 06, 12 and 18 UTC) the sub cloud layers extended from 1000 to 930 hPa (given in Table 1) and gradient of θV is very small (< 1 K per 100 hPa). P* increases in this layer and thereafter it becomes more or less constant in the cloud layer. The cloud layer is observed at the top of the sub cloud layer and extended between 800 - 750 hPa. In the cloud layer the average value of P* during the 00, 06, 12 and 18 UTC hours is -33, -39, -31 and -29 hPa which is associated with 85%, 83%, 86% and 87% relative humidity. Above the cloud layer P* either shows steady decrease or sharp decrease. The CBL top is associated with minimum value of P* and θe. It is found to be at 690, 670, 630 and 720 hPa during the 00, 06, 12 and 18 UTC hours respectively. Thus CBL is observed to be reaching up to higher levels (670 and 630 hPa) during daytime hours as compared to morning and night hours. The θe profiles showed convectively neutral buoyancy in the stable layers that were observed above the cloud layer and below the CBL top. Maximum values of θes are not observed at CBL top as observed by Betts and Albrecht (1987). This may be due to the fact that none of the soundings is associated with an inversion.

Research vessel Priboy (19.3° N, 89° E), N location
Over this ship there were in all 31 soundings available during the period 11-18 August 1997 at 6-hour interval. The 6-hourly (only 00 and 06 UTC) average profiles of q, θv, θe, θes and P* are shown in Figure 4b from surface up to 500 hPa. The sub cloud layer, which extends from the surface to 930, 920, 900 and 930 hPa at 00, 06 and 12 and 18 UTC hours respectively (shown in Table 1), has approximately constant value of θv and is marked by characteristic gradients of q, θe and θes. The depth of the cloud layers are 930 - 850, 920 - 790 and 900 - 750 hPa at 00, 06 and 12 UTC hours whereas the cloud layer is very thin at 18 UTC hours (930 - 900 hPa). The CBL top is at 760, 700, 630 and 830 hPa which coincides with minimum value of P* and θe. The cloud layers are associated with nearly 84% relative humidity.
Research vessel Shokalsky (17.3° N, 87° E), W location
Overall 28 radiosonde ascents were available over this ship. The 6-hourly (only 00, and 06 UTC) average profiles of q, θv, θe, θes and P* are shown in Figure 4c. During all the four hours (00, 06, 12 and 18 UTC) the sub cloud layer (surface to 920 hPa), cloud layer (920 to 800 - 710 hPa) and the overlying capping stable layer can be easily distinguished by different gradients of P*, θv and θe. The P* shows gradual increasing trend while θe and θes show gradual decrease in the sub cloud layer. The θe is a measure of the moist convective instability of the layer. The θe profiles showed that the moist convective instability is more marked in the lower layers as compared to layers above. Secondly it is more accented during daytime as compared to morning and night hours. The extent of the cloud layer is 920 - 770, 920 - 710, 940 - 750 and 920 - 800 hPa during the 00, 06, 12 and 18 UTC hours respectively (shown in Table 1). This shows that during daytime the cloud layer deepens. The cloud layers are associated with 84% relative humidity values. The CBL top is coincident with minimum values of θe and P* and found to be at 650, 650, 580 and 620 hPa respectively during 00, 06, 12 and 18 UTC hours.
Research vessel Okean (15.2° N, 89° E), S location
All 32 sounding observations were undertaken at an interval of 6 hour over this ship during the period 11 - 18 August 1977. 6-hourly average profiles of q, θv, θe, θes and P* for 00 and 06 UTC are shown in Figure 4d. The extent of the sub cloud layer, which starts at the surface and varies between 940 and 910 hPa, is marked by decreasing trends of q, θe, θes and sharp increasing trends of P* at all four hours. The mean sub cloud layer θV is 305.1, 304.4, 304.6 and 305.5 K at 00, 06, 12 and 18 UTC hours, respectively. Cloud layer tops the sub cloud layer and its depth at 00, 06, 12 and 18 UTC hours is 940 - 820, 920 - 730, 920 - 860 and 910 - 810 hPa, respectively. These cloud layers are associated with nearly constant values of P* (-37, -31, -45 and -37 hPa). The relative humidity in the cloud layers is nearly 84%, 86%, 81% and 84%. This layer is topped by a slightly more stable layer (750 - 650 hPa) with decreasing P* and nearly flat profiles of θe and θes. The CBL top is at 780, 650, 680 and 750 hPa at 00, 06, 12 and 18 UTC hours respectively (listed in Table 1). Thus CBL is slightly dry at 12 UTC hours as compared to those at remaining three hours as the cloud layer at 12 UTC is shallow with low relative humidity and continuously decreasing trend of P* above the cloud layer.
Thus the CBL structure over the four ships viz. Shirshov, Priboy, Shokalsky and Okean in the northern Bay of Bengal region studied using the 6-hourly averaged thermodynamical parameters show more or less similar characteristics over all the ships located at E, N, W, and S locations. This may be due to the fact that thermodynamical parameters at all locations are influenced by some or the other synoptic scale disturbances that were observed to the north, northeast and west of the position of the ships. However, CBL structure showed temporal variations over all the locations. From 6-hourly averaged values of θv it is seen that sub cloud layer varies from 900 - 940 hPa over the four locations. The depth of the cloud layer is less during morning (00 UTC) and night (18 UTC) hours as compared to daytime. The 6-hourly average values of relative humidity in the cloud layer over the four ships range from 81 to 87% as can be seen from the total cloud amount present over the observational area (Fig. 2). Rao et al. (1985) observed that the surface layer of Bay of Bengal is more saturated than that of Arabian Sea during MONSOON-77 experiment, which is in support of high relative humidity observed over this region. Evolution of the CBL observed during daytime hours is evident from average vertical profiles of q, θv, θe, θes and P* at 00, 06, 12 and 18 UTC at all the four locations. The CBL top ranges from 700 to 600 hPa and showed temporal variation. Over all the ships, CBL extends to higher levels during daytime hours. Sen and Das (1986) from MONEX-79 data noticed that the inversion layers were either diffused or lifted and weakened considerably in the region of strong upward motion during the summer monsoon season. In this study also similar type of inversion layers (weak stable layers) are observed. In case of all the ships a flat maxima of θes is observed at the top of the CBL as the soundings considered in the present analysis belong to deep convection soundings depending on the classification proposed by Kloesel and Albrecht (1989).
5. Conserved variable diagrams (θe - q)
The 6-hourly conserved variable diagrams (θe - q) for the ships located at E, N, W and S are shown in Figure 5. Some of the pressure levels (indicating the extent of different sub-layers in the CBL) are marked in these diagrams. The scale of q axis is reversed, so that it resembles the vertical distribution of q in the environment (in the environment q decreases with height). These lines represent the mixing lines from surface up to the top of the CBL for all the ships. According to Betts and Albrecht (1987) a mixing line structure is produced when vertical convective mixing processes dominate over the processes that do not conserve air parcel saturation point, such as radiative cooling or the process of precipitation.
The mixing line is represented by a single missing line over all the locations and by all the 6-hourly average θe- q profiles. No q reversal is observed at the top of the CBL as observed over the Pacific Oceanic region by Betts and Albrecht (1987) and over the Arabian Sea by Parasnis and Morwal (1993a). The CBL top for the four ships at 6-hourly interval is given in Table 1. The capping stable layer is slightly stronger in case of Shirshov and it is comparatively weak for the other three ships. The air above the CBL top cools and sinks for a longer time before entering the CBL. Thus it attains θe minimum at the CBL top. However, in the present study a flat θe minimum is observed and it is not so pronounced as observed over the Pacific Oceanic region (Betts and Albrecht, 1987) and Arabian Sea region (Parasnis and Morwal, 1993a). This may be attributed to the prevailing weather conditions and synoptic scale disturbances during the period of study.
6. Daily variation in the surface parameters
Figure 6 shows daily march (temporal variation) of the surface parameters viz, pressure (p). Lifting Condensation Level (LCL or pSL), equivalent potential temperature (θe) and total cloud amount for the locations E (solid line), N (dashed line), W (solid line with filled circle) and S (solid line with hollow circle) respectively for the period 11-18 August 1977. The total cloud amount is taken from Indian Daily Weather Reports published by India Meteorological Department, India.

From this Figure it is evident that the parameters p and LCL (pSL) show diurnal variation over all the locations. The surface pressure decreases up to 12 UTC of 13th August and then it increases up to 18 UTC of 14th August. The most prominent feature in the surface pressure pattern is marked fall from 14th onwards at all the locations. This feature may be attributed to the intensification of the north-south trough along the east coast of India as mentioned above in Section 2. Lowest values of surface pressure are observed on 18th August. Among the four locations minimum values of surface pressure are recorded at E and N locations and the highest values at the S location. The LCL heights or pSL increase with the fall in pressure. However, LCL height also depends on the T and Td. When dew point depression is less than some critical valued (< 2.5K) the LCL height decreases in spite of the fall in pressure. The mean LCL height over this region is observed to be 960 hPa which is high as compared to 980 hPa observed over the Pacific Oceanic region (Betts and Albrecht, 1987) and Arabian Sea region (Parasnis and Morwal, 1993a). After 06 hours of 18th August, surface values of pressure, T and Td (not plotted) show marked decrease at all the locations except at W location. An opposite trend is shown by LCL heights. This sudden change may possibly be attributed to the formation of depression in the northern Bay of Bengal, which is in the stage of further development. The ship at the W location lies to the SW of the area of the depression and hence least affected by its presence.
The surface wind speeds in general show a steady increasing trend in their magnitudes at all the four locations and a decrease after 12 UTC hours of 17th (not shown in Fig. 6). Similarly most of the time surface winds are southwesterly and show a very little change in direction. At the N and E locations, after 17th August, surface wind speed decreases and an abrupt change in wind direction is observed. This may be attributed to the progressive movement and development of the depression, which is moving northwestwards and lies very close to the E and N location. The surface values of equivalent potential temperature (θe) show in general a steady increasing trend at all the locations. The moist convective instability increases in the surface layer. However, convective instability decreases after 12 UTC hours of 17th at N and E locations. This may be corroborated with the depression in the northern Bay of Bengal. The total cloud amount is 5-8 oktas over all the locations. Low values are observed at the middle of the observational period. This may be due to the westward movement of the low pressure area associated with high cloudiness on 12th and 13th August and clear skies after the passage of low pressure system. At the end of the phase III total cloud amount again increases which could be due to the genesis of the monsoon depression in the northern Bay of Bengal.
7. Zonal and meridional winds
Average profiles of the zonal (U, m sec-1) and meridional (V, m sec-1) wind components are shown by solid lines and dashed lines respectively in Figure 7. In the average zonal profiles over the different ships, the wind maxima are located in the layer 950 - 900 hPa. From these profiles it is clearly evident that the region was dominated by the westerly flow. The westerly wind increases from the surface upwards, attains a maximum in the layer 950 - 900 hPa and then weakens with height. Shirshov and Shokalsky were situated along the latitude 17°N and for both the ships it is found that the zonal wind maximum is located in the cloud layer. However, in case of Priboy and Okean, it is seen that the wind maximum coincided with the top of the mixed layer.

From the average profiles of meridional wind, it is noticed that wind is southerly up to 650 hPa (i. e. CBL top) and then it slowly weakens with height in the layer 650 - 600 hPa and then becomes northerly. Thus, the flow is southwesterly in the CBL i.e. up to 650 hPa and then it tends to change to northeasterly in the higher levels.
8. Vertical velocity profiles
In order to compute the vertical velocity, the observational area (15-19°N, 87-91°E) has been divided into four triangles viz. Eastern (east of 89°E), western (west of 89°E), northern (north of 17°N) and southern (south of 17°N). The average values of vertical velocity were computed at the centroid of these four triangles (Ryan et al., 1989). Average profiles of vertical velocity are shown in Figure 8 for the eastern (centered symbol star), western (centered symbol triangle), northern (centered symbol square) and southern (centered symbol circle) regions. It is clearly seen that there was evidence of ascent in the western, eastern and northern regions from surface up to 500 hPa and its magnitude is maximum in the western region and minimum in the northern region. This is in support of the prevailing weather conditions and the associated disturbances thereof. However, descending motion was noticed over the southern region from surface up to 550 hPa and ascent thereafter. The strength of descending motions in the southern region is found to be less as compared to strength of ascents in the remaining three regions. In general, the area of observation is dominated by the strong ascending motions and is thus consistent with the prevailing weather conditions.

9. CBL structure during BOBMEX-98 pilot experiment
During the Pilot BOMBMEX-98 experiment, aerological observations have been collected at 00 and 12 UTC onboard Sagar Kanya in the Bay of Bengal (7.0-13°N, 85-87°E) during 30 October to 7 November 1998. Thus in this experiment the observational area is southwest of that of the MONSOON-77 observational area (15-19°N, 87-91°E). Therefore, the day on which the ship was in the extreme northeast location i.e. 5th November has been considered for comparative study. Two radiosonde ascents at 00 and 12 UTC hours are available on this day. The associated weather conditions at the time of these ascents are characterized by the fair weather clouds (00 UTC) and bad weather conditions (12 UTC). Thus they are representative of the contrasting weather conditions and are influenced by the transient disturbances. The CBL features on 5th November at 00 and 12 UTC are shown in Figure 9. This figure shows the vertical profiles of q, θv, θe, θes and P* and conserved variable diagrams (θe--q) at 00 and 12 UTC.

At 00 UTC hours the surface layer is characterized by sharp decrease of q, θv, θe, θes and P*. The LCL is found to be at 962 hPa which is similar to the mean LCL height obtained during the MONSOON-77 experiment over Bay of Bengal region. As in this case CBL is representative of the fair weather conditions the LCL is at higher level as surface layer is dry as compared to that of 12 UTC. The sub cloud layer (980-930 hPa) is associated with constant values of θv. In the cloud layer (930-850 hPa) average values of P* and RH are -24.6 hPa and 89.5% respectively. The CBL top is taken at 750 hPa where P* minima occurred. The θe minimum is not found at CBL top (750 hPa) but at 670 hPa. It is also seen that the mean sub cloud θe of 351 K exceeds the θes maximum at 700 hPa of 347 K. This was also noticed in BOMEX observations (22-24 June, 1969) where θe minimum was observed 150 hPa above the top of the CBL (Betts and Albrecht, 1987) and over the Deccan Plateau region, Pune, India in the isolated rainfall category (Parasnis and Morwal, 1991) where θe minimum was observed 50 hPa above the CBL top. Thus it is observed that the CBL characteristics are very much similar to that observed during the night hours at the E, N and S locations but the CBLs are more moist as compared to those at E, N and S locations. The mixing line on the θe - q diagrams is characteristic of single mixing line from surface to the top of the CBL as observed during the MONSOON-77 experiment.
The profiles at 12 UTC are representative of the disturbed weather conditions. The surface layer is characterized by a sharp increase of q, θV, θe, θes and P*. This indicates that air in the surface layer is warm, moist and very stable. The LCL height is found at 950 hPa. The moist convective instability increases in the lower part of the cloud layer (960-750 hPa). The cloud layer is specified by nearly constant values of P* (-4.6 hPa), And RH (97.8%) which reflect rather moist cloud layer as compared to all other cases studied in this paper. In the capping stable layer a sharp decrease of q, θe and P* is seen. The CBL top is taken at 620 hPa and is associated with minimum values of P* and θe. Thus in this region the top of the CBL is found between 750-620 hPa. The difference in the CBL characteristics may be attributed to the prevailing weather conditions and temporal variations.
Thus the analysis of the radiosonde data collected during MONSOON-77 experiment and pilot BOBMEX-98 experiment showed that the CBL is characterized by more or less similar features. The only marked difference found is that the CBLs during BOBMEX-98 are more moist as compared to those during MONSOON-77. This may possibly be due to the fact that the period 11-18 August 1977 belongs to the break monsoon condition over Indian subcontinent during the southwest monsoon season, whereas the period 30 October-7 November is associated with the transient disturbances observed over the Bay of Bengal region during the northeast monsoon season.
10. Summary and conclusions
The aerological observations collected through erstwhile USSR research vessels during MONSOON-77 in the Bay of Bengal region during the summer monsoon season (11-18 August 1977) have been used to examine the thermodynamic structure of the Convective Boundary Layer over the oceanic region. Also, in order to compare the CBL characteristics obtained through MONSOON-77 with the latest conducted experiment over the Bay of Bengal region, aerological observations obtained from BOBMEX-98 have been used. The investigation of the 6-hourly average values of the thermodynamical parameters at the locations E, N, W and S showed the following:
The sub cloud layer, a layer in which gradient of θV is very small (< 1 K per 100 hPa), was found to be from surface up to 900 hPa at all the locations viz. E (Shirshov), N (Priboy), E (Shokalsky) and S (Okean). The extent of cloud layer, a layer associated with nearly constant P* values, varied from 860-710 hPa in the region under consideration. The tops of the CBL determined by the minimum of θe and P* during the summer monsoon over the oceanic region were found to be in between 750-580 hPa.
The conserved variable diagrams (θe--q) at all the locations showed a single mixing line structure from surface up to the top of the CBL. The CBL top is associated with rather flat minimum of θe as observed by Parasnis (1991) for the active monsoon conditions.
The 6-hourly daily values of surface meteorological parameters showed diurnal variation. Also, the influence of the prevailing synoptic scale disturbances is clearly evident from these profiles.
The vertical profiles of zonal and meridional components of winds over the observational area showed that the flow was southwesterly in the layer surface to 650 hPa thereafter it tends to become northeasterly in the upper layers. The maximum wind was observed in the layer 950-900 hPa.
The study of the vertical velocity profiles in the region (15-19°N, 87-91°E) showed that in general, the region was dominated by ascending motions. This confirms the influence of the prevailing synoptic scale disturbances.
The analysis carried out utilizing the observations obtained from BOBMEX-98 explored the influence of transient disturbances on the CBL structure. Also, a marked temporal variation is observed.
LIST OF SYMBOLS
T Temperature (K)
Td Dew point temperature (K)
p Parcel pressure (hPa)
pSL Pressure at saturation level (hPa)
P* Saturation pressure deficit (hPa)
q Humidity mixing ratio (gm kg-1)
qSL Humidity mixing ratio at saturation level (gm kg-1)
θ Potential temperature (K)
θSL Potential temperature at saturation level (K)
θv Virtual potential temperature (K)
θe Equivalent potential temperature (K)
θes Saturated equivalent potential temperature (K)
U Zonal component of wind (m sec-1)
V Meridional component of wind (m sec-1)
Acknowledgements
The author is very thankful to Dr. G. B. Pant, Director, Indian Institute of Tropical Meteorology for providing facilities to undertake the above study. Thanks are also due to Dr. P. C. S. Devara, Deputy Director and Head (P. M. and A. Division) for encouragement and keen interest. The author is very grateful to Dr. P. E. Raj, Assistant Director for useful discussion and valuable suggestions during the course of the present study. The ship data used in the above study has been obtained from Indian Meteorological Department. The author acknowledges International MONEX Management Centre (IMMC), New Delhi and ADGM (R) Office, Pune for the data source. The author gratefully acknowledges the India Meteorological Department and Department of Science and Technology, Government of India for making available the radiosonde data collected during the BOBMEX-98. The author is very thankful to the anonymous referees for useful suggestions, which were very helpful in the modification of the revised manuscript.
REFERENCES
Betts, A. K., 1982a. Saturation Point Analysis of Moist Convective Overturning. J. Atmos Sci., 39, 1484-1505. [ Links ]
Betts, A. K., 1982b. Cloud Themodynamic Models in Saturation Point Coordinates. J. Atmos. Sci., 39, 2182-2191. [ Links ]
Betts, A. K., 1983. Thermodynamics of Mixed Stratocumulus Layers: Saturation Point Budget. J. Atmos. Sci., 40, 2655-2670. [ Links ]
Betts, A. K., 1985. Mixing Line Analysis of Cloud and Cloudy Boundary Layers. J. Atmos. Sci., 42, 2751-2763. [ Links ]
Betts, A. K., 1986. A New Convective Adjustment Scheme, Part I: Observational and Theoretical Basis. Quart. J. Roy. Meteor. Soc., 112, 677-691. [ Links ]
Betts, A. K. and B. A. Albrecht, 1987. Conserved Variable Analysis of the Convective Boundary Layer Thermodynamic Structure over the Tropical Oceans. J. Atmos. Sci., 44, 83-99. [ Links ]
Dube, S. K., A. D. Rao, P. C. Sinha, T. S. Murty and N. Bahulayan, 1997. Storm Surge in the Bay of Bengal and Arabian Sea: The Problem and its Prediction. Mausam, 48, 283-304. [ Links ]
Kloesel, K. A. and B. A. Albrecht, 1989. Low-level Inversions over the Tropical Pacific Thermodynamic Structure of the Boundary Layer and the above Inversion Moisture Structure. Mon. Wea. Rev., 117, 87-101. [ Links ]
Morwal, S. B., 1998. Nature and Some Evolutionary Aspects of the Monsoon Boundary Layer. Ph. D. Thesis, Pune University, 216 p. [ Links ]
Morwal, S. B., 2000. Convective Boundary Layer Structure over the Equatorial Indian Oceanic Region. Mausam, 51, 169-176. [ Links ]
Parasnis, S. S., 1991. Convective Boundary Layer During Active and Break Conditions of Summer Monsoon. J. Atmos. Sci., 48, 999-1002. [ Links ]
Parasnis, S. S. and S. B. Morwal, 1991. Convective Boundary Layer over the Deccan Plateau, India during Summer Monsoon, Bound.-Layer Meteorol, 54, 59-68. [ Links ]
Parasnis, S. S. and S. B. Morwal, 1993a. Themodynamic Structure of the Marine Boundary Layer over the Arabian Sea as Revealed by the MONSOON-77 Data. Bound.-Layer Meteorol., 63, 365-380. [ Links ]
Parasnis, S. S. and S. B. Morwal, 1993b. Radiatively Driven Subsidence over the Eastern Arabian Sea with MONSOON-7-7 Data. Ind. J. Radio & Space Phys., 22, 235-238. [ Links ]
Parasnis, S. S., S. B. Morwal and K. G. Vernekar, 1991. Convective boundary Layer in the Region of the Monsoon Trough-A Case Study. Adv. Atmos. Sci., 8, 505-509. [ Links ]
Rao, R. R., K. V. S. Raman, D. S. Rao and M. X. Joseph, 1985. Surface Heat Budget Estimation at Selected Areas of North Indian Ocean during Monsoon-77. Mausam, 36, 21-32. [ Links ]
Rao, R. R., S. V. S. Somanadham, S. S. V. S. Ramakrishna and R. Ramanadham, 1987. A Case Study of the Genesis of a Monsoon Depression in the Northern Bay of Bengal during Monsoon-77 Experiment. Mausam, 38, 387-397. [ Links ]
Ryan, B. F., K. J. Wilson and E. J. Zipsor, 1989. Modification of the Thermodynamic Structure of the Lower Troposphere by the Evaporation of Precipitation ahead of a Cold Front. Mon. Wea. Rev., 117, 138-153. [ Links ]
Sen, P. N. and H. P. Das, 1986. Some Synoptic Aspects of the Low Level Inversion Over Arabian Sea During MONEX-79. Mausam, 37, 117-122. [ Links ]

