


Services on Demand
Journal
Article
 English (pdf)
 Article in xml format
 Article references
 Send this article by e-mail
Indicators
-
 Cited by SciELO
 -
 Access statistics
Related links
-
 Similars in
SciELO
Similars in
SciELO
Share

 Permalink
Atmósfera
Print version ISSN 0187-6236
Atmósfera vol.14 n.3 Ciudad de México Jul. 2001
Estimate of the upper limit of amplitude of Solar Cycle No. 23
V. M. Silbergleit 1,2 and P. A. Larocca 1
1 Departamento de Física, Facultad de Ingeniería, UBA
2 CONICET, Argentina
(Manuscript received July 4, 2000; accepted in final form Nov. 22, 2000)
RESUMEN
Se consideran los valores de los índices A A* de valor mayor que 60 10T–9 Tesla para caracterizar tormentas geomagnéticas ya que las series disponibles de estos índices van desde 1868 hasta 1998 (el más largo intervalo de la actividad geomagnética existente). Aplicando la técnica del precursor hemos realizado un análisis de los periodos de tormentas y la actividad solar obteniendo una buena correlación entre el número de tormentas (α) índices AA*) y las amplitudes de los ciclos solares corriente (ζ) y el próximo (μ). Usando el método de regresión múltiple aplicado a α = A + Bζ + Cμ, las constantes resultaron: A = —33 ± 18, B = 0.74 ± 0.13 and C = 0.56 ± 0.13. El método estadístico presentado indica que el ciclo actual (número 23) tendría un pico de 202 ± 57 manchas mensuales promedio. Este valor indica que la actividad solar seria alta produciendo importantes efectos en el medio ambiente terrestre.
ABSTRACT
AA* indices of values greater than 60 10–9 Tesla are considered in order to characterize geomagnetic storms since the available series of these indices comprise the years from 1868 to 1998 (the longest existing interval of geomagnetic activity). By applying the precursor technique we have performed an analysis of the storm periods and the solar activity, obtaining a good correlation between the number of storms (α) (characterized by the AA* indices) and the amplitudes of each solar cycle (ζ) and those of the next (μ). Using the multiple regression method applied to α = A + Bζ, + Cμ, the constants are calculated and the values found are: A = —33 ± 18, B = 0.74 ± 0.13 and C = 0.56 ±0.13.
The present statistical method indicates that the current solar cycle (number 23) would have an upper limit of 202 ± 57 monthly mean sunspots. This value indicates that the solar activity would be high causing important effects on the Earth's environment.
1. Introduction
The precursor method is a technique that can be used to forecast the amplitudes of the solar cycles. This method is based on the correlation between the observed phenomena or those originated in the sun, during a solar cycle and the observations of geomagnetic storms. Besides, it considers that a solar cycle actually starts some years before the minimum.
We apply this method to forecast the amplitude of solar cycle number 23, to that effect, the AA* indices which characterize geomagnetic storms are considered. The average daily AA* indices is obtained from the aa index that has been utilized in previous publications Silbergleit (1999a and 1999b). These indices are calculated using magnetograms of two observatories located in England and in Australia. An historical advantage of using the AA* indices is that such indices have been collected since 1868 up to the present time, in this way a long temporal series of data is obtained. AA* indices are calculated in a way similar to the Ap but the available series are longer. Due to the difference of units in which the Ap and the AA* indices are measured, the values are different because different reference values are taken for the beginning and end of a magnetic storm. Comparing the years when the values overlap, it is shown that the relative frequency of storms per year is the same. Another reason to analyze them is that an index derived from values of magnetic disturbances in only two observatories clearly shows extreme values, because the places where the data are entered located above the ionosphere or due to systems of currents of aligned fields produce magnetic effects. It is interesting to note that the total level of magnetic disturbances per year has substantially increased since 1900. The mean annual aa value is greater at the present than the levels of maximum disturbance obtained before 1900.
The observation of annual distribution of the Ap indices reveals maximum values where the values of magnetic storms are high. The same distribution is observed in aa indices. In order to calculate AA*, aa indices are taken in a three-hour period, when the average exceeds 60 nT ( 1 nT = 10–9 Tesla) a magnetic storm is regarded as being in progress. Arbitrarily is considered that such storm continues until the mean value decreases from 60 nT. The maximum value obtained is referred to as AA*.
Considering the average of 24 hours of disturbance of maximum geomagnetic storms, it is possible to obtain these indices from the NOOA home page (The data used in the present article were downloaded via FTP at ftp://ftp.ngdc.noaa.gov/STP/).
The precursor method was used among others by Thompson (1992). The present paper considers the observations of the activity up to the present also utilizing these new AA* indices as the measure of geomagnetic storms. Figure 1 shows the maximum values of the AA* indices for the period from 1868 to 1998.

There also exist different publications about the forecast of the maximum amplitudes of the solar cycle using the most diverse methods (see Gleissberg, 1942; Joselyn et al., 1997; Silbergleit, 1998; Silbergleit and Larocca, 2000).
2. Solar activity and geomagnetic indices
Sunspots are the most perceptible proof of the Sun's magnetic activity. They were observed from the Earth since the 17th Century. When the Sun's activity reaches its peak (during the maximum complexity of the magnetic field configuration), the number of sunspots has the highest. As it was predicted, the present solar cycle would has its maximum in the current year.
As sunspots are the signal of the Sun's activity, the number of magnetic storms is correlated with the number of the sunspots. Geomagnetic indices are often used to study these interrelationships and to determine causal sequences.
The aa index is a global index of magnetic activity, it is calculated from the K indices of two nearly antipodal magnetic observatories. The historical advantage to use aa is that these indices are calculated from magnetograms of earlier observations, they are derived from 1868 to the present. The level of mean yearly aa is now much higher than years at maximum disturbance levels before 1900.
The AA* indices are derived for a longer span of years. They exhibit a difference in units of presentation with the values of Ap*. However their comparison presents relative frequency of occurrence of major storms per year very similar. An important reason for differences is that the AA* indices easily have larger extreme values if either input site is well placed to the overhead ionospheric and or field aligned current systems. The K-index is quasi-logarithmic local index of the 3-hourly rank in magnetic activity related to an assumed quiet-day curve for a single geomagnetic observatory place. It consists of a single-digit between 0 and 9 for each three-hour interval of the universal time day (UT). The planetary 3-hour-range index Kp is the mean standardized K-index from 13 geomagnetic observatories between 44° and 60° northern or southern geomagnetic latitude. This planetary index is designed to measure solar particle radiation by its magnetic effects.
Examination of the annual distribution of Ap indices revealed UT-days when elevated, clearly magnetic storm value. Daily regular magnetic field variation arise from current systems caused by regular solar radiation changes. Other irregular current systems produce magnetic field variations caused by:
1 the interaction of the solar wind with the magnetosphere,
2 the magnetosphere itself,
3 the interactions between the magnetosphere and ionosphere, and
4 the ionosphere itself.
Magnetic activity indices were designed to describe variation in the geomagnetic field caused by these irregular current systems.
3. The precursor method
From the analysis of the magnetic data it is inferred that the number of geomagnetic storms during each solar cycle depends on the maximum amplitudes of:
a) the solar cycle during which it is observed, and
b) the next solar cycle.
According to Thompson (1992), the control of a solar cycle can appear as soon as the previous solar maximum. It means that each cycle, is a complex mixture between the cycle itself and the next one.
In the present study the data are analyzed taking into account this fact and considering the AA* indices of geomagnetic activity (that characterize geomagnetic storms). Figure 2 shows the values of the solar activity measured as the monthly average number of sunspots. Table 1 shows the maximum amplitudes of each solar cycle for the same period.

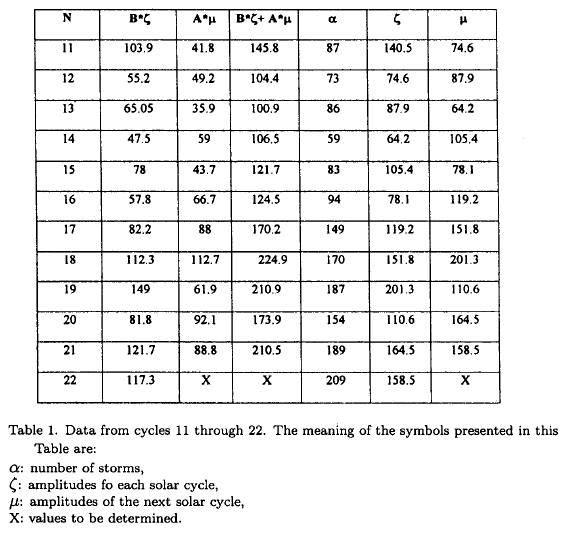
Using the linear relationship:

and applying the method of the multiple linear regression to the series of data shown in the Table 1, the constant values are obtained. Their values are equal to: A = —33 ± 18, B = 0.74 ± 0.13 and C = 0.56 ± 0.13.
Thompson (1992) used the historical data to verify the results obtained with this method. He studied the maximum amplitudes of the solar cycles ranging from number 12 to 22 considering Eq. (1).
Figure 3 shows the linear regression which gives the number of magnetic storms in terms of the amplitudes of each cycle and the following cycle, considering Eq (2). The best adjustment indicates that:
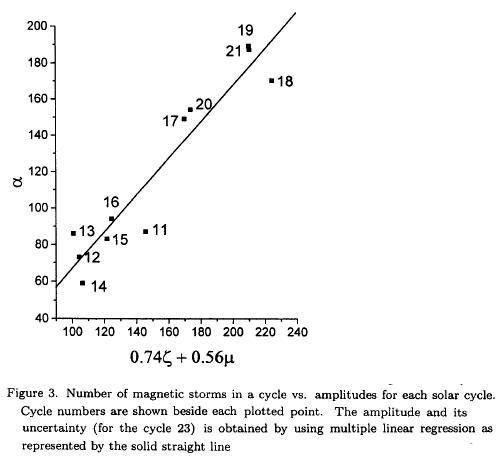

Where α is the number of magnetic storms, ζ the amplitude of the current solar cycle and μ the amplitude of the next solar cycle. The coefficient of the linear correlation turned out to be 0.977.
The amplitude of a solar cycle can be forecast using equation (2). The α value represents the number of magnetic storms observed up to the minimum of the solar activity, previous to the beginning of the new cycle. A better precision is achieved in the multiple linear regression performed, by taking into account both terms.
4. The upper limit of the maximum solar activity for cycle No. 23
Equation (2) allows us to make an estimation of the maximum amplitude to be expected during solar cycle number 23. Using the values of the AA* indices and the number of sunspots as measurements of the geomagnetic activity and the solar activity respectively, it is found that for the next solar cycle its peak value would be (202 ± 57) monthly mean sunspots. This result agrees with prior publications as:
a) Silbergleit (1998) who forecasts a value of the maximum solar activity for cycle No. 23 of (173 ± 14) monthly average spots and
b) Joselyn et al. (1997) found a maximum expected value of the solar activity of (160 ± 30) smoothed monthly average spots.
Figure 4 shows the recent sunspot observations and the predicted peak value for the current cycle as obtained by using the best linear regression fitting adjustment.
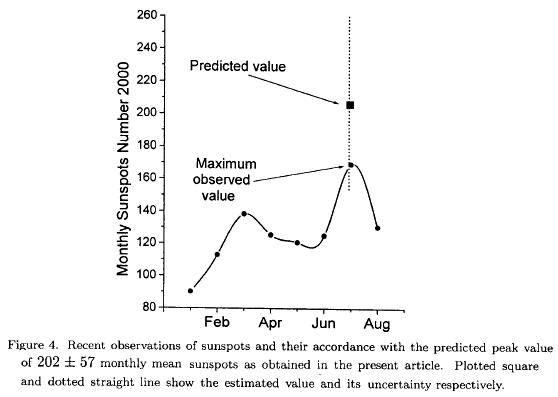
The maximum spot number observed during the year 2000 is in agreement with the low limit of the predicted peak value of 202 ± 57.
The present article shows a quick manner to evaluate the upper limit of the maximum solar cycle 23 by using Equation (2). Considering these results it is possible to verify the advantage of this method within the limits of calculated error.
The occurrence of magnetic disturbances depends on the solar activity during the cycle in which those disturbances are observed and on the previous cycle, it is important to take this effect into account. Many applications of the precursor technique only consider the final period of the previous cycle.
Acknowledgements
Thanks are due to L. Morris of the WDC -A for STP of NOAA for including the AA* data in the NOAA's home page. The authors are most grateful to the referees for their valuable comments and suggestions. Thanks are also done to E. Lemesoff for the English version of the paper. This article was partially supported by an Agreement Facultad de Ingeniería (Universidad de Buenos Aires) and CONICET of Argentina.
REFERENCES
Gleisberg, W., 1942. Probability laws of sunspot variations. Astrophys. J. 96, 234-238. [ Links ]
Joselyn, J. A., J. B. Anderson, H. Cofley, K. Harvey, D. Hathaway, G. Heckman, E. Hildner, W. Mende, K. Schatten, R. Thompson, A. W. P. Thompson, and O. R. White, 1997. Panel achieves consensus prediction of solar cycle 23. EOS Trans. AGU, 78 205-212. [ Links ]
Silbergleit, V. M., 1998. On the statistics of maximum sunspot numbers. Journal of Atmospheric and Solar Terrestrial Physics, 60, 1707-1710. [ Links ]
Silbergleit, V. M., 1999a. Forecast of the most geomagnetically disturbed days. Earth Planets and Space, 51 19-22. [ Links ] -
Silbergleit, V. M., 1999b. The most geomagnetically disturbed 24 hours. Studia Geoph. et Geod. 194-200. [ Links ]
Silbergleit, V. M. and P. A. Larocca, 2000. The Magnetic storms and the Solar variability. Scientific programme of the European Geophysical Society. [ Links ]
Thompson, R., 1992. A technique for predicting the amplitud of the solar cycle. Proceedings Solar Terrestrial Predictions IV, 2, 321-325. [ Links ]

