


Services on Demand
Journal
Article
 English (pdf)
 Article in xml format
 Article references
 Send this article by e-mail
Indicators
-
 Cited by SciELO
 -
 Access statistics
Related links
-
 Similars in
SciELO
Similars in
SciELO
Share

 Permalink
Atmósfera
Print version ISSN 0187-6236
Atmósfera vol.14 n.2 Ciudad de México Apr. 2001
Interannual variability of temperature spells over Argentina
M. M. Rusticucci and
Departamento de Ciencias de la Atmósfera y los Océanos, Universidad de Buenos Aires
W. M. Vargas
CONICET Buenos Aires, Argentina
(Manuscript received March 6, 2000; accepted in final form August 16, 2000)
RESUMEN
En este trabajo se estudia la variabilidad interanual de las olas de calor y frío extremas sobre la Argentina, como la manifestación de irrupciones extremas de aire tropical y polar. Se consideran las temperaturas de superficie diarias en el periodo 1959/96, a partir de las cuales se calculan dos parámetros para definir las olas: persistencia e intensidad.
La cantidad de olas extremas por año muestra dos escalas de variabilidad: bianual y de frecuencia mayor a 10 años, lo que es más importante en verano que en invierno, y en la intensidad de las olas que en su persistencia. La cantidad de olas de calor extremas aumenta hasta el final de los años sesenta, lo que refleja un aumento del flujo del noreste. De ahí en adelante, disminuye significativamente. La variabilidad interanual de las olas de frío es mayor a partir de los años ochenta, indicando una mayor variabilidad de la permanencia de un sistema anticiclónico sobre el país. Hay mayor cantidad de casos de estas olas en los últimos años.
Se analiza el posible efecto de El Niño en la ocurrencia de las mismas, mediante tres indices diferentes. Las olas de calor de invierno son más persistentes en el año 0 de El Niño y más intensas en el invierno siguiente. En los meses más cálidos (especialmente en noviembre y diciembre) estas olas se presentan más intensas en caso de La Niña. Las olas de frío extremas que alcanzan el norte del país, son más persistentes en meses de La Niña, con el riesgo consecuente de que las masas de aire frío alcancen latitudes menores en esta fase del ENSO.
ABSTRACT
This work is aimed at studying the interannual variability of surface temperature cold spells and warm spells due to cold-and warm-air incursions. The effect of the ENSO event on the occurrence of extreme spells having three different indices was studied. In order to track changes during the 1959/96 period, spell parameters, persistence and intensity, have been studied from daily temperatures.
The number of extreme spells per year show low frequency variability plus a biennial variability, which is more important in its intensity than in its persistence, and in summer rather than in winter. The number of extreme warm spells increases until the end of the sixties and seventies, reflecting an increase of northeasterly flow. From then onwards, the trend starts to decline significantly over northern Argentina. The interannual variability of extreme winter cold spells increases from the 80's onwards, indicating the variation of anticyclone permanence over the country. Cases are more numerous in the latest years.
Extreme spell occurrence in northern Argentina is closely linked to the El Niño phenomenon. Winter warm spells are more persistent in an El Niño (0) year and more intense and persistent in the year following El Niño. In summer, however, there is either no difference, or the relationship is reversed, resulting in more intense situations in November and December in the case of La Niña. Cold spells reaching the northeastern most part of the country are more persistent when La Niña occurs, the conclusion being that the region would be affected by extreme cold spells when La Niña is active.
Keywords: Argentina, Warm/Cold-air incursions, ENSO, Interannual.
1. Introduction
That the analysis of long-term variability of temperature should include extreme values is already well known, especially for studies of climate change. There are few published studies on some regions of the Southern Hemisphere. In the case of Australia, Plummer (1996) analyzed the changes on reliable surface data for the period 1961-93 by considering maximum and minimum temperature values, and showing the long-term variability of the daily amplitude. In Hoffmann (1997), working with Argentinean data, the interdecadal temperature variability for some stations was analyzed showing positive trends in the 10-year averaged temperatures, which are stronger in southern Argentina.
With respect to temperature variability on scales shorter than a day, Rusticucci and Vargas (1995a) studied dry- and wet- bulb temperatures every six hours at Argentine stations giving also monthly extremes. Later, Rusticucci and Vargas (1995b) (hereinafter RVb) carried out a climatic-synoptic study of circulation types during extreme temperature spells over Argentina. They found that extreme warm spells, either in summer or in winter, are related to a steady north-northeasterly flow, as in the case analyzed by Campetella and Rusticucci (1998). Winter cold spells feature a surface anticyclone, which enters from the South and spreads over the whole territory. The persistence of cold spells results from a trough near the east coast that favors southwesterly flow over the continent. Intense summer cold spells result from more frequent than normal frontal passages (RVb) or from an abnormal cold air mass trajectory as in the case examined by Cerne y Rusticucci (1997).
Among long-term studies concerning changes in temperature and rainfall regimes observed in Argentina during recent decades, Rusticucci and Penalba (2000) concluded that the correlation between rainfall and temperature has increased with time in central Argentina. Vargas et al. (1997) demonstrated the existence of climatic jumps during 1950 and 1970 for sea-level pressure and circulation indexes over the region.
The aim of this study is to understand how this variability observed both in the annual values and the meteorological temperature regimes is related to warm and cold spell frequency and occurrence, that represent the extreme warm and cold air incursions.
Results are presented as follows: the definition of 'spell', the interannual and interdecadal variability of the extreme spells, and the ENSO relationship with the occurrence of extreme spells.
2. Analysis and methodology
2.1. Definition of 'spell'
Surface temperature data measured at 2100 (local time) during the 1959/1996 period were used for this study. Spells had been defined as daily sequences of temperature anomalies having identical sign. Three parameters have been considered: the length or 'persistence', i.e. the number of uninterrupted days having the same anomaly sign, the 'maximum' in-spell value of the anomaly, and the 'intensity' computed as the average in-spell anomalies.
Temperature anomalies have been computed by subtracting from daily temperatures the value of the corresponding day in the mean annual wave, which is estimated as the sum of the first two harmonics to the series of mean daily temperatures during the period 1959/1996: Such harmonics which correspond to an annual and semi-annual cycle, explain 97% of the series variance.
From the Climatic Atlas of Southamerica, (Hoffmann, 1975), it may be seen that temperature is homogeneous over the region. Besides, RVb and Scian (1970) show that when an extreme temperature air mass enters it results in extreme spells in most stations. This derives from the fact that spells result from large-scale spatial synoptic systems. Hence, this study includes only three reference stations with the best available records, located over the entrance areas for cold and warm air masses. The results for other stations are similar to those presented here.
2.2.Extreme Spells
The study of climatic extremes takes into account the time variability analysis of parameters defining cold and warm-spells (persistence, intensity). Simultaneously, since synoptic conditions causing extreme spells are well known, it is desirable to infer their low-frequency variability conditions from a database (temperature data) covering a longer (and more reliable) period than the one available for the study or circulation, at least concerning data derived from stations.
Each spell is classified as extreme if its persistence, its maximum or its intensity is located in the last quartile of the corresponding parameter distribution corresponding to that month (for the whole period under study). The value of the third quartile (75%) is used in order to obtain a robust value for extreme parameters, since only 25% of each station's spells exceed that value. This criterion is more appropriate than sometimes using standard deviations because the third quartile indicates a probability value, while is not available from the standard deviation since the distributions are highly asymmetrical.
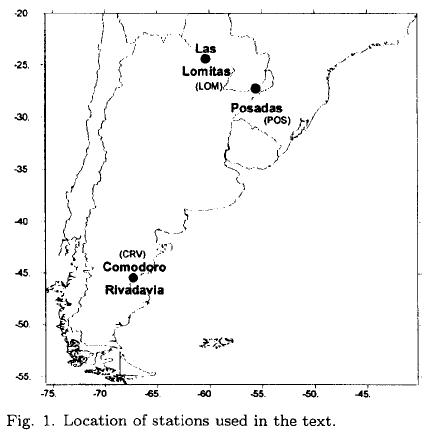
Extreme spells have been selected for each season and year in Las Lomitas and Posadas (the exact location of the stations considered is shown in Figure 1). Las Lomitas, located in North Central Argentina, should detect warm air masses entering from the North-Northwest. Similarly, Posadas should detect extreme cold spells, entering into Argentina, crossing its territory, and reaching Brazil as cold surges. The geographical reach of warm spells getting in through Las Lomitas can be evaluated in Posadas. Values from the third Las Lomitas quartile may be seen in Table I, and should be taken as reference in the following discussion. It should be noted that systems are more intense and persistent in winter. Besides, in winter, a one-day difference may be noticed between cold-spell and warm-spell persistence. So, that synoptic systems lasting more than 4 (summer) or 6 (winter) days, have low (< 25%) probability of occurrence.

In order to examine the influence of extreme spells on seasonal averages, Figure 2 shows the number of extreme spells per season vs. mean seasonal temperature at Las Lomitas. As was to be expected, there is a direct relationship between the number of extreme (according to persistence or maximum value) warm spells and seasonal temperature, and an inverse relationship in the case of cold spells. As may be seen in Table II, where the r2 of regressions are shown, regression is more significant in summer, explaining in this case more than 60% of the variance for warm spells. In summer, persistence in cold spells shows the highest percentage (72%) and the highest slope, thus resulting in the most significant factor and involving synoptic conditions most relevant for the characterization of the seasonal temperature mean value. It is remarkable, however, that the maximum anomaly value in a cold spell does not condition summer temperature values: the slope is less steep and the correlation coefficient is less than 0.01 (not significant). This is due to the warming capacity of the dry air mass, resulting from an anticyclone coming behind a cold front. In winter, the percentages of variance explained by regression are lower, i.e., the relationship between the variables is weaken. Obviously, there are some other factors like radiative processes and cloudiness, which might inhibit low temperature persistence.


2.3. Time Development of extreme spell parameters
The number of extreme spells according to the different parameters at Las Lomitas for every year is shown in Figure 3. Each of the curves integrating a graph indicates the number of spells per year, according to persistence, maximum value or intensity. To the left, the interannual variability is shown, and to the right, 10-year averages are indicated, starting from 1959/68.
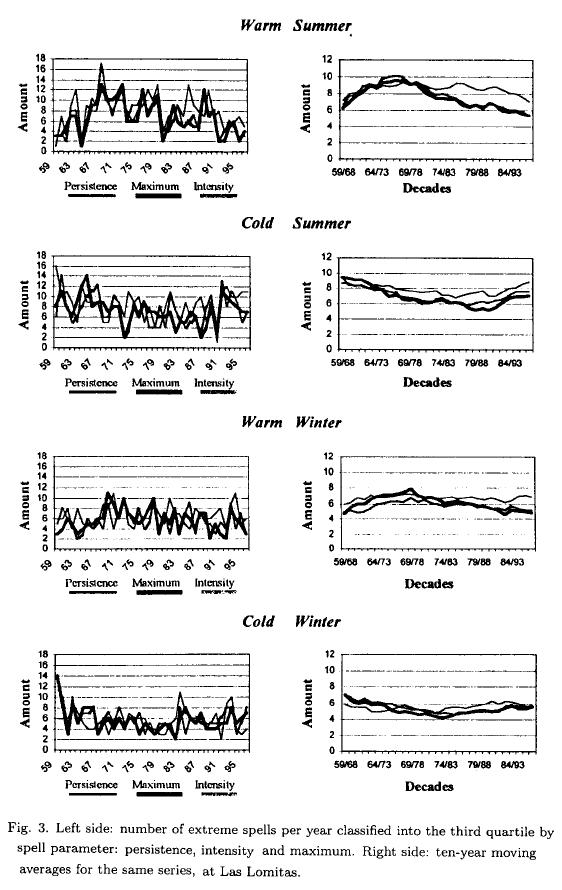
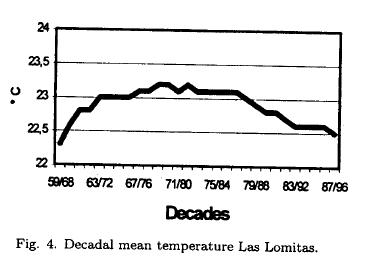
The interannual variability involved in the 'intensity' parameter of each spell shows the presence of the biennial oscillation in the annual amount of extreme spells, also suggested a low frequency oscillation. Extreme-summer-warm-spells show a low-frequency variability more important than winter in their maxima and intensity, and slightly less significant in persistence. According to RVb, such spells result from a persistent northeast flow. The amount of extreme-warm-spells increases up to 1960 and 1970 decades. Up to the 1967/76 period, there is an increase on warm-spell occurrence and a decrease in cold-spell occurrence, although not completely in phase. This variability has the consequence of the variability of the synoptic systems associated and is consistent with the decadal mean temperature variability evident in annual temperature values for the stations over this region. In Figure 4, the decadal march of temperature at Las Lomitas is shown. The change in trend sign accompanying extreme warm spells in summer and winter should be noticed. Rosenblüth et al. (1997) show a similar negative trend in summer temperatures for the whole period 1960-92 over Salta and La Quiaca, located to the west of Argentina, at the same latitude.
Summer extreme-cold-spells diminish in intensity up to the 80's, when a positive trend arises covering the remaining record. The intensity parameter, which has less influence on seasonal mean temperature, shows the greatest decrease in annual cases. This might indicate that the frontal passage frequency (RVb) was recovering the values attained in the 60's, after a noticeable weakening involving half of the cases every year with respect to the 59/68 decade. The persistence of such cold spells (the parameter having the greatest influence on seasonal temperature) matches at the beginning of the record the behavior of warm spells (with opposite sign) and remains approximately constant until it rises at the end.
In general, the winter shows less long-term variability than summer as far as extreme spells are concerned. In the 80's a change in inter-annual variability may be noticed. From the 80's onwards, the inter-annual variability of winter cold extreme spells increases. This indicates an anticyclone permanence variation over the continent, according to RVb, more remarkable in the 1981/90 period, and more variable from year to year.
The above analysis indicates a low-frequency variability or a climatic jump in spell properties at the beginning of the 70's. This may be related and confirm what certain authors as Hurrel and Van Loon (1994) have found for circulation; later summarized and analyzed by Chen and Yen (1997) who concludes, among others, that cyclonic activity has been enhanced in the last two decades (71/80 and 81/90) in high Southern Hemisphere latitudes.
Related to this, It would be important to explore if that low frequency variability has made some later change on the structure of spells. Thus, the joint distribution between the maximum values and the spell-persistence is analyzed, and comparisons between the 71/80 and 81/90 decades are made. At this point, Comodoro Rivadavia (CRV) is included as representing stations from the southernmost regions of the country. Both Las Lomitas (LOM) and Comodoro Rivadavia (CRV), show that the most frequent (between 44% and 62%) spell lasts two days or less, with a temperature anomaly of 3°C or less. Spells which persist 4 days or less and an intensity of 6°C or less, account for a range from 77% to 88% depending on the station and the decade in question.
Distributions among decades are significantly different: the structure of cold and warm spells has changed throughout the decades under study. Considering as the theoretical distribution the one corresponding to the 1971/80 decade, the Chi-square test applied to contingency tables rejects the hypotesis that distributions belong to the same population for both decades and both seasons.
In Figure 5, the percentage frequency difference between 1971/80 and 1981/90 spells is presented for both winter and summer, considering one parameter at a time (maximum and persistence). Percentage values are related to the 1971/80 period, and positive values indicate more cases in 1981/90. These results should be interpreted as follows: a value of +30% means that in that category, the number of cases was 30% higher in the 81/90 than in the 71/80 decade. The largest differences are in strongest spells. Differences are much lower for the lower values of persistence and of maximum (as a result of short period situations).
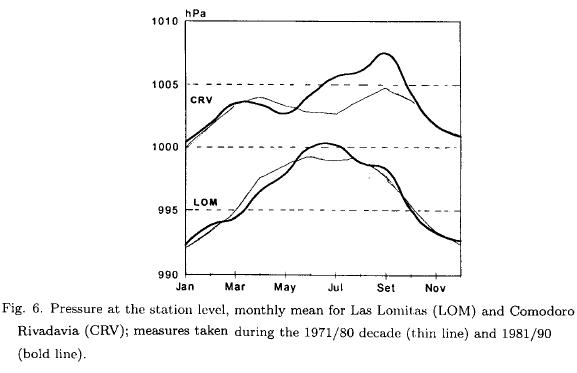
Cold winter spells have more cases than the 71/80 decade, except for the extreme maximum values, where the number of cases is greater in the decade 81/90. This indicates for the 81/90 decade the higher frequency of cold anticyclones covering the whole Argentine territory (RVb). Such conclusion is reinforced by the analysis of mean monthly pressure values at both stations (Climatological Statistics, SMN), that are noticeably higher between June and October, especially at CRV (Figure 6).
It should be remarked, besides, that at CRV, in the 81/90 decade summers, the number of extremely intense warm spells is greater, whilst the number of cold spells is lower, thus justifying the higher mean temperature value observed by Hoffmann et al. (1997).
The high persistence of spells over the whole country in both seasons shows that the highest meridional transference of energy occurred in the 1971/80 period. Particularly, cold summer spells, due to a greater inrush of cold air masses at low latitudes are more intense and persistent in the 71/80 decade.
Hence, we suggest that the change in the great meridional flow and the high persistence are the main features of the interdecadal variability analyzed.
2.4. Spell Occurrence and ENSO Events
The important inter-annual variability observed is related to larger-scale phenomena, such as ENSO. This is analyzed from two different points of view: either by comparing spell structure (frequency distributions) between years classified as El Niño, or La Niña, or by relating the extreme spell-amount per month with sea surface temperature anomalies (SSTsA) in two regions over the equatorial Pacific.
In order to classify the years, suggestions made by Kiladis and Diaz (1989) have been considered: El Niño years are 63, 65, 72, 76, 82, 86 and also 92; La Niña years are 64, 70, 73, 75, 88 and also 95. The rest are regarded as neutral. Spells are segregated for each month taking into account the occurrence of either El Niño or La Niña that same year (0) or the year after (1). (Niño/Niña: 0 or 1, respectively), the third quartile value of each parameter for each monthly series was computed.
Since oceanic phases are an important factor to be considered, if there had been an indication, it would be evident in northern Argentina. Therefore, the possible relationship between ENSO and temperature spell occurrence over this region is analyzed. Differences between the third quartile of each parameter between a month classified as El Niño and one classified as La Niña are illustrated in Figure 7 for Posadas station, since the input there is stronger than that of Las Lomitas. From April of year 0 to October of year 1.
A third quartile value greater than another one indicate that in this phase the extreme 25% of spells are more intense or persistent (according to the paramenter under consideration). The graph must be interpreted as follows: e.g., in June of year 0, extreme (third quartile) warm-spells in cases of El Niño show a persistence seven days longer than those of June in the year 0 of La Niña.
It can be concluded that, in so far as El Niño is active, warm spells are more persistent, showing marked differences especially in winter of year 0. During spring, these differences are not relevant. In December instead, warm spells have less intensity than in La Niña. El Niño warm spells recover persistence and intensity from February to July of year 1. The greatest differences in warm spell persistence occur in the winter preceding El Niño, and the most intense occur in the winter following and an El Niño episode.
Cold spells are more persistent when La Niña is active than during an El Niño onset, with lower differences between quartiles than in warm-spell cases. It is assumed that La Niña cases favor the probability that cold-intense-spells penetrate into southern Brazil, affecting the whole region of the Rio de La Plata basin, an evident fact at Posadas.
Another type of classification has been considered to define whether a month is either El Niño or La Niña. Trenberth (1997) proposes a classification based on the anomalies from the zone El Niño 3+4. For this situation, there is no difference between year 0 and year 1, although advantage is taken from a greater clearness in results, since years are not miss-superimposed as occurs, for example, with El Niño 1 and La Niña 0 in the previous classification. Spells were classified as they occur in a month El Niño, La Niña or Neutral.
In Figure 8, differences between the third quartiles of maxima and of persistence are shown. The expressed pattern is similar and is shown in this case in two graphics. Figure 8 a offers differences in the third quartile for the case of warm spells in a month classified as El Niño minus La Niña, and El Niño minus Neutral (a positive value indicates a higher El Niño value). The same is valid for La Niña. In Figure 8 b, cold spells are shown. Great differences in warm-spell persistence are found between March and June, the intensity being variable. Every month, warm spells are more persistent in El Niño, and always lower that those of La Niña. For cold spells, the pattern is not so clear. The greatest differences may be seen at the maximum value during El Niño, between May and July; whilst in the case of La Niña, the more persistent are recorded in June and July.


A similar analysis was performed with the SSTsA in the zone denominated El Niño 1 + 2. Years with anomalies higher than 0.1°C are separated into positive- and negative-anomalies. Figure 9 shows the differences between positive SSTsA third quartiles and negative SSTsA third quartiles. As in the previous case, warm-spells are more intense in the winter of El Niño. Both November and December show more intense warm spells in the case of La Niña. Cold-spells, instead, do not differ significantly (except for February) from the two SST states in El Niño 1+2. Therefore, it can be said that La Niña cold-major spells do not occur simultaneously, at least with the SSTsA in El Niño 1 + 2.
The indication derived from SSTs A variability in the El Niño 1 + 2 area is weaker and spells in the two situations are not so clearly differentiated.
3. Conclusions
The scope of this research was to analyze the variability of extreme-temperature spell anomalies by using daily data for the period 1959/96 over Argentina.
Temperature extremes have been analyzed from the occurrence of cold-spells and warm-spells which represent certain types of circulation over Argentina. Seasonal temperature is related with the presence of extreme spells. The cold spells extreme persistence is highly related to the seasonal temperature in summer but the maximum anomaly does not. The spell structure has been changing through the decades that imply the variability of the synoptic systems associated with them. The occurrence of extreme spells has a low frequency-variability superimposed to a biennial variability, these are more important in maxima and intensity rather than in persistence, and stronger in summer than in winter. For both summer and winter, extreme warm-spell amount increases up to the end of the 60's and 70's, and from then onwards the trend begins to diminish significantly. The source of these spells is the permanence of the northeasterly circulation. Winter extreme cold-spell-amount per year is more variable from the 80's onwards, indicating a major variation in the permanence of the anticyclone over the continent, since this circulation is responsible for the most intense cold spells.
The occurrence of extreme spells has a close relationship with the ENSO event in some months. This has been analyzed through different indicators of the phenomenon. Results agree, indicating that warm spells in winter are more persistent during an El Niño 0 year, and both more persistent and intense during the year following El Niño, except that during the summer months either, there is no difference or the relationship is reversed. Thus, November and December warm spells are more intense in the case of La Niña. Cold spells reaching the Northeast appear to be more persistent when La Niña is active, in the coldest months. Therefore, it should be noticed that the region is liable to extreme cold spells when La Niña is active. Indications originated at the El Niño 1 + 2 zone for the occurrence of extreme spells in the region is significantly weaker.
Acknowledgements
This research has been funded through Project TW06 from by the Universidad de Buenos Aires, and through Project PIP 4557 from CONICET. The authors wish to thank to Dr. Vernon Kousky for his useful comments.
REFERENCES
Campetella, C. and M. Rusticucci, 1998. Synoptic analysis of an extreme heat spell over Argentina in March 1980, Meteorol. Appl, 5, 217-226. [ Links ]
Cerne, S. y M. Rusticucci, 1997. Estudio de la situación sinóptica asociada con la ola de frio extrema de febrero de 1996, Meteorológica, 22, 5-18. [ Links ]
Chen, T-C and Yen, M., 1997. Interdecadal variation of the Southern Hemisphere Circulations, J. Climate, 10, 805-812. [ Links ]
Hoffmann, J., 1975. Atlas climático de América del Sur, WMO Cartography. [ Links ]
Hoffmann, J., S. Nuñez and W. Vargas, 1997. Temperature, humidity and precipitation variations in Argentina and the adjacent Sub-Antarctic region during the present century, Meteorologische Zeitschrift, 6, 3-11. [ Links ]
Hurrell, J. and H. Van Loon, 1994. A modulation of the atmospheric annual cycle in the Southern Hemisphere, Tellus, 46 A, 325-338. [ Links ]
Kiladis, G. and H. Díaz, 1989. Global Climatic Anomalies Associated with Extremes in the Southern Oscillation, J. of Climate, 2, 1069-1990. [ Links ]
Plummer, N., 1996. Temperature variability and extremes over Australia: part 1 - recent observed changes. Aust. Met. Mag., 45, 233-250. [ Links ]
Rosenblüth, B., H. Fuenzalida and P. Aceituno, 1997. Recent temperature variations in Southern South America, Int. J. of Climatology, 17, 67-86. [ Links ]
Rusticucci, M. and O. Penalba, 2000. Interdecadal Changes in the Precipitation Seasonal Cycle over Southern South America. Relationship with Surface Temperature. Climate Research (in press). [ Links ]
Rusticucci, M. and W. Vargas, 1995a. Seasonal and diurnal patterns of dry- and wet-bulb temperatures over Argentina, Int. J. of Climatology, 15, 1273-1283. [ Links ]
Rusticucci, M. and W. Vargas, 1995b. Synoptic situations related to spells of extreme temperatures over Argentina, Meteorol. Appl., 2, 291-300. [ Links ]
Scian, B., 1970. Situación sinóptica asociada a las temperaturas extremas observadas en Junio 67. Meteorológica, 1, 22-37. [ Links ]
Trenberth, K., 1997. The Definition of El Niño, Bull. Amer. Meteor. Soc., 78, 2771-2777. [ Links ]
Vargas, W., J. Minetti and A. Poblete, 1997. Statistical Study of Climatic Jump in the Regional Zonal Circulation over South America, J. Met. Soc. Japan, 73, 849-856. [ Links ]

