


 text new page (beta)
 English (pdf)
 Article in xml format
 Article references
 Send this article by e-mail
 Cited by SciELO
  Similars in
SciELO
Similars in
SciELO 
 Permalink
Introduction
According to INEGI (2014), the restaurant industry in Mexico generated about 177,145 million pesos in 2013, representing 1.1% of the total GDP. The last economic census (2014) recorded 4,230,745 economic units, of which 10.7% belong to this industry, generating employment to 6.8% of total workers in the country. From all activities classified as services, the restauranteurs represent the second most important sector in employment generation.
Table 1 Economic importance of the restaurant industry in Mexico. 2013 data.
| National Total | Non-financial private services | Restaurant industry | Nacional Restaurant industry to a national total | |
|---|---|---|---|---|
| Economic Units | 4,230,745 | 1,613,601 | 451,854 | 10.7 |
| Total occupied personnel | 21,576,358 | 7,716,270 | 1,475,981 | 6.8 |
| Gross total production* | 13,984,313,218 | 2,355,720,107 | 244,436,092 | 1.8 |
| Mid consume* | 7,999,726,827 | 1,182,444,547 | 152,154,019 | 1.9 |
| Gross Censal added value* | 5,984,586,391 | 1,173,275,560 | 92,282,073 | 1.5 |
*Thousands of pesos
Source: INEGI. Economic census 2014
Restaurants are important for Mexico’s economy, although it’s well-known and generally accepted that it’s also one of the most competitive industries. Parsa et al. (2005) reported that the business failure for new restaurants in the US is about 30% in the first year, the cumulative failure rate in the second and third year are 45.39% and 59.74%, respectively, also showing evidence that the independent restaurants have a slightly higher failure rate (statistically significant) compared to franchise restaurants. In this fashion, it is also important to highlight that the restaurant industry in Mexico is formed by 451,783 units classified as micro and small business, which is about 99% of the structure of the national industry (INEGI, 2014), suggesting that most of these businesses are operated as independent businesses.
Several studies have researched the reasons why restaurants fail (Parsa et al., 2005; Duta et al., 2007; Self et al., 2015,) determining economic, marketing and managerial perspectives. From the managerial perspective, one of the most discussed causes of failure is the restauranteur’s inability to fulfill customers’ expectations (Parasuraman et al., 1991).
On the other hand, previous research (Balter, 2008) suggests word-of-mouth (WOM) impact in about 76% of purchase decisions. WOM has also been studied in the restaurant industry context, underlying that positive WOM communication emerges from satisfying service encounters, while a negative one generally emerges from dissatisfying experiences (Susskind, 2002).
The justification of this research relies on the purchase decision implications, the prior arguments of the importance of the industry in Mexico and the suggestion of previous research on this variable. Even though a lot of investigation regarding WOM has been done, the scopes narrow when we add the filter of full-service type restaurants in LATAM locations, having very limited studies with those characteristics, therefore finding an opportunity to fulfill a gap in the literature related to a level of analysis (the who) or phenomena (where) (Makadok et al, 2018) exploring the proposed independent variables.
Theoretical background
Theories supporting consumer behavior
In the study of the consumer, behavior, attitudes, and intentions have been analyzed under different theories with the purpose to generate different point of view and frameworks about these topics. The Theory of Reasoned Action (TRA) (Fishbein, 1979) has been one of the most used to explain related topics. TRA aims to explain volitional behaviors (Hale et al., 2002), Its explanatory scope excludes a wide range of behaviors such as those that are spontaneous, impulsive, habitual, the results of cravings, or simply scripted or mindless (Bentler & Speckart, 1979; Langer, 1989). Due the lack of information about the subject of study, it may not be accurate to analyze the proposed phenomena from this perspective.
Another frequently used framework for these topics is The Theory of Planned behavior (TPB) (Ajzen, 1991) which is an extension of TRA, this is one of the most used to explain research dealing with intention to perform behaviors. TPB relies in cognitive self-regulation to support what states in theory, this means the subject of study may have a dispositional approach to the prediction of behavior which may require examination of past efforts, since we don’t have any prior information about the subject of study (like frequency of the visits in a business or behaviors like actual word-of-mouth with friends and family) this framework does not seem to be the most accurate for the intended contribution.
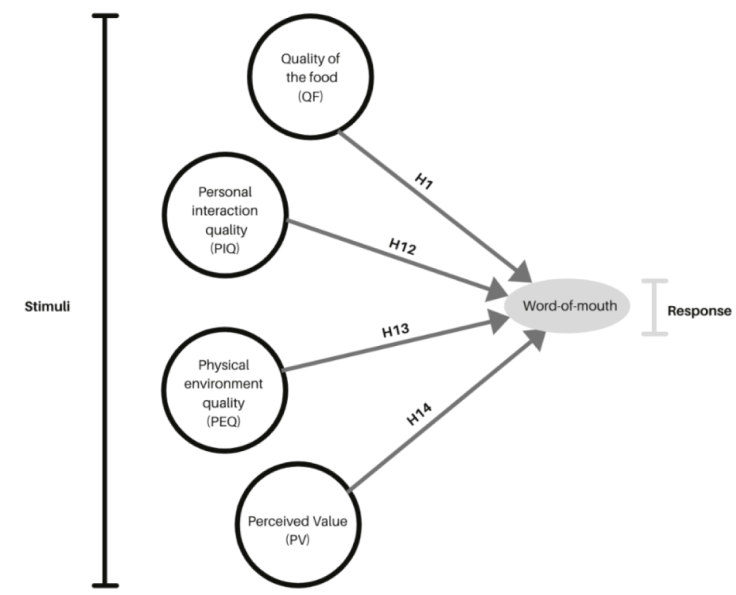
In the other hand, a conceptual framework helping to explain how WOM is related to the performance of a restaurant is the Stimuli-Organism-Response (SOR) model (Mehrabian & Russell, 1974). We found an interesting fit, since the consumer while living a service experience, there are elements that function as stimuli and are perceived by human senses, such as the taste and smell of the food or other elements related to the physical environment of the restaurant-denominated servicescape (Lin, 2004). In this case, the organism perceiving the stimuli are the customers living the experience of dine out. As a consequence, if all the stimuli regarding the experience lived in a restaurant are positive, the expected behavior of the consumer is to recommend others or positive word-of-mouth intention (response).
Quality of the food (QF)
Quality of the food (QF) is considered as a very important dimension regarding the quality of a restaurant (Ha and Jang, 2010). Mattila (2002) reported QF as the most important attribute in a restaurant as a key predictor of customer loyalty and attitude that is closely related to word-of-mouth behavior. Even though there is no standard definition for this construct, Namkun and Jang (2007) refer to the visual presentation, variety in the menu, offer of healthy options, the taste of the food, freshness, and adequate temperature as items relevant to this construct. Recent studies regard food quality as the most significant dimension influencing a customer’s selection process and quality perception (Serhan and Serhan, 2019; Singh et al., 2021) Accordingly, the following hypothesis is stated:
H1: Quality of the food has a positive and direct relation to word-of-mouth intention.
Personal interaction quality (PIQ)
Most hospitality researchers recognize personal interaction quality (PIQ) as an important component of relational marketing. In their research, Harkey & Egan (2006) found that personal interaction between seller and buyer is a central part in relation marketing, thus in the experience regarding any service creating preference and loyalty among customers (Scanlan & Mcphail, 2000). The staff in a restaurant is the frontline and service face of the business. In this sense, it is suggested that the interaction of the personnel of any service business may be an important stimulus, therefore, in the context of the restaurant industry, it aims to be an important variable related to the dining experience; consequently, the following hypothesis is stated:
H2: Personal interaction quality has a positive and direct relation to word-of-mouth intention.
Physical environment quality (PEQ)
The importance of creating and maintaining a differentiated atmosphere has been in the area of interest of researchers in the hospitality industry, as it is considered a key factor in the satisfaction of current customers and the attraction of new ones. (Ha & Jang, 2012). Other authors (Jalilvand et al., 2017) affirm that the act of dining out is more than just eating, and clients do not want to feel like they were at home. Hence, tangible aspects are important elements in order to create memorable experiences. It is expected that all aspects referring to this concept may be perceived as an important stimulus by customers; therefore, the following hypothesis is proposed for this research:
H3: Physical environment quality has a positive and direct relation to word-of-mouth intention.
Perceived value (PV)
Parsa et al. (2005) state that successful restaurant owners describe their business beyond food characteristics; the description aims to whole concepts that are finally known as a value proposition offers. Sweeney & Soutar’s (2001) argument that value creation is a highly aware concept in industry that is considered by many as the key success factor in long-term relationships. Perceived value is described by Ryu et al. (2007) as a tradeoff between the expected quality by the customer and the willingness to pay for it. In the framework of the stimulus organism response model, it is expected that this assessment is significant for the whole experience, so for that reason, the following hypothesis is stated:
H4: Perceived value has a positive and direct relation to word-of-mouth intention.
Net promoter score, customer satisfaction, and word-of-mouth
Net promoter score (NPS) is one of the most common metrics used in most industries to measure customer satisfaction (CS). This indicator is broadly known for its practicality, it operates with one single question which is: “From 0 to 10, how likely are you to recommend X business with your friends and family?”. (Reichheld, 2003). As customers answer this scale, they are clustered into 3 categories: the ones answering 9 and 10 are considered as promoters, the ones answering 7-8 are considered as passives and finally the ones answering from 0 to 6 are considered as detractors. Finally, to get the NPS, the percentage of promoters subtract the percentage of the detractors to get a number that can vary from -100 to 100.
Even though the NPS question aims to know the willingness to recommend with family and friends (that sounds related to WOM), many authors have criticized this measurement (Keiningham et al., 2007; Pollack and Alexandrov, 2013 ; Zaki et al., 2016) , the main argument is that most complex constructs such as satisfaction and/or WOM may be multidimensional and not unidimensional as NPS proposed. Reich-López et al. (2021) also found evidence that the clustering proposed by its author is not quite accurate either, making the argument that a customer that has scored a 6 has a different level of satisfaction that the ones scoring 0.
In this sense, literature aims to relate the NPS as a measure of CS which is an attitude instead of WOM which is considered a behavior, hence we proceed using WOM instead of NPS for this research. WOM is defined as a kind of communication about products or services between persons that are perceived as independent from the companies, and for that reason, WOM is a very powerful and trusted source of information in the purchase decision process (Silverman, 2001). In the restaurant industry, positive WOM communication can be considered a critical success factor (Tripathi and Dave, 2016) due to the sensation of uncertainty associated with the lack of information while choosing options. (Ladhari et al., 2008). This variable has also been studied as a behavioral outcome of customer’s identity with an organization (Segota et al., 2021).
Because of the structure of the industry in Mexico, where most players are micro-businesses, it is suggested that most restauranteurs do not have big budgets for marketing initiatives; thus, WOM is an interesting and important effect to understand to increase the success rate in this field.
Methodology
The design for this research is cross-sectional with an exploratory approach, supported by quantitative empirical evidence. The tool for information recollection was a self-administrated survey. The statistical methodology to get the hypothesis results was partial least squares structural equation modelling (PLS-SEM). Common method variance was also assessed in order to avoid potential spurious relationships.
Survey design
A self-administrated instrument with validated scales from previous studies and also validated by experts in order to get an accurate translation to Spanish and the best use in the Mexican context was used. The responses for the constructs were all performed by a 5 Smiley Face Likert scale. According to Emde and Fuchs (2012), smileys help people to answer the instrument, achieving a better experience. Toepoel et al. (2019) also affirm that these scales will be more frequently used in the industry.
Table 2 Research instrument: all variables measured in a 5-point Likert scale.
| Variable | Items |
|---|---|
| Quality of the food (QF). Adapted from Namkung and Jang (2007) | QF1 Is food presentation visually attractive? |
| QF2 Does the restaurant offer a variety of menu items? | |
| QF3 Does the restaurant offer healthy options? | |
| QF4 Does the restaurant offer tasty food? | |
| QF5 Does the restaurant offer fresh food? | |
| QF6 Is food served at the appropriate temperature? | |
| QF7 Do you like the food served in this restaurant? | |
| Personal interaction quality (PIQ). Adapted from Vesel and Zabkar (2009) | PIQ1 Would you say that the staff served you in an excellent way? |
| PIQ2 Would you say that the staff is kind? | |
| PIQ3 Would you say that the staff served you in a reasonable time? | |
| PIQ4 Would you say that the interaction with the staff is appropriate? | |
| Physical environment Quality (PEQ). Adapted from Meng and Elliot (2008) | PEQ1 Is the restaurant physically attractive? |
| PEQ2 Does the restaurant have an appropriate parking space? | |
| PEQ3 Is the restaurant interior comfortable? | |
| PEQ4 Does the restaurant have an appropriate atmosphere? | |
| PEQ5 Does the restaurant have a visually attractive building exterior? | |
| PEQ6 Is the restaurant interior visually attractive? | |
| PEQ7 Does the restaurant have appropriate music to maintain its atmosphere? | |
| PEQ8 Does the restaurant have appropriate lighting to maintain its atmosphere? | |
| PEQ9 Is the restaurant equipped in an appropriate way? | |
| PEQ10 Is the restaurant clean? | |
| Perceived Value (PV). Adapted from Chen (2012) | PV1 This restaurant offered good value for money. |
| PV2 I would think that the prices that I pay for the services of this restaurant are worthwhile. | |
| PV3 I would rate my overall experience at this restaurant “extremely good value.” | |
| Word-of-mouth (WOM). Adapted from Jalilvand et al. (2012) | WOM1 I say positive things about the restaurant to other people. |
| WOM2 I recommend the restaurant to someone who seeks your advice. | |
| WOM3 I encourage friends and relatives to refer the restaurant. | |
| Demographics | Gender |
| City where resides | |
| Age | |
| Last restaurant that is recalled |
Sampling
In order to reach representativeness in the state of Nuevo Leon, two factors were considered: The first criteria were to choose cities in the state that have above 100 economic units of full-service type restaurants according to DENUES1 database. The second criteria were to select cities in the state that have above 100,000 inhabitants. The cities under those conditions are: Apodaca, Escobedo, Guadalupe, Monterrey, San Nicolas de los Garza, San Pedro Garza Garcia and Santa Catarina; all these cities represent 3,664,659 habitants, which is about 70% of the total population in the state. Once the population size was known under the previous criteria, the sample size was calculated conducive to established quotas, so all cities meeting criteria in the state could be represented accordingly.
The final sampling got 460 valid responses. All cities reached the minimum number of cases according to the sample plan, as could be appreciated in the following table:
Table 3 Sampling plan and actual sample
| City | Population | Proportion | Sample plan | Actual sample |
|---|---|---|---|---|
| Apodaca | 597,207 | 16.30% | 63 | 64 |
| Escobedo | 425,148 | 11.60% | 45 | 46 |
| Guadalupe | 682,880 | 18.63% | 72 | 74 |
| Monterrey | 1,109,171 | 30.27% | 116 | 140 |
| San Nicolas de los Garza | 430,143 | 11.74% | 45 | 55 |
| San Pedro Garza García | 123,156 | 3.36% | 13 | 18 |
| Santa Catarina | 296,954 | 8.10% | 31 | 39 |
| Other cities in Nuevo Leon | N/A | 0.00% | 0 | 24 |
| TOTAL ZMM | 3,664,659 | 100.00% | 385 | 460 |
Source: Authors.
Data collection
The data collection for this research was conducted in February 2020, asking the respondents to answer the questionnaire according to their last experience in a full-service restaurant. The method of distribution was online, using Kindorse Surveys software. A convenience non-probabilistic approach was used. Finally, in order to consider valid cases, the next criteria were followed: the respondent must be an inhabitant of the state of Nuevo Leon, the restaurant for which they answered must have full-service restaurant characteristics and finally, the responses that seem to have repetitive patrons were also deleted in order to avoid a biased response (Paulhus, 1991).
Results
Descriptive statistics
The sample consisted of 220 male respondents (47.83%) and 240 female respondents (52.17%). There were participants in all groups of age; however, the highest number of respondents corresponded to 31-35 years with 131 participants (28.48%), followed by the group from 25-30 years with 88 responses (19.13%). Regarding education, 32 participants stated that their last finished scholar degree was high school (6.99%), 267 had an undergraduate degree (58.08%), 129 had a master’s degree (27.95%), and finally, 32 reported to have a Doctorate degree (6.99%). (Table 4).
Table 4 Demographic characteristics of respondents
| Demographic | Percentage | Frequency |
|---|---|---|
| Gender | ||
| Male | 47.83% | 220 |
| Female | 52.17% | 240 |
| Age | ||
| Under 20 | 1.96% | 9 |
| 21-25 | 9.78% | 45 |
| 25-30 | 19.13% | 88 |
| 31-35 | 28.48% | 131 |
| 36-40 | 16.30% | 75 |
| 41-45 | 7.61% | 35 |
| 46-50 | 6.30% | 29 |
| 51-55 | 3.70% | 17 |
| 56-60 | 3.26% | 15 |
| 61-65 | 1.96% | 9 |
| 66 and above | 1.52% | 7 |
| Education | ||
| No degree earned | 0.00% | 0 |
| High school | 6.99% | 32 |
| Undergraduate | 58.08% | 267 |
| Master’s degree | 27.95% | 129 |
| Doctorate degree | 6.99% | 32 |
| Sample size | 100% | 460 |
Source: Authors.
Common method variance
An important factor to bear in mind is the common method variance (CMV), as the nature of data is self-reported. Thus, this factor combined with some others may result in this kind of bias (Podsakoff et al., 2003), resulting in potential spurious relations. In order to assess this threat, Harman’s single-factor approach was used (Harman, 1976). Principal component analysis (PCA) with varimax rotation was performed on the data, resulting in 4 factors with an eigenvalue greater than 1 (F1:10.72; F2:2.63; F3:1.508; F4:1.002), yielding 66.11% of the total variance with the first factor representing only 23.62% of the total variance; thus, the evidence shows that CMV may not be a limitation for this paper.
Structural equation modeling
The method used for this research is partial least square equation modelling (PLS-SEM) performed by PLS-Smart software. This technique is frequently used in social science research, as in many cases, the data will not suit a normal distribution assumption for the use of other parametric techniques, such as linear regression. PLS-SEM allows testing an hypothesis with other resources, such as bootstrapping, in order to overcome this limitation on the data (Taheri et al., 2020).
Measurement model
Convergent validity or reflective constructs were assessed using Cronbach’s alpha, average variance extracted (AVE), composite reliability (CR) and factor loading. The suggested thresholds for the Cronbach’s alpha and CR are values above 0.7, while for AVE, it’s above 0.5. The suggested value for item factor loading is above 0.6, so for that reason, only one item (PEQ2) did not load as recommended by Hair et al. (2010). However, while running the model keeping this item, it did not seem to be an important constraint for the overall model. (see Table 4).
Table 4 Internal reliability and measurement model
| Construct | Load | Cronbach's ⍺ | AVE | CR |
|---|---|---|---|---|
| Quality of the food (QF) | 0.868 | 0.565 | 0.899 | |
| QF1 | 0.608 | |||
| QF2 | 0.675 | |||
| QF3 | 0.636 | |||
| QF4 | 0.883 | |||
| QF5 | 0.787 | |||
| QF6 | 0.779 | |||
| QF7 | 0.847 | |||
| Personal interaction quality (PIQ) | 0.912 | 0.79 | 0.938 | |
| PIQ1 | 0.899 | |||
| PIQ2 | 0.890 | |||
| PIQ3 | 0.896 | |||
| PIQ4 | 0.868 | |||
| Physical environment quality (PEQ) | 0.914 | 0.565 | 0.927 | |
| PEQ1 | 0.814 | |||
| PEQ2 | 0.444 | |||
| PEQ3 | 0.776 | |||
| PEQ4 | 0.722 | |||
| PEQ5 | 0.749 | |||
| PEQ6 | 0.831 | |||
| PEQ7 | 0.670 | |||
| PEQ8 | 0.786 | |||
| PEQ9 | 0.818 | |||
| PEQ10 | 0.824 | |||
| Perceived Value (PV) | 0.839 | 0.756 | 0.903 | |
| PV1 | 0.870 | |||
| PV2 | 0.896 | |||
| PV3 | 0.842 | |||
| Word-of-mouth (WOM) | 0.812 | 0.728 | 0.889 | |
| WOM1 | 0.882 | |||
| WOM2 | 0.774 | |||
| WOM3 | 0.897 |
Source: PLS-SMART outcomes
Model fit
The measurement model returned a good model fit. (Chi Square 562.65, SRMR 0.074, and NFI 0.905). The recommended threshold for SRMR are values from 0.05 to 0.08. In this case, the obtained measure for the model was 0.074; regarding NFI, the recommended value is above 0.9, and the measure obtained was 0.905 NFI. Therefore, there is enough evidence to determine that the model has an adequate fit (Hair et al., 2010).
Table 5 Model fit index
| Statistic | Value | Threshold |
|---|---|---|
| SRMR | 0.074 | Values from 0.05 and 0.08 |
| NFI | 0.905 | Value > 0.9 |
Source: Fornell and Larcker (1981).
The discriminant validity was also supported since the AVE value of the study constructs was greater than the corresponding values of average shared variance (ASV) and maximum shared variance (MSV) (Fornell and Larcker, 1981). The correlation coefficients among study variables were also less than the square root of the AVE (Table 6).
Table 6 Discriminant validity
| 1 | 2 | 3 | 4 | 5 | |
|---|---|---|---|---|---|
| 1.- Quality of the food (QF) | 0.752 | ||||
| 2.- Personal interaction quality (PIQ) | 0.609 | 0.889 | |||
| 3.- Physical environment quality (PEQ) | 0.569 | 0.457 | 0.752 | ||
| 4.- Perceived value (PV) | 0.671 | 0.552 | 0.389 | 0.870 | |
| 5.- Word-of-mouth (WOM) | 0.741 | 0.655 | 0.493 | 0.744 | 0.853 |
Source: PLS-SMART outcomes
Collinearity was also assessed using variance inflation factor (VIF) getting acceptable results, as construct values were in range of recommended values < 3 (Hair et al., 2016), as shown in Table 7.
Hypothesis support
The structural path significance was generated through PLS-Smart’s Bootstrapping algorithm. In this procedure, a large number of subsamples (5,000 in this case) are taken from the original sample with replacement to give bootstrap standard errors, which, in turn, gives approximate T-values for significance testing of the structural path in a 95% confidence interval (CI). The bootstrap result approximates the normality of data (Wong, 2013).
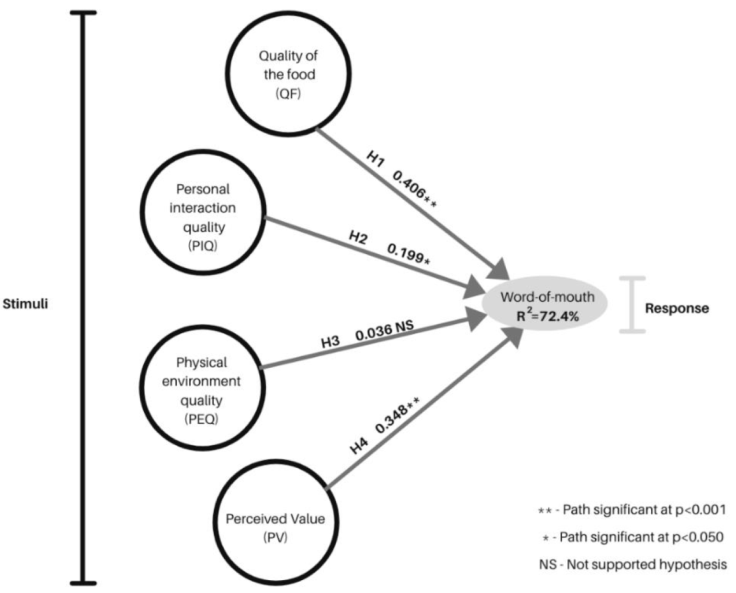
Regarding hypothesis testing. H1 suggested that quality of the food (QF) has a positive and direct relation to word-of-mouth intention (WOM), which was supported (β=0.406; t=3.849; p<0.000). H2 suggested that personal interaction quality (PIQ) has a positive and direct relation to word-of-mouth intention (WOM), supported (β=0.199; t=2.169; p<0.050). H3 suggested that physical environment quality (PEQ) has a positive and direct relation to word-of-mouth intention WOM), not supported (β=0.036; t=0.471; p<0.638). Lastly, H4 suggested that perceived value (PV) has a positive and direct relation to word-of-mouth intention (WOM) result that was also supported (β=0.348; t=3.694; p<0.000). The dependent variable word-of-mouth intention obtained an explained variance of R 2 = 72.4%. Table 8 shows a summary of results, and Figure 2 shows the conceptual framework with betas.
Table 8 Summary of structural results
| Hypothesis | Effect | T-statistic | P-Value | Result |
|---|---|---|---|---|
| H1 | QF ---> WOM | 3.849 | 0.000 | Supported |
| H2 | PIC ---> WOM | 2.169 | 0.030 | Supported |
| H3 | PEQ ---> WOM | 0.471 | 0.638 | Not supported |
| H4 | PV ---> WOM | 3.694 | 0.000 | Supported |
Source: PLS-SMART outcomes
Discussion
The findings in this research support that not all stimuli are significant for the desired response word-of-mouth, at least in the context of full-service restaurants in Monterrey’s metropolitan area. As the stimulus-organism-response (SOR) framework suggests, the influence of external stimuli will affect the internal state of the people (Mehrabian & Russell, 1974), having as a consequence, some expected behavior.
On the other hand, it is broadly known that a very important factor in the restaurant industry that has implications in customer behavior (or response) is the quality of the food (QF). The findings in this study confirm the results of other authors who have suggested similar hypotheses in different contexts (Jalilvand et al., 2017), testing behaviors that antecedent WOM, such as satisfaction. The empirical evidence shows that QF is the most influential factor of the variable tested in this research that directly influences word-of-mouth intention in the full-service restaurant context.
Personal interaction quality (PIQ) appears to be an important stimulus that influences consumer behavior, as this research finds it statistically significant to WOM. This result seems to be in line with the findings of Gómez-Suárez and Veloso (2020), who link the performance of staff with brand experience (BE). BE was tested as a variable that relates to WOM in their research.
The result not supported was the hypothesis regarding physical environment quality (PEQ), suggesting relations with WOM. Ryu et al. (2012) tested this variable, finding it significant for the perception of the restaurant image and not significant for customer perceived value (PV). Even though relations with restaurant image were significant, it did not show evidence to act as a predictor of customer satisfaction, which has been discussed to be a mediating variable of WOM, however evidence shows that PEQ does not seems to predict in a direct effect the variable WOM. On the other hand, Ha and Jang (2010) found relations between atmospherics (created by physical environment) as a moderate variable that impacts customer satisfaction, in this sense, the lecture regarding these reference is that PEQ may be a predictor of CS that is a mediator to WOM, however it does not have a direct effect on WOM at least in the full-service restaurant segment in the north of Mexico. In the same line, the investigation of Hanaysha and Pech (2018) found that the physical environment has a significant positive effect on brand prestige and also in WOM, although their research was done in a fast-food service context. Hence, the results of this study may be influenced by the type of restaurant that has been bounded, which is full-service, and also some other variables that may differ from previous studies, like the influence of Mexican culture.
Perceived value (PV) resulted in a statistically significant variable impacting the WOM intention. This result is consistent with the research of Konuk (2019), who tested the mediating effects of the variable with customer satisfaction and return intentions. Both behaviors were significant, and both have been related to WOM in the hospitality literature.
These findings have important managerial implications for restauranteurs since budgets tend to be limited, especially in independent restaurants that seem to be the most cases in Mexico. Important insights are that for full-service restaurant customers, it appears that the physical environment is not as important as the quality of the food (QF), the perceived value (PV), which is the assessment of what it is received and what is paid, and the personal interaction quality (PIQ), in that hierarchy or order, suggesting a guideline of allocation in the resources for what really matters.
Conclusions
The restaurant industry is a key player in the economy of Mexico; however, evidence from other countries shows that it is also a sector that has a high rate of bankruptcy, especially those business that are independently managed, which seems to be the kind of restaurants that have about 99% of presence in Mexico. Authors imply that a key factor for the success of these kinds of businesses relies on WOM;. Therefore, the importance of understanding what generates this behavior, in that fashion, the stimuli-organism-response framework was the approach for this research, suggesting that the variables: quality of the food (QF), personal interaction quality (PIQ), physical environment quality (PEQ) and perceived value (PV) worked as stimuli, which will generate WOM as a response.
The evidence showed that QF, PIQ and PV are variables that have a direct effect on the WOM intention; in this context, PEQ was not significant; therefore, interesting future research may imply the use of psychological variables, such as brand loyalty or social currency to contrast the influence with the physical ones that this research suggests. The use of mediating variables that relate to WOM in the hospitality literature, such as customer satisfaction and/or return intention, may enrich these findings. It is a fact that WOM have taken an important variation in the internet known as E-WOM, this phenomena should also be consider for future research to complement what we already know about face-to-face WOM and consumer behavior. Finally, the use of different theoretical frameworks may enhance the literature and complement the SOR approach that was used in the present paper.
This research presented some limitations that are acknowledged. The sampling was not done in the field. Related to this topic, the chosen sampling method was convenience, which is a non-probabilistic method; hence, results may not be representing the population in total accuracy.

