


Services on Demand
Journal

Article
 text in
  English (pdf)
 Article in xml format
 Article references
 Send this article by e-mail
Indicators
 Cited by SciELO
 Related links
 Similars in
SciELO
Similars in
SciELO Share

 Permalink
Contaduría y administración
Print version ISSN 0186-1042
Contad. Adm vol.65 n.1 Ciudad de México Jan./Mar. 2020 Epub Apr 24, 2020
https://doi.org/10.22201/fca.24488410e.2019.1569
Articles
Critique on the psychometric properties of a measurement scale for psychosocial risk factors proposed in NOM1 035 of the STPS2 in Mexico3
1Universidad Nacional Autónoma de México, México
2Psicología, Investigación, Medición y Editorial, México
The purpose of this study was to show in a critical and proactive way the psychometric properties of the “Psychosocial Risk Factors Identification and Organizational Environment Scale” proposed by STPS (2017), for more than 50 employees of NOM 035 (GRIII), with a sample of workers stratified by gender from Mexico City and the interior of the republic of a service company (n=114). The study consisted in first obtaining indicators of central tendency and dispersion of the questionnaire per item, as well as its reliability of Cronbach (between 67% and 93%); Confirmatory factorial analyzes (CFA) with structural equations (IBM-AMOS) were carried out for purposes of validity; And finally, Pearson correlations and One Way variance analysis were performed to know some relationships. The results showed that the STPS instrument has very good reliability, however, the CFA did not show properties of validity for adjustments and qualification, reason why it is recommended to Secretary of Labor (STPS) consider for other studies to do discrimination of items, to add some items, to increase the sample 10 subjects per item, analyze also by main components and with second order factorials, among others. Relationships between gender, job hierarchy and marital status were observed with some specific domains.
The contribution of this study is important for the dissemination of NOM 035 by the Secretary of Labor, the reliable use of the questionnaire by companies, unions and for academic research, as well as for diagnostic, evaluation and intervention purposes, based on knowledge of psychosocial risk factors studied.
Keywords: Psychosocial risk; Psychosocial factors; NOM 035; Mexican labor standards; Psychometry
JEL Code: J81
El propósito de este estudio fue mostrar en forma crítica y propositiva las propiedades psicométricas de la escala de “Identificación de los factores de riesgo psicosocial y evaluación del entorno organizacional” propuesta por la STPS (2018) para más de 50 trabajadores de la NOM 035 con una muestra de trabajadores estratificada por género de la Ciudad de México y del interior de la república de una empresa de servicios (n=114). El estudio consistió primero, en obtener indicadores de tendencia central y de dispersión del cuestionario por reactivo, así como su fiabilidad de Cronbach (entre .67 y .93); posteriormente se llevaron a cabo análisis factoriales confirmatorios (AFC) con ecuaciones estructurales (IBM-AMOS) para validez; y finalmente, se realizaron correlaciones Pearson y análisis de varianza One Way para conocer algunas relaciones de manera descriptiva. Los resultados mostraron que el instrumento de la STPS cuenta con muy buena confiabilidad, sin embargo, los AFC no mostraron propiedades de validez para ajustes y calificación, por lo que se recomienda a la STPS considerar para futuros estudios las siguientes recomendaciones: hacer discriminación de reactivos, agregar algunos ítems, incrementar la muestra a 10 sujetos por ítem, analizar también por componentes principales y con factoriales de segundo orden, entre otros. Se observaron relaciones entre género, jerarquía de puesto y estado civil con algunos dominios específicos. La contribución de este estudio es importante para la difusión de la NOM 035 por parte de la STPS, el uso confiable del cuestionario por parte de empresas, sindicatos y para investigación académica, así como para fines de diagnóstico, evaluación e intervención a partir del conocimiento de los factores de riesgo psicosocial estudiados.
Palabras clave: Riesgo psicosocial; Factores psicosociales; NOM 035; Normatividad laboral mexicana; Psicometría
Código JEL: J81
Introduction
According to Ghai (2003), the International Labour Organization (ILO) has created the globally recognized concept of “decent work” (dignified), which presupposes that all rich and prosperous countries, as well as aspiring countries, must take care of at least the following eight recommendations for decent work to be considered present in a country: possibility of employment, remunerative employment, dignified working conditions that consider safety and health, social security, respect for universal human rights, non-discrimination at work, freedom of association and social dialogue. Moreno (2011) states that human work has paradoxical effects; on the one hand, it is a means of subsistence and happiness; on the other, it can cause physical and mental harm. Historically, the threat to wellbeing has focused on physical, chemical, biological, and environmental risks, which can cause work-related illnesses or injuries; nevertheless, not a lot of attention has been paid to psychosocial risks (see Ley Federal del Trabajo(LFT), 2012).
Occupational and environmental medicine are putting a lot of effort in diagnosing, treating, and preventing work-related illnesses and accidents through practice, research, and the intervention of ergonomics (engineering) and occupational medicine related to physical health, injuries, and illnesses, as well as through individual and collective treatment and prevention programs concerning physical, environmental, and mental health (Ladou and Harrisson, 2015; Márquez and Zambrano, 2013; Osca, López-Araujo, Bardera, Urien, Diez, and Rubio, 2014). However, from a medical and engineering standpoint, it is not easy to identify the psychosocial aspects and processes that interact between workers and organizations, which include spheres of the work-person relationship in a psychological concept that affect the person, the organization, and the productivity of all the economic actors; it is here that, according to some authors, work psychology has begun to play a transcendental role (Fernández-Prada, González-Cabrera, Iribar-Ibabe, and Peinado, 2013; Gil-Monte, 2014; Uribe-Prado, López, Pérez, and García, 2014; Uribe-Prado, 2015; Uribe-Prado, 2016). In 1984, the ILO alongside the World Health Organization (WHO) announced the emergence of psychosocial factors-the product of the new industrial working conditions and of social changes taking place in the 20th and 21st centuries-as negative effects on health with psychosocial origin. The ILO/WHO (1984) defined the psychosocial factors at work as “[…] the collection of perceptions and experiences of the worker, comprising different and various aspects. Some of these refer to the worker individually, while others are linked to the working conditions and environment, and others refer to the influences foreign to the workplace that nevertheless affect it”.
International organizations such as the ILO, WHO, the European Agency for Safety and Health at Work (EASHW), the Organization for Economic Cooperation and Development (OECD), etc., place the psychosocial aspects as one of the 10 global priorities with growing concern, given that psychosocial factors and stress generate effects on health such as negative lifestyles, musculoskeletal disorders, metabolic disorders, cardiovascular issues, as well as physical and mental problems (Dollard, Skinner, Tucker, and Bailey, 2007; Leka, Nora, Stage, Barlow, and King, 2010; Pereyra, Milei, and Stefani, 2011). According to Juárez-García (2015), developed countries are ahead by around 20 to 40 years with regard to these topics, such as in the case of Europe and the United States where the so-called psychosocial risks have been evaluated through questionnaires or multifactor psychometric scales similar to those used to evaluate psychological attributes, although it must be made clear that psychosocial risks measure the environment, whereas psychological attributes measure the individuals (Kerlinger, 2002). Latin America has had progress in lawful order (standards, laws, and regulations) and, in some cases, there has also been academic research through the development or adaptation of standardized questionnaires with reliability and validity for different populations, for use both in practice and in research in countries such as Colombia, Peru, and Chile, who have worked at least the last 10 years. Nevertheless, Mexico is following a similar objective but with a different history, as some academic research has been carried out but almost nothing with regard to standards and laws that concern psychosocial factors (Alcántara and Hernández, 2005; Gómez, Segura, Castrillón, and Perilla, 2016).
According to González, Juárez, Camacho, Noriega, and Escobedo (cited in Juárez, 2015) and according with the general proposal of the ILO/WHO (1984), work stress and its consequences is the focal point of interest to understand the psychosocial risk factors for their repercussions in both health and productivity. It is in this context that the Demand/Control model of Karasek and Theorel (1990) has contributed the most significantly to the understanding of the mechanisms of stressful affectation and that explains the negative or positive effects of the work demands and the control the worker has on these. This model proposes that psychological demands and work control predict the risk on health through the combination of quadrants (see Figure 1).

In Mexico, for the first time in many years, the evaluation of psychosocial risk factors is being proposed by the State (STPS), which is one of the most important and transcendental advancements in recent years concerning the wellbeing of the workers from an official scope. Nevertheless, these are just the first steps; there is still the implementation, development, and transformation of the concept of decent work through actions related to the understanding, analysis, and intervention on the psychosocial factors. On November 13th, 2014, the STPS published in the Official Journal of the Federation the Law of Occupational Safety and Health (LSST,2014), approved in June 2013, which includes innovating concepts such as favorable organizational environment, psychosocial risk factors, and occupational violence, among others, unquestionably alluding to the psychosocial factors proposed by the ILO for more than 30 years ago. According to Juárez-García (2015) there are instruments developed in other countries (USA, Colombia, European Economic Community (Spain, Norway, Italy), Chile, Canada, among others) that have adapted different instruments, such as Copenhague, MBI, and STAI, to their specific countries through broad standardizations, probably with satisfactory results. However, the quality and/or adaptations of said instruments are not useful for other countries, such as Mexico, due to a lack of analysis, critique, and psychometric standardizations as those proposed in this study, which will serve as reference for the adaptation or development of questionnaires made with the population of each country in mind. Given the aforementioned and as an important first step, the STPS developed the Official Mexican Standard project called “Identification and prevention of psychosocial risk factors” (PROYNOM-035-STPS-2016, October 26th, 2016), which establishes that psychosocial risk factors demand governmental commitment to strengthen occupational safety and health in order to achieve dignified or decent work through policies, strategic lines of action, and projects with a preventive approach, in order for work centers with safe and healthy conditions to prevail (STPS, 2017). In both the Law of Occupational Safety and Health (LSST, 2014) and the NOM 035 it is established to identify the psychosocial risk factors and to evaluate the psychosocial environment for diagnosis using three instruments intended to be the decision-making mechanisms: the first is for evaluating companies of up to 50 workers (GRII); the second, for companies with more than 50 workers (GRIII); and the third is an instrument provided to identify workers who were subjected to severe traumatic events (GRI)4.
There is evidence worldwide that many health and productivity problems are related to mental health problems; among them are phenomena such as: stress, fatigue, workload, disabilities due to psychological disorders (phobias, compulsions, etc.), neurological, psychiatric, and psychosomatic illnesses (pain, sleep disorders, depression, gastrointestinal disorders, anxiety, fibromyalgia, etc.), absenteeism, addictions such as smoking, alcoholism, and other drugs, bad working environment, leadership problems, dissatisfaction, burnout, mobbing, lack of organizational commitment, etc., that when they are considered related to productivity, familial, social, and labor interpersonal relationships, and with the working environment, they become psychosocial risks at work. Their impact can be reflected in decreased health, unemployment, bad quality of life, legal claims, and many productivity problems (Alcántara and Hernández, 2005; Calderón, Serna, and Zuluaga, 2013; Garrido-Pinzón, Uribe-Rodríguez, and Blanch, 2011; Gil-Monte, 2014; Juárez-García, 2007; Juárez-García, 2015; Salanova, Llorens, and Schaufeli, 2011; Uribe-Prado, 2008; Uribe-Prado, 2015; Uribe-Prado, 2016).
The evaluation or diagnostic would be done using data collection tools or psychological instruments, completed in a psychology discipline called “psychometry”, which quantifies psychosocial characteristics in an objective manner usually through questionnaires, scales, or tests. The central concepts that show the psychometric properties are reliability, validity, and standardization. An instrument is reliable if the measurement is free of errors, accurate, and stable; and it is valid if the measurement truly provides what is being measured. Standardization is provided through qualification ranges adequate for a determinate sample or population, allowing to comprise ideal demographic classification profiles with regard to what is being measured (Kerlinger, 2002; Muñiz, 2006; Nunnally and Bernstein, 1995).
The GRIII instrument proposed by the STPS in NOM 035 proposes a questionnaire with the following characteristics: (see Table 1)
Table 1 GRIII Questionnaire by categories, domains, and dimensions
| CATEGORY | DOMAIN | DIMENSION | Items | New name | |
| (-; 4 al 0) (+; 0 al 4) |
proposed for some Domains |
||||
| 1. Work environment | 1. Conditions of the work environment | F1 | Dangerous and unsafe conditions | -1,3 | Adverse work environment conditions |
| F2 | Deficient and unhealthy conditions | 2,-4 | |||
| F3 | Dangerous tasks | 5 | |||
| 2. Activity-specific factors | 2. Workload | F4 | Quantitative loads | 6,12 | |
| √ | |||||
| F5 | Accelerated work paces | 7,8 | |||
| F6 | Mental load | 9,10,11 | |||
| F7 | Emotional psychological loads | 65,66,67, 68 | |||
| F8 | High responsibility loads | 13,14 | |||
| F9 | Contradictory and inconsis- tent loads | 15,16 | |||
| 3. Lack of control over | F10 | Lack of control and auto- | -25,-26,-27, | √ | |
| the work | nomy over the work | -28 | |||
| F11 | Limited or null possibility for growth | -23,-24 | |||
| F12 | Insufficient participation and change management | 29,-30 | |||
| F13 | Limited or inexistent training | -35,-36 | |||
| 3. Organization of working hours | 4. Working hours | F14 | Extensive work hours | 17,18 | Extensive work hours |
| 5. Interference in work-family relation | F15 | Work influence outside the workplace | 19,20 | √ | |
| F16 | Influence of familial responsibilities | 21,22 | |||
| 4. Leadership and | 6. Leadership | F17 | Lack of clarity on functions | -31,-32,-33, | Lack of leadership |
| work relationships | -34 | ||||
| F18 | Leadership characteristics | -37,-38,-39, | |||
| -40,-41 | |||||
| 7. Work relationships | F19 | Social relationships at work | -42,-43,-44, -45,-46 | Adverse relation- ships at work | |
| F20 | Deficient relationship with the colleagues being supervised | 69,70,71,72 | |||
| 8. Mobbing | F21 | Mobbing | -57,58, 59,60, 61,62,63 ,64 | √ | |
| 5. Organizational environment | 9. Performance recog- nition | F22 | Scarce or non-existent feed- back on performance | -47,-48 | Scarce performance recognition |
| F23 | Scarce or non-existent recognition and compensation | -49,-50,-51, -52 | |||
| 10. Insufficient sense of belonging, and instability | F24 | Limited sense of belonging | -55,-56 | √ | |
| F25 | Work instability | -53, 54 72 (37+s, 35-s) |
Note: the column of new proposed names is the product of the analysis of the third block corresponding to the discussion and conclusions section.
Source: own elaboration.
As can be observed in Table 1, there are 72 items that comprise 25 dimensions, 10 domains, and 5 categories. The corresponding analyses were carried out considering the 10 domains as factors to confirm to meet factorial requirements in a first approximation as confirmatory factor hypothesis (Byrne, 2010). For reasons not described in the document, the STPS (2017) does not provide psychometric backgrounds of the questionnaires it proposes in NOM 035 to determine psychosocial risk. However, it does impose a series of psychometric requirements for those companies that want to develop their own instruments for validation effects in a contradictory manner (see section 8.4 of NOM 035): make it in national territory, with samples greater than 10 workers per item, Cronbach’s alpha values greater to .7, Spearman values greater to .5, Goodness of Fit Index (GFI) greater to .90, maximum RMSR value of .08, RMSEA below .08, NFI greater to .90, and Chi-square statistic less than or equal to 5, among others. For this research, considerations were made for those that can be obtained in a first confirmatory factor analysis (CFA) model without adjustments. A proposal by the authors of this article to modify the names of some domains can be observed in the last column of Table 2 , due to the fact that the current names do not consider that the designation of “risks” implies negative effects as psychosocial factors, something that is indeed considered in the proposals as it is particularly this adversity towards the health of the worker and the environment that distinguishes them (this is justified in the discussion and conclusions section [Moreno, 2011]). This article also aimed to know some psychometric properties of the “Identification of psychosocial risk factors and evaluation of the organizational environment for more than 50 workers (GRIII)” scale, proposed by the STPS, in order to provide critical information regarding its reliability and validity through confirmatory factors using a sample of Mexican workers of a services company. This was a non-experimental, ex post facto, descriptive, and stratified study considering the constructs of the GRIII questionnaire in terms of categories, domains, and dimensions. The results proposed in the general objective of this study were reached through three specific analysis blocks, described in the results section and broadly analyzed in the discussion and conclusions section; first a descriptive block, then a factor analysis block, and finally a correlation and analysis of variance block. Each block contains a broad description of strengths, weaknesses, and suggestions proposed by the authors of this article.
Table 2 Item description by answer mean, standard error, standard deviation, and variance of the GRIII questionnaire of the STPS for more than 50 workers.
| # | Questionnaire item (n=72) | Item mean | Item standard error | Item standard deviation | Item variance |
| 1 | 1 | .67 | .07 | .81 | .66 |
| 2 | 3 | 1.25 | .10 | 1.12 | 1.27 |
| 3 | 2 | 1.46 | .10 | 1.07 | 1.15 |
| 4 | 4 | 1.31 | .10 | 1.16 | 1.35 |
| 5 | 5 | .78 | .10 | 1.07 | 1.14 |
| 6 | 6 | 2.01 | .10 | 1.15 | 1.32 |
| 7 | 12 | 2.85 | .09 | 1.06 | 1.13 |
| 8 | 7 | 1.81 | .11 | 1.17 | 1.39 |
| 9 | 8 | 1.79 | .11 | 1.18 | 1.40 |
| 10 | 9 | 3.10 | .08 | .88 | .78 |
| 11 | 10 | 2.70 | .09 | 1.05 | 1.11 |
| 12 | 11 | 2.45 | .11 | 1.18 | 1.40 |
| 13 | 65 | 1.42 | .11 | 1.21 | 1.46 |
| 14 | 66 | .82 | .11 | 1.20 | 1.45 |
| 15 | 67 | 1.16 | .11 | 1.26 | 1.60 |
| 16 | 68 | .64 | .09 | 1.02 | 1.04 |
| 17 | 13 | 2.50 | .11 | 1.24 | 1.54 |
| 18 | 14 | 2.71 | .12 | 1.31 | 1.72 |
| 19 | 15 | 1.63 | .10 | 1.10 | 1.22 |
| 20 | 16 | 1.43 | .10 | 1.10 | 1.22 |
| 21 | 25 | 1.50 | .10 | 1.09 | 1.20 |
| 22 | 26 | 1.95 | .12 | 1.28 | 1.65 |
| 23 | 27 | 1.48 | .10 | 1.13 | 1.29 |
| 24 | 28 | 1.71 | .10 | 1.11 | 1.25 |
| 25 | 23 | 1.28 | .08 | .95 | .91 |
| 26 | 24 | 1.86 | .11 | 1.20 | 1.44 |
| 27 | 29 | 1.79 | .09 | .97 | .95 |
| 28 | 30 | 2.11 | .09 | 1.05 | 1.11 |
| 29 | 35 | 1.46 | .11 | 1.19 | 1.41 |
| 30 | 36 | 1.64 | .11 | 1.19 | 1.43 |
| 31 | 17 | 1.61 | .12 | 1.37 | 1.90 |
| 32 | 18 | 1.52 | .11 | 1.23 | 1.52 |
| 33 | 19 | 1.70 | .11 | 1.23 | 1.52 |
| 34 | 20 | 1.47 | .11 | 1.18 | 1.40 |
| 35 | 21 | 1.76 | .09 | 1.03 | 1.26 |
| 36 | 22 | 1.04 | .10 | 1.12 | 1.26 |
| 37 | 31 | 1.24 | .09 | .98 | .96 |
| 38 | 32 | 1.25 | .09 | .98 | .96 |
| 39 | 33 | 1.20 | .08 | .95 | .90 |
| 40 | 34 | 1.32 | .10 | 1.12 | 1.26 |
| 41 | 37 | 1.68 | .11 | 1.18 | 1.47 |
| 42 | 38 | 1.52 | .10 | 1.12 | 1.26 |
| 43 | 39 | 1.52 | .11 | 1.18 | 1.40 |
| 44 | 40 | 1.43 | .11 | 1.22 | 1.50 |
| 45 | 41 | 1.38 | .11 | 1.23 | 1.53 |
| 46 | 42 | 1.64 | .09 | 1.01 | 1.02 |
| 47 | 43 | 1.22 | .08 | .95 | .92 |
| 48 | 44 | 1.17 | .09 | 1.01 | 1.03 |
| 49 | 45 | 1.21 | .09 | .99 | .98 |
| 50 | 46 | 1.38 | .10 | 1.10 | 1.21 |
| 51 | 69 | .82 | .10 | 1.11 | 1.23 |
| 52 | 70 | .82 | .09 | 1.05 | 1.10 |
| 53 | 71 | .85 | .10 | 1.11 | 1.24 |
| 54 | 72 | .86 | .10 | 1.13 | 1.29 |
| 55 | 57 | 1.35 | .10 | 1.08 | 1.17 |
| 56 | 58 | 1.45 | .10 | 1.15 | 1.33 |
| 57 | 59 | .77 | .09 | 1.02 | 1.04 |
| 58 | 60 | .89 | .09 | 1.03 | 1.06 |
| 59 | 61 | .99 | .10 | 1.16 | 1.35 |
| 60 | 62 | 1.04 | .10 | 1.12 | 1.26 |
| 61 | 63 | .92 | .10 | 1.09 | 1.18 |
| 62 | 64 | .76 | .10 | 1.12 | 1.26 |
| 63 | 47 | 1.50 | .10 | 1.11 | 1.24 |
| 64 | 48 | 1.51 | .09 | 1.06 | 1.13 |
| 65 | 49 | .68 | .09 | 1.02 | 1.05 |
| 66 | 50 | 1.42 | .10 | 1.13 | 1.29 |
| 67 | 51 | 1.99 | .11 | 1.23 | 1.51 |
| 68 | 52 | 1.61 | .11 | 1.20 | 1.44 |
| 69 | 55 | 1.30 | .10 | 1.12 | 1.27 |
| 70 | 56 | .83 | .09 | .96 | .93 |
| 71 | 53 | 1.35 | .10 | 1.12 | 1.27 |
| 72 | 54 | 2.07 | .10 | 1.11 | 1.23 |
Source: own elaboration
Method
Sample . 114 workers of a services company with a total population of N=160 workers participated in a sample (n) stratified by gender, based on the equation proposed by the STPS (2017).
Of the participants, 51.8% were female and 48.2% were male; the average age was of 29.31 years with a standard deviation of 8.66; 46.5% carried out operational jobs, while 51.8% were in supervision or managerial (mid-range) jobs, and 1.8% were executives; 77.2% were single and 22.8% had a partner (married or cohabiting); 63.2% had an indefinite time contract, 15.8% had a definite time contract, 4.4% were hired on a fee basis, 11.4% were hired through an outsourcing company, and 5.3% did not answer; regarding whether they were affiliated with a union, 4.4% answered yes, 93% answered no, and 2.6% did not answer; 79.8% performed their work activities in Mexico City, while the resting 20.2% performed their work activities in other cities/states.
Instrument . The questionnaire used was the “Identification of psychosocial risk factors and evaluation of the organizational environment for more than 50 workers” from the STPS, identified in NOM 035 as reference guide three (GRIII). The official document does not specify reliability, validity, or construction backgrounds, and it was this lack of elements that prompted this study. The instrument was presented through an internet link developed on the server “Formsite”. The questionnaire comprised 72 items and 11 demographic questions. The answers were presented on a 5-point scale (Never, Almost never, Sometimes, Almost Always, and Always), the approximate response time was between 20 and 60 minutes. The 72 items measure 25 dimensions that comprise 10 domains, which in turn comprise 5 categories. NOM 035 provides qualification ranges for the questionnaire in general, by categories, and by domains. In said standard no previous information is provided for reliability, validity, or procedures prior to its standardization (STPS, 2017).
Procedure. The questionnaire was applied individually through the internet link, during the times authorized by the services company, between the months of April and May 2017; the application was anonymous as proposed by the researchers and at the request of the authorities of the company, and there was also a commitment for the confidential handling of the data concerning the company. The Formsite server allowed working the corresponding database on Excel, SPSS, and IBM-AMOS in order to use it in simple statistical and multivariate analyses. Once the information was captured, it was analyzed in the following stages: a reliability study was carried out (Cronbach’s alpha), a few descriptions of the results were done, and CFA were carried out for 10 domains given that the purpose was the confirmation of the explicit hypothesis that the psychosocial factors are comprised by at least 10 domains (factors or latent variables) that contain 72 items (observed variables), since the STPS (2017), the literature, and the ILO have so established in international models (see also Byrne, 2010; Jöreskog and Sörbom, 1993; and Martínez, 2005, concerning the confirmatory factor analyses). Variance analyses and correlations were also carried out to understand some validity aspects. Finally, an analysis concerning strengths and weaknesses was carried out, as well as proposals to further psychometric objectives adequate for the instrument and its purposes of evaluation in terms of the wellbeing of the workers.
Results
The GRIII scale is a multifactor scale, therefore, its analysis was carried out in terms of factors, analyzing 10 factors (domains). The first analyses of a descriptive character were: by item (Table 2), then by dimension, domain, reliability, and category (see Table 3).
Table 3 Description of means by dimension, domain, and category, and reliability of the 10 domains considered as factors, for the GRIII questionnaire of the STPS for more than 50 workers
| # Dimension (F) |
Dimension mean (n=25) |
Upper qualification limit of dimension |
Domain mean (D) (n=10) |
Upper qualification limit of domain |
Mean Correlation/ elements* |
α Reliability Domain |
Category mean (C) (n=5) |
Upper qualification limit |
| F1 | 1.92 | 8 | ||||||
| F2 | 2.78 | 8 | ||||||
| F3 | .78 | 4 | D1 5.49 | 20 | .315 | .68 | C1 5.49 | 20 |
| F4 | 4.86 | 8 | ||||||
| F5 | 3.61 | 8 | ||||||
| F6 | 8.26 | 12 | ||||||
| F7 | 4.05 | 16 | ||||||
| F8 | 5.22 | 8 | ||||||
| F9 | 3.07 | 8 | D2 29.09 | 60 | .260 | .83 | ||
| F10 | 6.64 | 16 | ||||||
| F11 | 4.84 | 8 | ||||||
| F12 | 3.91 | 8 | ||||||
| F13 | 3.11 | 8 | D3 18.51 | 40 | .286 | .80 | C2 47.61 | 100 |
| F14 | 3.14 | 8 | D4 3.14 | 8 | .531 | .69 | ||
| F15 | 3.17 | 8 | ||||||
| F16 | 2.80 | 8 | D5 5.98 | 16 | .510 | .80 | C3 9.12 | 24 |
| F17 | 5.02 | 16 | ||||||
| F18 | 7.56 | 20 | D6 12.58 | 36 | .625 | .93 | ||
| F19 | 6.65 | 20 | ||||||
| F20 | 3.34 | 16 | D7 10 | 36 | .429 | .87 | ||
| F21 | 8.20 | 32 | D8 8.20 | 32 | .550 | .90 | C4 30.78 | 104 |
| F22 | 3.02 | 8 | ||||||
| F23 | 5.71 | 16 | D9 8.74 | 24 | .445 | .83 | ||
| F24 | 2.14 | 8 | ||||||
| F25 | 3.42 | 8 | D10 5.56 | 16 | .343 | 67% | C5 14.30 | 40 |
| TOTAL | 288 | 288 | .95(n=72; total) | 288 |
Note: The GRIII Questionnaire is comprised of 72 items, 25 dimensions (F), 10 domains (D), and 5 categories (C); the reliability or Cronbach’s alpha (α) is expressed as “Reliability” per domain. Domains: 1. Conditions of the work environment; 2. Workload; 3. Lack of control over the work; 4. Working day; 5. Interference in the work-family relationship; 6. Leadership; 7. Work relationships; 8. Mobbing; 9. Performance recognition; 10. Insufficient sense of belonging, and instability. Categories: 1. Work environment; 2. Activity-specific factors; 3. Organization of working hours; 4. Leadership and work relationships; 5. Organizational environment. For the Dimensions (F) see Table 1. * The correlations between elements is presented in a summarized manner with the means by dimension (a 72x72 table is not shown due to space issues).
Source: own elaboration.
As can be observed in Table 2, the central tendency and dispersion measurements show descriptive consistency, but not discriminative consistency due to the fact that item discrimination was not carried out. It can be observed that it is necessary to use Z points for the comparison between dimensions and domains.
Based on Table 3, three important elements can be observed: the first is regarding the difficult comparison of the standardization of the data between the upper limits of its qualification ranges and the means corresponding to the dimensions, domains, and categories, mainly due to there not being a unique range for comparison, since the means of the 25 dimensions vary between .78 and 8.20, and their upper limits vary between 4 and 32; furthermore, for the 10 domains, their measurements fluctuate between 5.49 and 47.61, whereas their upper limits are between 20 and 104. The second element is perhaps one of the most important indicators of any questionnaire: reliability. In this sense the GRIII questionnaire obtained a fluctuating reliability between 67% and 93% for the 10 domains, for which they can be considered as good; generally speaking, 95% was obtained for the 72 items. The third element refers to a global appreciation of all the qualifications, which in reality are not comparable among themselves given that each dimension is comprised by a different number of items (see Table 1), as there are dimensions that contain from 1 item to 32 items, similarly a domain contains from 1 dimension up to 4 and, therefore, a category can contain from 3 domains up to 10.
In this first study reference is made to the so-called factor studies in psychometry, which tend to be presented through two methods: principal component analysis and factor analysis. In this study a first approximate to what is called CFA (Byrne, 2010; Jöreskog and Sörbom, 1993; and Martínez, 2005) was carried out, since the number of latent variables (10) was established by the STPS, although said variables lack two important elements: the saturations of the observed variables in the latent variables, and the covariance and correlation between them. Based on the aforementioned, it was decided to carry out a CFA using the IBM SPSS Amos package resulting in Table 4, which contains the corresponding goodness of fit statistics for the 10 domains of the GRIII:
Table 4 Goodness of fit statistics of the 10 confirmatory structural models by domains of the “Identification of psychosocial risk factors and evaluation of organizational environment in the work centers of the STPS (GRIII)” questionnaire
| Model/ Domain | No. of items input in each factor analysis | x² Chi-square | gl Degrees of freedom | x²/gl | P significance | NFI Normed fit index | CFI Comparative fit index | PCFI Parsimony correct ed fit index | RMSEA Root mean square error of approxi mation |
| 1 | 5 | Not observed | 1.00√ | 1.00√ | .00 | .349 | |||
| 2 | 15 | 92.033√ | 75 | 1.227 | .088√ | .87 | .972√ | .694 | .045√ |
| 3 | 10 | 60.460√ | 29 | 2.084 | .001 | .87 | .926√ | .596 | .098 |
| 4 | 2 | Not observed | 1.00√ | 1.00√ | .00 | .567 | |||
| 5 | 4 | 2.066√ | 1 | 2.066 | .151√ | .986√ | .992√ | .165 | .097 |
| 6 | 9 | 36.647√ | 26 | 1.409 | .080 | .958√ | .987√ | .713 | .060√ |
| 7 | 9 | 53.094√ | 26 | 2.042 | .001 | .938√ | .967√ | .698 | .096 |
| 8 | 8 | 55.928√ | 20 | 2.796 | .000 | .901√ | .933√ | .667 | .126 |
| 9 | 6 | 17.500√ | 8 | 2.187 | .025 | .940√ | .966√ | .515 | .103 |
| 10 | 4 | .644√ | 1 | .644 | .422√ | .994√ | 1.00√ | .167 | .000 |
Note: the figures marked with the symbol √ imply that they meet the recommended goodness of fit indices according to Vanderberg and Lance (2000).
Source: own elaboration.
As can be observed in Table 4 above, the 10 indices obtained in a first analysis without adjusting the models are shown. The objective of this study was to understand their psychometric properties before any adjustment, so that with regard to x2 (Chi-square) as a non-centrality fit measurement and where the ideal is to not be statistically different, all had high acceptable x2 values, but only three were not significant (domains two [.008], five [.151], and ten [.422]), as such seven of them were not very acceptable. Concerning the normed fit index (NFI), relative or incremental, in a relative comparison of the proposed model, two had perfect fit (1.0 for domains one and four) and eight showed a good fit (between .87 and .994 for domains two, three, and five to ten). Another relative fit measurement such as the comparative fit index (CFI), which implies a comparison between the estimated model and the independent model, was shown to be appropriate for the small sample (n=114) given that the ten values were above .90. The parsimony-corrected fit index (PCFI) is acceptable for all ten domains. Finally, in another absolute or non-centrality fit measurement-the RMSEA (root mean square error of approximation)-in which discrepancy is measured in terms of population and not only on the sample extracted from the estimation, only two domains met the expected value of less than .08 (domains two [.045] and six [.060]).
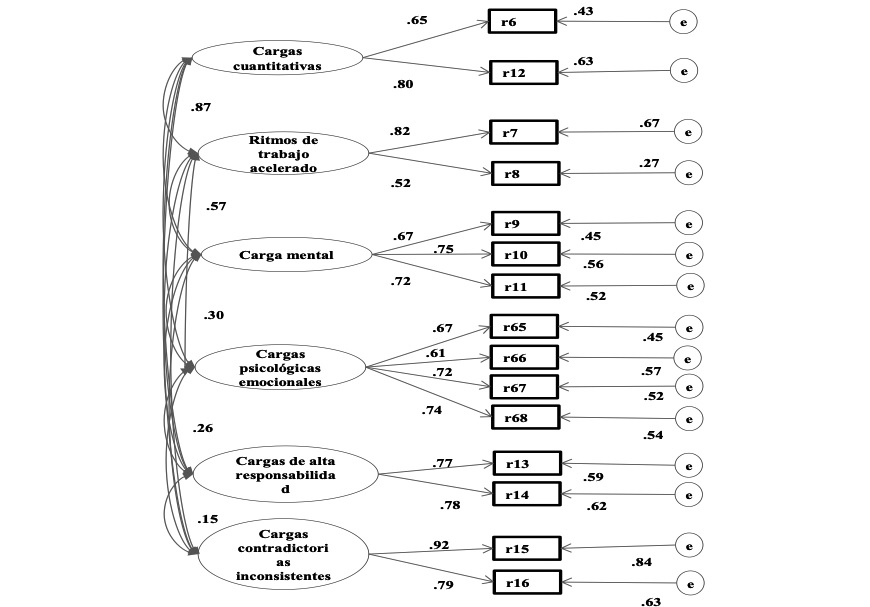
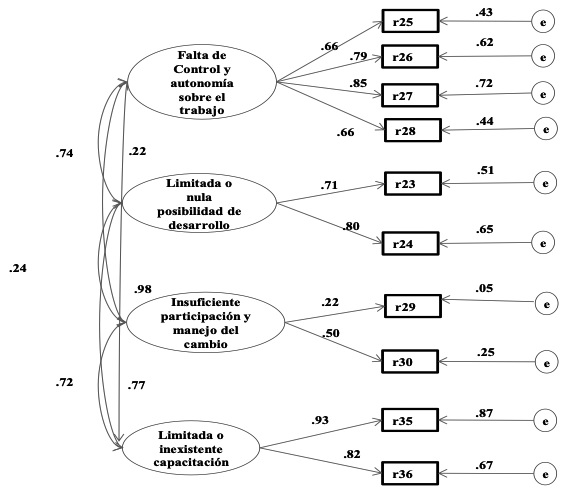
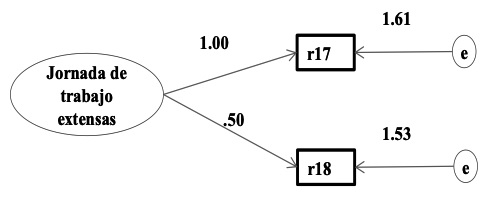
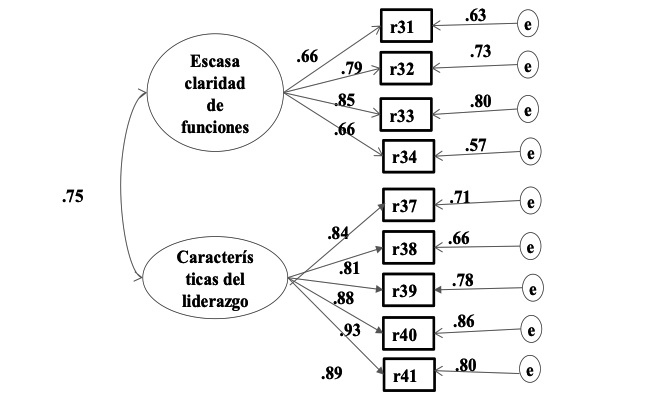
The specification of the models tends to be established in two forms: through a set of linear equations similar to those of regressions, which are represented by the indices obtained in Table 4 above; and through diagrams that imply relationship models between observable and latent variables that deconstruct in sub-models called measurement or structural equation models. With respect to the above, see Figures 2 to 11 presented below:

Fuente: elaboración propia.
Figura 2 Dominio de condiciones del ambiente de trabajo. Estudio factorial confirmatorio mediante modelamiento estructural de cinco reactivos.
Fuente: elaboración propia.
Nota: Se omiten correlaciones entre variables latentes por falta de espacio.
Figura 3 Dominio de carga de trabajo. Estudio factorial confirmatorio mediante modelamiento estructural de 15 reactivos.
Fuente: elaboración propia.
Figura 4 Dominio falta de control sobre el trabajo. Estudio factorial confirmatorio mediante modelamiento estructural de 10 reactivos.
Fuente: elaboración propia.
Figura 5 Dominio Jornada de trabajo. Estudio factorial confirmatorio mediante modelamiento estructural de dos reactivos.

Fuente: elaboración propia.
Figura 6 Dominio interferencia relación trabajo-familia. Estudio factorial confirmatorio mediante modelamiento estructural de cuatro reactivos.
Fuente: elaboración propia.
Figura 7 Dominio liderazgo. Estudio factorial confirmatorio mediante modelamiento estructural de nueve reactivos.
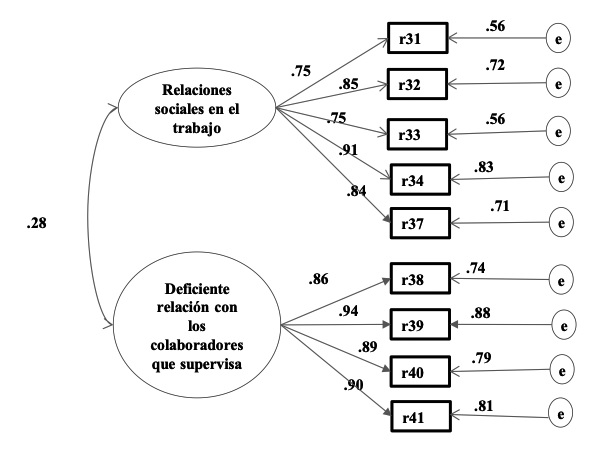
Fuente: elaboración propia.
Figura 8 Dominio relaciones en el trabajo. Estudio factorial confirmatorio mediante modelamiento estructural de nueve reactivos.
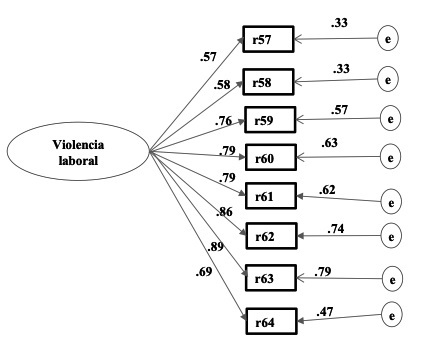
Fuente: elaboración propia.
Figura 9 Dominio violencia laboral. Estudio factorial confirmatorio mediante modelamiento estructural de ocho reactivos.
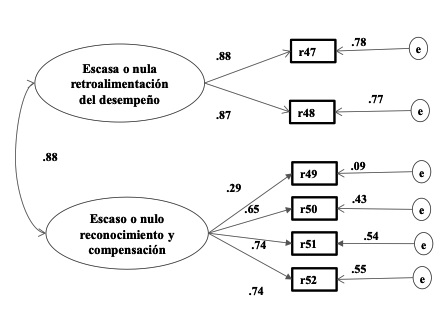
Fuente: elaboración propia.
Figura 10 Dominio reconocimiento del desempeño. Estudio factorial confirmatorio mediante modelamiento estructural de seis reactivos.
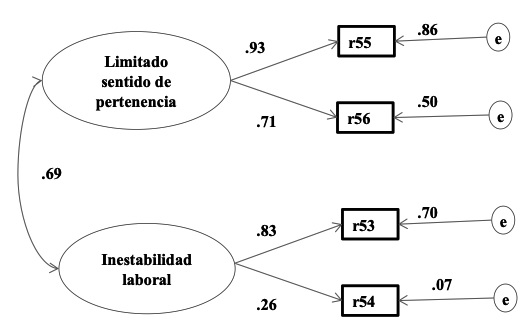
Fuente: elaboración propia.
Figura 11 Dominio insuficiente sentido de pertenencia. Estudio factorial exploratorio mediante modelamiento estructural de cuatro reactivos.
The 10 models corresponding to the 10 domains can be appreciated in the diagrams presented above, which represent factors to be confirmed according to the proposal by the STPS (2017) in NOM 035; in these same diagrams, the latent variables (domains) and their respective observable variables (items) can be observed. The correlations contained in each relationship between observable variables and their corresponding latent variables can also be distinguished, that is, the relationship between variance and covariance.
Subsequently, Pearson correlations and One-Way analyses of variance were carried out for descriptive purposes regarding the relationships between categories, domains, and dimensions among themselves and/or other variables. First, the correlations between the 10 domains studied were carried out (see Table 5).
Table 5 Pearson correlations between the domains of the GRIII questionnaire
| Domains | 1 | 2 | 3 | 4 | 5 | 6 | 7 | 8 | 9 | 10 |
| 1 | 1 | |||||||||
| 2 | .43** | 1 | ||||||||
| 3 | .25** | .28** | 1 | |||||||
| 4 | .35** | .60** | .23* | 1 | ||||||
| 5 | .39** | .62** | .30** | .69** | 1 | |||||
| 6 | .45** | .23* | .41** | .25** | .35* | 1 | ||||
| 7 | .44** | .44** | .26** | .38** | .48** | .61** | 1 | |||
| 8 | .56** | .49** | .30** | .34** | .50** | .57** | .72** | 1 | ||
| 9 | .44** | .18* | .37** | .22* | .33** | .78** | .60** | .55** | 1 | |
| 10 | .33** | .22* | .41** | .40** | .36** | .67** | .52** | .52** | .66** | 1 |
Note: 1. Conditions of the work environment; 2. Workload; 3. Lack of control over the work; 4. Working day; 5. Interference in the work-family relationship; 6. Leadership; 7. Work relationships; 8. Mobbing; 9. Performance recognition; 10. Insufficient sense of belonging, and instability. *p<=.05; **p<=.01
Source: own elaboration
In Table 5 it can be observed that all the domains are highly correlated, with the lowest value being .18 and the highest being .78, with the following standing out: domain 1 with domains 6 (.45) and 8 (.56); domain 2 with 4 (.60) and 5 (.62); domain 3 with 6 and 10 (both with .41); domain 4 with 5 (.69) and 10 (.40); domain 5 with 7 (.48) and 8 (.50); domain 6 with 9 (.78) and 10 (.67); domain 7 with 8 (.72) and 9 (.60); domain 8 with 9 (.55); and domain 10 with 6 (.67).
Subsequently, Pearson correlations were also carried out between the categories derived from the corresponding domains in order to take advantage of the descriptive statistics of the sample. Correlations were observed between all the categories, fluctuating between .35 and .78, with the following standing out: category 1 with 4 (.55); category 2 with 3 (.65); category 3 with 4 (.49); and category 4 with 5 (.78) (See Table 6).
Table 6 Pearson correlations between the categories of the GRIII questionnaire
| Domains | 1 | 2 | 3 | 4 | 5 | Total |
| 1 | 1 | |||||
| 2 | .45** | 1 | ||||
| 3 | .41** | .65** | 1 | |||
| 4 | .55** | .50** | .49** | 1 | ||
| 5 | .43** | .35** | .38** | .78** | 1 | |
| Total | .64** | .76** | .70** | .92** | .78** | 1 |
Note. 1. Work environment; 2. Activity-specific factors; 3. Organization of working hours; 4. Leadership and work relationships; 5. Organizational environment. **p<=.01
Source: own elaboration
Finally, One-Way analyses of variance were carried out (see Table 7), also with descriptive purposes of the corresponding sample, with three variables standing out: gender, position, and significant other. In the case of gender (male, female) and position (operational, supervisory, and managerial), these relate with domain 2 where it can be observed that the greater perception of workload is reported by male and with managerial and supervisory activities (<=.05); it is also observed that those who report greater problems with their working day are managers and supervisors (<=.05); the ones who report greater problems with their work relationships are those who have a significant other; and, finally, the general category of organization of working hours reports significant problems with the managerial and supervisory positions (<=.05) (See Table 7).
Table 7 One-Way analysis of variance of domains and categories with other variables of the GRIII questionnaire
| Variables | Groups | D1 | D2 | D3 | D4 | D5 | D6 | D7 | D8 | D9 | D10 | C1 | C2 | C3 | C4 | C5 |
| Gender | Female Male |
27.3* 30.9* |
||||||||||||||
| Position | Operational Supervisory Managerial |
26.8* 30.9* 34* |
2.6* 3.4* 6* |
7.8* 10* 14* |
||||||||||||
| Significant Other | Single W/ a partner |
9.3* 12* |
Note: Domains (D): 1. Conditions of the work environment; 2. Workload; 3. Lack of control over the work; 4.
Working day; 5. Interference in the work-family relationship; 6. Leadership; 7. Work relationships; 8. Mobbing; 9. Performance recognition; 10. Insufficient sense of belonging, and instability. Categories (C): 1. Work environment; 2. Activity-specific factors; 3. Organization of working hours; 4. Leadership and work relationships; 5. Organizational environment. *p<=.05 Source: own elaboration
Conclusions
According to Kerlinger (2002), the study can be exploratory, confirmatory, correlational, and structural in theoretical terms; this study did not intend to prove a theoretical model, nor measure psychosocial risks, and much less solve the problems of other instruments. The intention is to prove, critique, and propose aspects for improvement, with a strictly exploratory purpose, for the NOM 035 proposal made by the STPS in 2016. It is very important in the field of measurement to have reliable tools, and authors are in complete agreement with this; however, the STPS proposes the GRIII questionnaire without providing any psychometric quality of the instrument, and nevertheless will demand its implementation in the entire country starting in 2019. In this article, the qualities of the questionnaire are analyzed in a statistical and critical manner, and in this section some improvements are proposed for its good use; this research serves as a critique and feedback towards the STPS. It is important to recognize that in Mexico there are no valid instruments to measure the psychosocial factors as a whole, therefore, there is no Mexican theoretical framework related to the GRIII proposed by the STPS (see Juárez, 2015).
Although Moreno (2011) is right when proposing that the work is paradoxical with regard to the possibility of generating wellbeing and health, the ILO/WHO (1984) is also right with regard to each country being responsible for its workers having “decent work” and everything this implies, particularly with regard to psychosocial factors. The spheres of the individual-work relationship in a psychological concept that links the organization and its productivity become fundamental elements of wellbeing or dissatisfaction at work, even more so nowadays when there are macro-climates of inequality, unemployment, precarious work, outsourcing, union corporatism, among others (Uribe, 2016). For this reason, the evaluation and/or diagnosis of those psychosocial risk factors by the organizations becomes a fundamental tool to decrease the paradox identified by Moreno (2011). According to Villalobos (2014), in order to evaluate psychosocial risks it is necessary to understand the environment to make hypotheses, objectives, and goals for prevention and intervention in order to improve the wellbeing of the workers. Additionally, this work helps to confirm that the psychosocial proposal of Karasek & Theorell (1990) is still valid and that it is strengthened with the appearance of the concept of the psychosocial factor proposed by the current and valid literature. Based on the aforementioned, the understanding of the psychometric properties of the GRIII questionnaire proposed by the STPS means one more step in favor of Mexican companies and workers. The authors of this study recognize in advance the efforts of the Mexican State, of the STPS, and of the ILO for recommending the use of the GRIII, and the effort to evaluate the psychosocial risk factors with said questionnaire. Although there is the model by Karasek and Theorell (1990) as a starting point for the existence of psychosocial factors-as recognized in the international literature-, in the case of the ILO and the STPS the approach of applying psychosocial risk factor questionnaires is not theoretical, it is without a doubt pragmatic, since the questionnaires proposed in NOM 035 will serve only and exclusively to measure risks, determine risk correction and/or prevention programs, and determine ranges of results for companies to prove actions and omissions that could lead the STPS to approve entrepreneurial activities or, as the case may be, sanctions or fines (see NOM 035). The prevention of illnesses and psychosocial risks in the work environment is as important as analyzing, confirming, or inventing theoretical models in social sciences. This study analyzes, questions, and proposes, theoretically and statistically, the instrument proposed by the STPS with strictly practical purposes, recognizing that the theory has done its reconnaissance mission with regard to the existence of psychosocial factors at work.
The results of the GRIII study allowed, in a global manner, for three analysis blocks: the first block, of a descriptive character, led to the understanding, through the application of the questionnaire, of the first measurements of central tendency and dispersion (Tables 2 and 3), observing an apparent consistency by the numerical homogeneity; however, in said numbers it is not observed whether the items discriminated for their formation as elements of each dimensions. On another front, it can be observed in Table 2 that the means of the 72 items are within a range of .64 (item 68) and 3.10 (item 9), which could appear proportional if a scale from 0 to 4 is considered; however, considering the 25 dimensions or the 10 domains (see Table 3), the sum of the items (72) or the corresponding dimensions (25) are no longer comparable among themselves. Similarly, the qualification standards proposed by the STPS (2017) have the same problem, since they have no way to be compared because in order to obtain dimensions, domains, and qualification standards, respectively, they are carried out based on simple sums, with the disadvantage that each dimension is comprised by a different number of items and, consequently, each domain is also comprised by a different number of dimensions. Therefore, in order to compare the dimensions or domains among themselves, it would be necessary to resort to what is called, in psychometry and statistics, a Z-score. Z-scores are transformations that can turn values or scores into a normal distribution for the purpose of analyzing their distance with regard to the mean, expressing them in standard deviation units. A Z-score indicates the direction and degree in which an individual value obtained moves away from the mean in a scale of standard deviation units, for which normal distribution tables and the formula Z are used, which allow comparing values from different ranges in a test, and different tests in a universal language called “area below the curve” (Kerlinger, 2002). In this block the reliability of the GRIII questionnaire was also analyzed, with it being between .67 and .93 for the ten domains and obtaining a general score of .95 for the 72 items. Without a doubt, these values are excellent with the procedure of analysis of variance with Cronbach’s alpha (α) that was used, in which the assumption exists that the scores of the items are practically tau-equivalent and the non-compliance of the assumption tends to reduce the value of the estimator in a longitude test n=1, that is, the variance and covariance structure of the responses to all the items tend to be equal. In 1951, Cronbach demonstrated that when the reason for two variances is found in the interval (.90-1.10) of each item, it is permitted to treat each item as if it were a longitude-unit test with a stable or reliable score (Martínez, 2005).
A second analysis block concerned the so-called Confirmatory Factor Analyses (CFA). The reason for the above is that factor analysis is one of the most widely accepted methods to determine the validity of a construct based on a common part of the variance as dispersion measurement. CFA was used under the assumption that the STPS (2017) proposes, in NOM 035, 10 domains comprised by 25 dimensions that in turn are comprised by 72 items, which must derive from an exploratory factor analysis. This information, however, is a great omission on behalf of the STPS, since it forces the elaboration of the hypothesis that there are ten domains or factors to prove in a model of structural equations, which were previously obtained in an exploratory factor analysis. Those that could be significant to understand the initial analyzed model without adjustments, that is, as is presented in NOM 035 (STPS, 2017), were considered. The results showed that the domains with greater problems of fit are 1 and 4, Conditions of the work environment and Working day, respectively, since they did not show acceptable non-centrality values (x2 Chi-square and RMSEA); the Root Mean Square Standard Error of Approximation (RMSEA) only showed acceptable values for domains 2 and 6, Workload and Leadership, coincidentally factors with a high number of items (15 and 9, respectively); if the purpose was to search for a fit of the proposed model it is probably that those factors (domains) with 5 or less items do not manage to overcome the modification, loss of items, or error correction, due to them being a small number of items. According to Martínez (2005), Gorsuch (1983), and Guadagnoli and Velicer (1988), when a questionnaire is made and subjected to a CFA, a range between 5 and 10 items per variable (per item) must be considered; in this case, if looking to remake the instrument with its 72 items, it would be necessary to have at least 720 subjects just for this purpose and for any of the two possible methods (principal components or equations). Consequently, of the 10 factors or domains only two show acceptable values in a first analysis without adjustment. It would be desirable to elaborate analyses with more subjects for the two CFA methods in order to see coincidences and differences with this study. Furthermore, it is recommended to elaborate and add, where appropriate, some items for those 16 dimensions out of 25 that only have one or two items, since, in the case of having to adjust the model, it could afford losing some items without the risk of being left without any. The elaboration of second order factor analyses should also be considered, given that the existence of dimensions, domains, and categories could mean a second or third order to comprise latent variables. Unfortunately, all that has been mentioned has been omitted as background information of its questionnaires in the NOM 035 published by the STPS (2017).
In a third block, a series of correlations and analyses of variance were carried out with exploratory and correlational purposes within a descriptive framework of the behavior of the analyzed sample, obtaining the following general conclusions (Tables 5, 6, and 7): the entire questionnaire is correlated in a positive manner, with all of the domains and all of the categories; Conditions of the work environment (1) seem to be highly related with mobbing and leadership; Workload (2) with working day and interference in the work-family relationship; Lack of control (3) with leadership and insufficient sense of belonging, and instability; Working day (4) with interference in the work-family relationship and insufficient sense of belonging; Interference in the work-family relationship (5) with work relationships and mobbing; Leadership (6) with performance recognition and insufficient sense of belonging, and instability; Work relationships (7) with mobbing and recognition; mobbing (8) with recognition; Performance recognition (9) with insufficient sense of belonging, and instability. In short, all of the psychosocial risk factors are related and apparently the previously described relationships can be indicators for the start of planned intervention for the studied sample.
Similarly, the correlations among all the categories are positive, however, it can be appreciated that Work environment (1) has a great relationship with leadership and work relationships; Activity-specific factors (2) with organization of working hours; Time organization (3) with leadership and work relationships. Finally, the applied analyses of variance show that men perceive more workload than women. It is also observed that the higher the position, the greater the perceived workload. It can also be affirmed that with a higher position there is a greater workload and a longer working day; therefore, there is worse time management. Additionally, it is observed that single people perceive a deterioration in the work relationships when compared to those who have a significant other. According to Gil-Monte (2014) and Uribe-Prado (2016) this type of relationships confirm the psychosocial impact of the factors studied in the social, work, and personal life of all the workers, which, according to the authors, will also impact on quality of life and productivity. An important reasoning based on the positive correlation among all the variables is the confirmation of the column in Table 1 where a new name is proposed for five of the domains, given that the questionnaire measures domains with a negative focus of the psychosocial factor being referenced. The aforementioned is even observed in the direction of the items and in their weight when clarifying them (with values from 4 to 0); therefore, the proposal is to change: the name of Conditions of the work environment to Adverse conditions of the work environment; Working day to Extensive working day; Leadership to Lack of leadership; Work relationships to Adverse work relationships; and Performance recognition to Lack of performance recognition. The analysis of the form, direction, and qualification weight of the items that comprise the dimensions and the corresponding domains suggests correcting, from the name of the domain, the “unfavorable” direction that makes justly valid the concept of “psychosocial risk” as a differentiating element to the concept of “psychosocial factor”, which can have a positive connotation (Gil-Monte, 2014; Moreno, 2011; Uribe-Prado, 2016; and Villalobos, 2004).
In summary, the main conclusions of this study can be synthesized in the following manner: <>>>>>>>> less with second-order factors. The different correlation and variance analyses showed that the psychosocial factors are highly related among themselves, which can allow establishing some direct and indirect possibilities as intervention indicators and, in the future, as validity indicators. The change in name of five domains is also proposed, as their current names do not correspond to the conceptualization of psychosocial risk and its negative connotation. The effort of the STPS to promote the measurement and consideration of the psychosocial risk factors is recognized and appreciated; however, the recommendation is to carry out different studies to understand properties, possibilities of use, and, above all, to be able to guarantee that the proposals of the STPS can really be used to improve the life of the workers and the productivity of the companies as proposed by the theory and historical and research backgrounds. Given the aforementioned, it is suggested to read, discuss, and consider this article and its proposals in order to understand the theoretical issues and statistics in the use of measurement questionnaires such as the GRIII. In addition, this read should help the STPS to consider the opinions described here for future proposals related to the use of measurement instruments. This article is an example of subsequent studies, recognizing that the samples could be broadened based on the size of the companies. Studies could also be done by sectors or industrial branches, but the task towards this type of studies would require a lot of human and financial resources. Finally, this article could serve as reference or a starting point of Mexican research backgrounds for future investigations in the academic, entrepreneurial, labor, statistical, and occupational health fields, among others.
REFERENCES
Alcántara, M.S. y Hernández, S.A. (2005). Necesidad de estudios y legislación sobre factores psicosociales en el trabajo. Revista cubana de salud pública, 31,4, 1-8. [ Links ]
Byrne, B.M. (2010). Structural Equation Modeling with AMOS, Basic concepts, Applications, and Programming. U.S.A.: Rotledge, Taylor & Francis Group. [ Links ]
Calderón, H.G., Serna, G.H.M. y, Zuluaga, S.J. (2013). Liderazgo y relaciones sociales en el trabajo como factor de riesgo psicosocial: su incidencia sobre gestión humana en las organizaciones. Diversitas: Perspectivas en Psicología, 9, 2, 409-423. https://doi.org/10.15332/s1794-9998.2013.0002.13 [ Links ]
Fernández-Prada, M., González-Cabrera, J., Iribar-Ibabe, C., y, Peinado, J.M. (2013). Comentarios sobre riesgos psicosociales en el trabajo: Una aproximación evaluativa. Revista Peruana de Medicina Experimental y Salud Pública, 30,1, 149-150. https://doi.org/10.1590/S1726-46342013000100032 [ Links ]
Dollard, M., Skinner, N., Tuckey, M., & Bailey, T. (2007). National Surveillance of psychosocial risk factors in the workplace: an international overview. Work & Stress, 21, 1-29. https://doi.org/10.1080/02678370701254082 [ Links ]
Garrido-Pinzón, J., Uribe-Rodríguez, A.F. y, Blanch, J.M. (2011). Riesgos psicosociales desde la perspectiva de la calidad de vida laboral. Acta Colombiana de Psicología, 14,2, 27-34. [ Links ]
Ghai, D. (2003). Trabajo decente. Concepto e indicadores. Revista Internacional del Trabajo. 122,2, 125-160. https://doi.org/10.1111/j.1564-913X.2003.tb00171.x [ Links ]
Gil-Monte, P.R. (2014). Manual de psicosociología aplicada al trabajo y a la prevención de los riesgos laborales. Madrid: Ediciones Pirámide. [ Links ]
Gómez, V., Segura, C.S., Castrillón, D. y, Perilla, L.E. (2016). Estandarización de una batería para la evaluación de factores de riesgo psicosociales laborales en trabajadores colombianos. Acta Colombiana de Psicología , 19,2, 221-238. https://doi.org/10.14718/ACP.2016.19.2.10 [ Links ]
Gorsuch, R.L. (1983). Factor analysis. Hillsdale, NJ: Lawrence Erlbaum. [ Links ]
Guadagnoli, E. & Velicer, W. (1988). Relation of simple size to the stability of component patterns. Psychological Bulletin, 103, 265-275. https://doi.org/10.1037/0033-2909.103.2.265 [ Links ]
Jöreskog, K.G. & Sörbom, D. (1993). LISREL 8: Structural equation modelling with the Simplis command language. Hillsdale, NJ: Lawrence Erlbaum . [ Links ]
Juárez-García, A. (2007). Factores psicosociales, estrés y salud en distintas ocupaciones: un estudio exploratorio. Investigación en salud, IX,1, 57-64. [ Links ]
Juárez-García, A. (2015). Investigaciones psicométricas de escalas psicosociales en trabajadores mexicanos. México: Plaza y Valdés Editores-UAEM. [ Links ]
Karasek, R. y Theorell, T. (1990). Healthy Work. Stress, productivity and the reconstruction of working life. Nueva York, N.Y. Basic Books. [ Links ]
Kerlinger, F.N. (2002). Investigación del comportamiento. México: McGrawHill. [ Links ]
Ladou, J. y Harrison, R. (2015). Diagnóstico y tratamiento en medicina laboral y ambiental. México: Editorial Manual Moderno. [ Links ]
Leka, S., Nora, A., Stage, F., Barlow, E., & King, J. (2010). Health Impact of Psychosocial Hazards at Work: An Overview. Geneva: WHO. [ Links ]
LFT (2012). Ley Federal del Trabajo. México: Porrúa. [ Links ]
LSST (2014). ( (www.dof.gob.mx/nota_detalle.php?codigo=5368114&fecha=13/11/2014 consultado 6 junio 2017). [ Links ]
Márquez, G.M. y Zambrano, S.J. (2013). Evaluación de los riesgos psicosociales en una empresa metalmecánica. Ingeniería Industrial y Nuevas Tendencias, 3, 11, 39-48. [ Links ]
Martínez, A.R. (2005). Psicometría: teoría de los tests psicológicos y educativos. Madrid: Síntesis Psicología. [ Links ]
Moreno, J.B. (2011). Factores y riesgos laborales psicosociales: conceptualización, historia y cambios actuales. Medicina y seguridad del trabajo, 57,1, 4-19. https://doi.org/10.4321/S0465-546X2011000500002 [ Links ]
Muñiz, J. (2006). Psicometría. Madrid: Editorial Universitas, S.A. [ Links ]
Nunnally, J. y Bernstein, Y. (1995). Teoría psicométrica. México: McGrawHill . [ Links ]
STPS (2018). Norma 035 ( (https://dof.gob.mx/nota_detalle.php?codigo=5541828&fecha=23/10/2018 ), consultado 16 octubre 2019) [ Links ]
OIT/OMS (1984). Factores psicosociales del trabajo: naturaleza, incidencia y prevención. Informe del comité mixto de la Organización Internacional del Trabajo y la Organización Mundial de la Salud sobre medicina del trabajo. Ginebra: Suiza. [ Links ]
Osca, A., López-Araujo, B., Bardera, P., Urien, B., Diez, V. y, Rubio, C. (2014). Riesgos psicosociales y accidentabilidad laboral: Investigación y propuestas de actuación. Papeles del Psicólogo, 35,2, 138-143. [ Links ]
Pereyra, G.C.I., Milei, J. y, Stefani, D. (2011). Factores psicosociales de riesgo en la enfermedad cardiaca. Revista Argentina de Clínica Psicológica, 20,3, 221-229. [ Links ]
Salanova, M., Llorens, S. & Schaufeli, W.B. (2011). Yes, I can, I feel good, and I just do it! On gain Cycles and spirals of efficacy beliefs, affect, and Engagement. Applied Psychology. An International Review, 60, 255-285. https://doi.org/10.1111/j.1464-0597.2010.00435.x [ Links ]
Uribe-Prado, J.F. (2008). Psicología de la salud ocupacional en México. México: UNAM. [ Links ]
Uribe-Prado, J.F., López, F.P.R., Pérez, G. C. y García, S.A. (2014). Síndrome de desgaste ocupacional (burnout) y su relación con salud y riesgo psicosocial en funcionarios públicos que imparten justicia en México, D.F. Acta de Investigación Psicológica, 4,2, 1554-1571. https://doi.org/10.1016/S2007-4719(14)70393-X [ Links ]
Uribe-Prado, J.F. (2015). Clima y ambiente organizacional. México: Editorial Manual Moderno . [ Links ]
Uribe-Prado (2016). Psicología del trabajo. México: Editorial Manual Moderno . [ Links ]
Villalobos, F.G.H. (2004). Vigilancia epidemiológica de los factores psicosociales. Aproximación conceptual y valorativa. Revista Ciencia y Trabajo, 6, 14, 197-201. [ Links ]
2Secretariat of Labor and Social Welfare, Public and Federal Secretariat of the Mexican Republic. In other countries, similar bodies are known as Labor Chancelleries or Ministries.
4GR means Reference Guides (for its acronym in Spanish), and are identified using Roman numerals I, II, and III.
Received: July 04, 2017; Accepted: January 10, 2019; Published: January 11, 2019
 Este es un artículo publicado en acceso abierto bajo una licencia Creative Commons
