text new page (beta)
 English (pdf)
 Article in xml format
 Article references
 Send this article by e-mail
 Cited by SciELO
  Similars in
SciELO
Similars in
SciELO 
 Permalink
Introduction
Contemporary tax policies pursue diversity of policy objectives. Thus, taxation aims not just to raise the necessary funds for government expenditure, but also to contribute to income redistribution, economic stabilization, resource allocation, while at the same time should be supportive to the economic growth. The purpose of the properly designed tax system is to achieve desired fiscal policy objectives in the most efficient way, namely by limiting undesired distortions, minimizing the cost of tax collection and promoting economic growth. The efficiency of taxation and particularly the tax structure plays important role in achieving economic growth and fiscal consolidation.
According to the conventional economic theory taxation creates distortions and impacts negatively on economic growth. Considering a simple production function it is apparent that taxation can affect growth through its impact on (1) physical capital, (2) human capital and (3) through its effect on the total factor productivity. Some studies enunciate that corporate and personal income taxes are the most detrimental to growth, while consumption, environment and property taxes are less harmful (OECD, 2008).
Having in mind these assumptions, this paper aims to study the basic trends in the distribution of the total tax burden in the EU-28 member states1 for the period 1996-2013 and its impact on the economic growth. In addition, the paper sheds a light on the government spending and budgetary deficits as factors for creating a growth-friendly environment. The paper comprises six sections. Section ‘Literature Review’ presents a brief literature review. Section ‘Tax Systems in the EU-28 Member States (1996-2014)’ provides a descriptive analysis focused on the tax burden and tax structure in the EU-28 member states, derived through breakdown of the total tax revenues into standard components such as direct taxes, indirect taxes and social security contributions. Section ‘Analytical framework and empirical methodology’ presents the analytical framework and empirical methodology. Section ‘Regression results’ studies the effects of taxation and tax structure on economic growth applying regression methodology. Section ‘Conclusions’ concludes.
Literature review
The empirical studies on the relationship between taxation and economy growth are mainly focused on providing an evidence firstly, for the impact of the tax level on growth and secondly, for the impact of the tax structure on growth. A number of studies (Agell, Ohlsson, & Thoursie, 2006; Barro, 1990, 1991; Easterly & Rebelo, 1993; Folster & Henrekson, 2001; Koester & Kormendi, 1989; Levine & Renelt, 1992; Paparas & Richter, 2015) have investigated the link between the overall level of taxation (or of public spending) and growth using cross-country growth regression models covering different periods and different samples of countries, but no clear consensus about the nature and significance of such a relationship has emerged from the exploration works. This is not surprising because the overall size of the public sector has two opposite effects. On the one hand, higher taxes cause potentially higher distortions and impact negatively on economic growth, but on the other hand, higher taxes suppose higher levels of public expenditure, some of which may foster economic growth.
The discussion on the impact of the tax structure on growth is mainly focused on the relative merits of direct vs. indirect taxes, and especially on their ability to create a more growth-friendly environment. The prevailing view favours indirect taxation, and suggests a shift of the fiscal burden towards indirect taxes, especially those on consumption. For example Myles (2009) reviews the findings on the topic and concludes that almost all the results support the claim that a move from income taxation to consumption taxation will raise the rate of growth. Moreover, a general tendency to shift the fiscal burden from direct to indirect taxation, and in particular from labour and capital towards the consumption taxes, has been observed in some of the EU member states over the last years (EU Commission, 2011).
The results from the empirical analyses of Kneller, Bleaney, and Gemmell (1999), Widmalm (2001), Lee and Gordon (2005), Gemell et al. (2006), Arnold (2008), Schwellnus and Arnold (2008), Vartia (2008), Dackehag and Hansson (2012), Bernardi (2013), Szarowska (2013), Canavire-Bacarreza, et al. (2013), Tanchev (2016) shed a light on the nature and significance of the relationship between tax structure and growth.
Kneller, Bleaney and Gemmell (1999) used a panel of 22 OECD countries for the period 1970-95 and identified a depressing effect of so called ‘distortionary taxes’, which include taxes on income and property. These findings are further confirmed by the analysis of Gemell, Kneller and Sanz (2006), which provided new evidence on the long-run impact of distortionary taxes on growth in OECD countries by updating and extending datasets to cover 1970-2004. Lee and Gordon (2005) applied cross-country regressions and found a significant negative correlation between statutory corporate tax rates and growth for 70 countries during 1970-1997. Dackehag and Hansson (2012) report similar results. They studied how statutory tax rates on corporate and personal income affect economic growth by using panel data for the period 1975-2010 for 25 rich OECD countries and found that both taxation of corporate and personal income negatively influence economic growth. The empirical analyses of Schwellnus and Arnold (2008) and Vartia (2008), based on large datasets of firms and industries across OECD countries, also indicated a negative effect of corporate taxes on the productivity and investment.
Widmalm (2001) used pooled cross-sectional data from 23 OECD countries, between 1965 and 1990, and found evidence that the proportion of tax revenue raised by taxing personal income has a negative correlation with economic growth. The robustness of the result is confirmed by sensitivity analysis, where the author controled for other plausible growth determinants in a systematic manner. Arnold (2008) entered indicators of the tax structure into a set of panel growth regressions for a sample of 21 OECD countries over the period 1971-2004 and found that property taxes are the most growth-friendly, followed by consumption taxes and then by personal income taxes. At the same time corporate income taxes appear to have the most negative effect on growth. Szarowska (2013) applied regression analysis on annual panel data for EU-24 member states during the period 1995-2010 and found statistically significant positive effect of consumption taxes on GDP growth.
In contrast to these findings, Bernardi (2013) has performed an aggregated analysis of tax trends across Euro Area (EA-17) member countries, and a disaggregated, country-by-country analysis, with regard to the 2000-2014 period. He found that the gains from a tax shift (from direct to indirect taxes) do not appear to be as straightforward as claimed by the previous researches. On the contrary, he predicts that the tax shift may exacerbate the economic slump spreading across the European Union, particularly as an effect of the general adoption of restrictive fiscal policies by almost all member countries.
Canavire-Bacarreza, Martinez-Vazquez, and Vulovic (2013) evaluated the effect of different tax instruments on growth for Latin American countries using vector autoregressive techniques and panel data estimation. They found that personal income tax does not have the expected negative effect on economic growth. For corporate income tax, their results suggest reducing tax evasion and greater reliance on collection may boost economic growth in the region. The reliance on consumption taxes has significant positive effects on growth in Latin American in general, although they found slight negative effects in some of the selected countries.
Tanchev (2016) conducted an econometric study using OLS method in order to assess the impact of the personal income tax on the economic growth in Bulgaria for the period 2004-2012. He found that progressive income taxation has positive impact on growth.
Tax systems in the EU-28 member states (1996-2014)
Since the financial and economic crisis, the EU-28 member states have faced the difficult challenge of consolidating their budgets while at the same time promoting economic growth. The average budgetary aggregates in the EU-28 member states has clearly expressed cyclical dynamics over the period 1996-2014 (Fig. 1). As a whole, the average ratio of public spending to GDP is high and varies between 45% and 50%. The most apparent increase in government spending is observed since 2008 due to the financial and economic crisis. The EU countries and especially those of EU-152 traditionally have a strong social protection which entails higher amounts of government expenditure and respective tax burden. It is evident that proxies for economic development like GDP per capita, the industrial sector, and civil liberties have a positive impact on the tax revenues (Castro & Camarillo, 2014). Significantly lower public spending and tax burden are reported by the new member states (eastern and southern European countries), mainly as a result of liberal economic reforms of democratic transition (Figs. 2 and 3).

Source: Eurostat.
Fig. 1 Government Expenditure, Tax Revenue and Budgetary Balance in the EU-28 (% of GDP).

Source: Eurostat.
Fig. 2 Government Expenditure and Budgetary Balance in the EU-28 member states (% of GDP, mean 1996-2014).

Source: Eurostat.
Fig. 3 Distribution of the total tax burden in the EU-28 member states (% of GDP, mean 1996-2014).
The economic crisis triggered a collapse in gross domestic product (GDP) across EU-28 and highlighted the problems in connection with budget deficit and government debt. The balancing of budget has been on the agenda for most of the EU member states over the analyzed period. As seen, the average budgetary balance has cyclical dynamics (Fig. 1). However, the usual state of this variable is a lower deficit or a higher deficit and no surpluses are recorded, even in the peak of the business cycle. The conclusion is that fiscal policy in most of the EU-28 members does not reflect neither Keynesian nor neo-liberal principles for budgetary balancing. The Nordic countries (e.g. Denmark, Finland and Sweden) make an exception, registering the highest overall public spending parallel to the highest overall tax burden (and respectively balanced budgets) in an EU-wide comparison (Figs. 2 and 3).
The average overall tax burden in the EU-28 varies within very narrow limits (38.5%-40% of GDP). At the same time it differs considerably from country to country (Fig. 3). The lowest average total-tax-to-GDP rates are reported by Romania (28.1%) and Bulgaria (28.7%), while almost two times higher rates are observed in Denmark (47.7%), Sweden (46.2%) and Belgium (45.5%).
Although the mean tax burden in the EU-28 seems almost equally distributed between the direct taxes (12.6%), indirect taxes (13.0%) and social security contributions (13.2%), the receipts from taxes on labour and capital have significantly decreased from 2007 to 2010, outpacing the reduction of the GDP. On the one hand this is due to the financial and economic crisis, which has a negative effect on corporate profits and personal income. On the other hand a slight shift in the tax burden away from labour towards consumption was registered, especially in the countries of eastern and northern Europe.
A cross-country comparison reveals that the eastern European states generate a relatively high share of total revenues through taxes on consumption, while in the northern and central European states, revenues come predominantly from labour taxes. Some European countries, such as Germany, France, Austria, and Belgium, impose relatively high burden on the factor labour, compared with the EU-28 average, and register the large share of social security contributions. Denmark is a special case as social security revenues there only amount to 1.6% of GDP.
Analytical framework and empirical methodology
Barro's endogenous model is adopted as a suitable framework for analysis on the influence of taxation and government spending on economy growth in the EU-28 member states. Further developments of this model conclude that “the long-run growth rate of per capita output is a function of the tax rate and the shares of spending by different levels of government” (Davoodi & Zou, 1998, p. 247).
The last deduction is accepted as a basis of regression model. The simple regression is specified as the annual growth rate of GDP is dependent variable, and the following are independent variables: total government spending, total receipts from taxes and social contributions as well as budgetary balance. This general model enables us to estimate the impacts of the fiscal policy of the European governments on economic growth. Thus, the equation of this relationship has the following type:

where y it is the annual growth rate of GDP for each country and year. The total budget spending to GDP for each country and year is put into record with TS it . TR it is the total receipts from taxes and social contributions after deduction of amounts assessed, but unlikely to be collected, as a ratio to GDP for each country and year. The third variable BB it is budgetary balance, which expresses net surplus or net deficit of budget as a ratio to GDP for each country and year. As expected, the component of error is marked with ε it . The parameters are b 0 , b 1 , b 2 , b 3 .
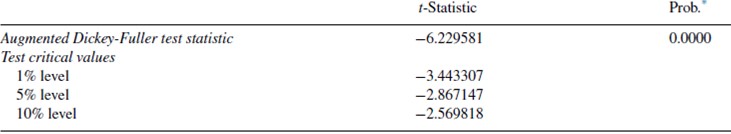
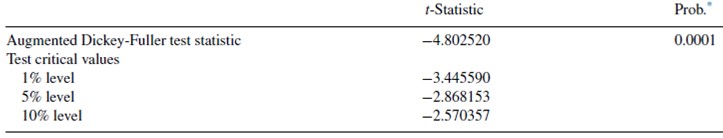
The Ordinary Least Squares (OLS) method is adopted as an estimating technique. Along with the simple estimations, more precise procedures are also adopted. Reffering the experience of other economists (Ehdaie, 1994), we use the lagged values of the variables as instrumental variables. The procedures of the Ramsey RESET test and the White heteroskedasticity test are applied in searching for linear-structure breaks and heteroskedasticity. In cases of breaks of the traditional linear structure of the regression, non-linear functional forms will be expressed. In a case of heteroskedasticity, the technique of two-stage least squares will be applied. The test of Durbin-Watson indicates the presence and kind of serial correlation. Augmented Dicky-Fuller test is performed to check for unit root in the dynamics of each variable.
The study covers annual data for the period 1996-2013, retrieved from the Eurostat database.
After some rearrangements in the generalized specification, we are able to get understanding about the growth-friendliness of the tax structure. It is presented as disaggregate of the total amount of revenue into separate tax items by economic function. The total amount of government spending remains its place in the regression, while the variable of budgetary balance is removed, because the surplus and deficit are mostly caused by deviations in the tax collections and in this sense have secondary importance. Thus, the main purpose of the analysis is to estimate consistency of each tax with the economic growth. On this base, we could infer about what type of tax structure is more conductive to growth.
Regression results
The dynamics of the aggregate variables are free of unit root, which is confirmed by the Augmented Dicky-Fuller (ADF) tests presented in Appendix.
As a starting point of the analysis, a check for breaks in the linear structure of the model has been run. The test of Ramsey confirms the existence of such breaks (Table 1). It implies that non-linear links will describe the relations between the aggregate variables of fiscal policy and output.
Table 1 Ramsey RESET Test on the specification with aggregate variables.

Source: Authors’ calculations using data from Eurostat.
The parameters of the regression are estimated under the full version of equation. Moreover, separate simple one-factor regressions are also run for the relation of each independent variable and the dependent variable. The estimating procedure was applied to an annual data panel for the EU-28 member states. Running regression under full version enables us to test for heteroskedasticity. The outputs of the White Heteroskedasticity test confirm the presence of the phenomenon of heteroskedasticity (Table 2). Thus, the application of two-stage least squares method is justified for obtaining more reliable results (Table 3).
Table 2 White Heteroskedasticity Test on the specification with aggregate variables.

Source: Authors’ calculations using data from Eurostat.
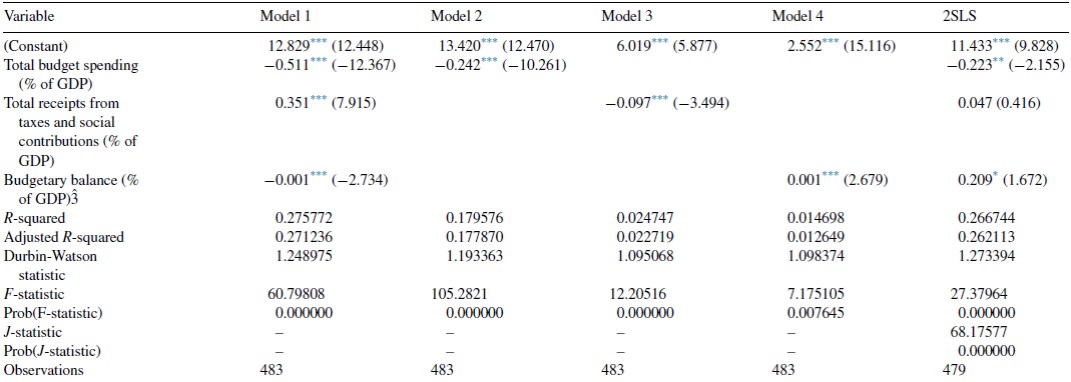
Table 3 Effects of fiscal policy on the economic growth in the EU-28 member states.
Source: Authors’ calculations using data from Eurostat.
Note: t-test in parenthesis.
* Significant at 10%.
** Significant at 5%.
*** Significant at 1%.
As noted above, this version of the model makes it possible to estimate the effects of fiscal policy on economic growth in the EU-28 member states. These estimations imply that one quarter of the deviations of the growth are explained by the work of fiscal policy instruments. The one-factor regressions also fill details in the general picture. As seen, the government expenditure and budgetary balance have great importance for the EU economies, as far as these variables explain a high share of the economic growth deviations.
The first model testifies to a net negative effect of the government spending on the economic growth in the sample of EU-28 member states for the period 1996-2013. Similar evidence is drawn by the results estimated via instrumental variables. The link is linear and the coefficient has the highest value among all parameters of the model. The large amounts of inefficient expenditure can provide explanation for the results. Some governments have spent more than one half of GDP and such ratios have been maintaining for decades in the richest European countries. According to predatory state framework, governments invade in many spheres where private capital could have a better performance.
These results are supported by a variety of studies. Nantob (2014) concludes that negative relationship between public expenditures and economic growth is due to the distortionary effect of high income taxes on economic growth. It is well known that the scope of government tends to increase with the level of income. This tendency is commonly called Wagner's Law, and is often said to imply that the income elasticity of demand for government is larger than unity. But this relationship is weakened at the highest levels of income. Easterly and Rebelo (1993) show that there is a strong positive relationship between government size and per capita income both across a large sample of countries at a point in time (1985) and for a panel of 28 countries from 1870 to 1988, but this relationship disappears at the highest levels of income. Folster and Henrekson (2001) report many regressions, which show a robust negative relationship between economic growth and government size in a panel of rich countries, covering the 1970-95 period. In accordance, Schaltegger and Torgler (2006) concentrated on the relationship between public expenditure and economic growth within a rich country using the full sample of state and local governments from Switzerland over the 1981-2001 and found a fairly robust negative relationship between government size and economic growth.
Barro (1991) analyzed (among other variables) the ratio of real government consumption expenditure to real GDP as a regressor, and found a significantly negative correlation with growth for 98 countries in the period 1960-1985. Paparas and Richter (2015) applied regressions in order to highlight the relationship between fiscal policy and economic growth in the EU-15 for the period 1995-2008 and found a negative impact of spending on human capital accumulation on economic growth. At the same time they noted that increase in government spending on infrastructure has a significant positive impact on the economic growth of a country.
Andersen and Jordan (1968) have estimated a weak positive effect of government expenditure in the quarters in which spending increases, but the effects are negative in the other quarters. They consider these results as consistent with modern quantity theories, which hold that government spending, taxing, and borrowing policies would have, through interest rate and wealth effects, different impacts on economic activity under varying circumstances.
The large amounts of government expenditure entail permanent budgetary deficits over the period. Therefore, positive regression coefficient would be expected for the impact of budgetary balance, i.e. shifting to balanced budget (and even to budgetary surplus in the peak of economic cycle) would be useful for the economic growth. The coefficient estimated via instrumental variables provides reliable evidence on those expectations. The simple-technique output show a weak non-linear relation, which implies a curve with optimum states of budgetary balance.
The parameters of first model indicates a positive influence of the tax revenues on economic growth in the EU-28 member states. In spite of having a lower value than this of government spending it is statistically significant. Third model gives a negative significant coefficient, but the explanatory power and adequacy of the model are ambiguous. The result obtained via instrumental variables is positive, but unfortunately insignificant. Despite the lack of unambugues evidence on the sign, it would be reasonable to suspect positive effects of taxation on economic growth. The literature does not provide a consensus about the nature and significance of the relationship taxation - growth; however, our results are in compliance with those of several studies. Mobilizing a dynamic panel data specification over the period 1989-2012, Nantob (2014) found that weak and high tax rates respectively at short run and long run do not create distortions and hence affect positively economic growth. Aghion, Akcigit, Cagé, and Kerr (2016) studied the relationships between taxation, corruption, and economic growth using state- and county-level variations within the United States over the 1983-2007 period, and reported significantly positive marginal effect of taxation for growth for a state with low levels of corruption.
Taking into account the results of the regressions, we could conclude about the general directions of development of the fiscal policy in the EU-28 members. Thus, efficient cure against economic weakness is decrease in the government expenditure, balanced budget, and tax structure, conductive to growth. This recommendation is applicable in spite of statements that the fulfilment of the Maastricht criteria is complicated under the conditions of a global financial crisis (Todorov, 2014).
A variety of empirical studies are searching for an optimum tax structure. In this sense, our research provides one more estimate and a few more suggestions for growth-conductive taxation.
As mentioned above, the specification of the model is modified in order to study the effects of separate taxes on economic growth. The revenue variable is differentiated into separate tax items, the expenditure variable remains unchanged, while the variable of budgetary balance is removed from the equation. Separate specifications of the model have been constructed by different combinations of right-hand variables. Thus, we get specifications through which estimate the entire tax structure (Model 1), as well as the effects of indirect taxes, direct taxes and social contributions, respectively second and third model (Table 6).
Table 4 Ramsey RESET Test on the specification with separate tax items.

Source: Authors’ calculations using data from Eurostat.
Table 5 White Heteroskedasticity Test on the specification with separate tax items.

Source: Authors’ calculations using data from Eurostat.
Table 6 Tax structure and economic growth in the EU-28 member states, OLS Estimates.

Source: Authors’ calculations using data from Eurostat.
Note: t-test in parenthesis.
* Significant at 5%.
** Significant at 1%.
The ADF tests in Appendix found a unit root in the dynamics of the receipts from property taxes. Thus, the parameters of the model will be estimated with using first difference of the annual values of this variable.
The Ramsey test found a significant break in the linear structure of the model (Table 4). It means that this model will include non-linear relationships. Non-linear links will not be expressed in the estimation that uses first difference, because the intention here is to underline the impact of the variable which is integrated at different level.
However, the phenomenon of heteroskedasticity has been indentified by the test of White (Table 5). The next step is to run regressions using instrumental variables, presented in Table 7.
Table 7 Tax structure and economic growth in the EU-28 member states, 2SLS estimates.

Source: Authors’ calculations using data from Eurostat.
Note: t-test in parenthesis.
* Significant at 5%.
** Significant at 1%
First model includes total government spending and all tax items, comprised by the tax burden - taxes on land, buildings and other structures, individual income tax, tax on corporate profits, taxes on production and imports, value added type taxes, and social contributions. Thus, the model expresses the impact of total government expenditure and the structure of tax revenues on the economic growth. The results show the negative influence of total government spending on the growth, which is also confirmed by the two-stage least squares estimations (2SLS).
The tax items reveal a varicolored picture of impacts. The property taxes have a positive insignificant coefficient and the use of first difference does not change the picture. At the same time the estimation under the two-stage procedure reports a negative insignificant coefficient, so there is no reason to make a reliable conclusion about the nature and significance of this relationship. It seems that property taxes in the EU-28 are neutral to the economic growth.
The personal income tax and social contributions have strong positive effects on growth, which is confirmed by the 2SLS estimates. The impact of the corporate taxes seems to be positive but the relationship is very weak. Moreover, the coefficients lose their significance in calculations using instrumental variables. The assumption for growth-conductive direct taxation in the EU-28 member states is confirmed by the second model, although it is not consistent with the results of some of the empirical studies. Confirmation is found by Canavire-Bacarreza et al. (2013), Bernardi (2013), Stoilova and Patonov (2013), Havránek et al. (2015), Tanchev (2016). On the opposite side are the results of Kneller, Bleaney, and Gemmell (1999), Widmalm (2001), Dackehag and Hansson (2012), which estimated depressing effects of income taxes.
The taxes on productions and imports demonstrate the strongest positive linear relationship with economic growth, confirmed by the estimation with instrumental variables. This result is in line with the economic theory. Taxes on consumption are generally recommended as growth-conducive (Zipfel & Heinrichs, 2012), due to the presumption that tax system, more heavily relied on consumption, minimizes the distorting effects of taxation on the growth factors (labour, capital and technological progress).
At the same time, consumption tax like value added tax (VAT), shows negative influence on the economic growth. VAT is intended to be an universal proportional tax on consumption, but actually has a variety of exceptions and reduced rates across EU-28 member states that makes it far form efficiency, flexibility, justice and, of course, consistency with growth. Moreover, the relationship has a cubic form that implies curve with optimum values of the VAT collection. The negative effect of the value added taxes on economic growth is also confirmed by the estimations of third model. As a whole, the results imply that the society does not gain economic benefits by imposing value added taxes. However, economic efficiency is supported by the taxes of selective type like those levied on productions and imports.
Conclusions
Since the financial crisis, the EU-28 member states have faced the difficult challenge of consolidating their budgets while at the same time promoting economic growth. One possible approach would be to reconsider the design of their respective tax systems. A variety of studies claim that raising consumption taxes while at the same time lowering taxes on labour and capital can stimulate the economy's growth forces. At the same time, other studies note that taxation and tax structure would have different impacts on economic activity for different countries and periods and under varying circumstances. In this respect, our research provides one more estimate and a few more suggestions for growth-conductive taxation.
The empirical results proved that government expenditure do not contribute to an increase in the annual GDP growth rate in the EU-28 member states, while total tax revenues seem to be less harmful for the growth. In this line, balanced budgets are predicted to be growth-friendly.
Optimum design of a tax system depends on numerous factors and differs from country to country. However, some taxes proved to be less harmful to growth. The taxes on productions and imports demonstrate a strong positive impact on economic growth, but the empirical results imply that imposing value added taxes affects negatively EU-28 economies. The property taxes are neutral to the economic growth, while the personal income tax and social contributions have positive effects.
However, robust political recommendations should also be based on country-specific criteria such as the design of the tax system, social redistribution preferences and the overall volume of tax revenues. Last but not least, empirical analysis is hampered by the fact that quite often structural and cyclical effects on the tax structure are hard to differentiate.