SciELO - Scientific Electronic Library Online

 
vol.49Evaluation of fish density influence on the growth of the spotted rose snapper reared in floating net cages using growth models and non-parametric testsEffect of 4 microalgal diets on the proximal composition, chlorophyll concentration, and total carotenoid content in Artemia franciscana author indexsubject indexsearch form
Home Pagealphabetic serial listing  

Services on Demand

Journal

Article

Indicators

Related links

  • Have no similar articlesSimilars in SciELO

Share


Ciencias marinas

Print version ISSN 0185-3880

Cienc. mar vol.49  Ensenada Jan./Dec. 2023  Epub Mar 08, 2024

https://doi.org/10.7773/cm.y2023.3384 

Articles

Where are resilience-based management strategies appropriate for coral reefs? Mapping environmental conditions and trends in coral cover in Guam and American Samoa

Monica M Moritsch1  * 
http://orcid.org/0000-0002-3890-1264

Miranda Foley2 

1U.S. Geological Survey, Western Geographic Science Center, Moffett Field, California, United States of America.

2Ecologic Consulting, LLC, Kailua, Hawaii, United States of America.


Abstract

Resilience-based management strategies are gaining attention as tools to improve coral survival and recovery under increasingly stressful conditions. Prioritizing locations to implement these strategies depends on knowing where corals already show potential signs of resilience and how environmental conditions may shift with climate change. We synthesized environmental conditions and coral cover trends in Guam and American Samoa using present-day climate conditions and 2 future climate scenarios: Representative Concentration Pathways 4.5 and 8.5. We examined the spatial overlap between favorable and unfavorable environmental conditions and locations where coral reefs have maintained or increased coral cover over the past decade. Locations representing 4 combinations of the aforementioned characteristics may be subject to different management strategies: (1) conservation and restoration of robust corals, (2) restoration of declining corals, (3) conservation of genetic material of robust corals and stressor mitigation, and (4) no clear strategy for declining corals. We estimated areas in which multiple management actions could be performed based on these combinations. Under present-day climate conditions, the conservation of genetic material and stressor mitigation were overrepresented in Guam, comprising 23% of the study area; this declined to 15% in future climate scenarios. Coral restoration was at first underrepresented (0%). In American Samoa, the proportional area for each strategy remained consistent regardless of climate. Coral restoration was overrepresented, comprising 54% to 56% of the study area, whereas the conservation of genetic material and stressor mitigation were underrepresented (9% to 11%, respectively). Our approach offers a rapid way to assess where potential management actions could be applied based on data aggregated over large spatial extents, which can complement more detailed, labor-intensive assessments of reef community dynamics, particularly if distinct coral communities inform the boundaries of aggregation units. These results may guide managers in selecting ecologically suitable locations for implementing resilience-based management strategies for coral reefs.

Key words: resistance; recovery; resilience; coral bleaching; climate change

Resumen

Las estrategias de gestión basadas en la resiliencia están ganando atención como herramientas para la supervivencia y recuperación de corales en condiciones crecientemente estresantes. La priorización de sitios para aplicar estrategias depende de dónde los corales muestran signos de resiliencia y cómo las condiciones ambientales pueden cambiar con el cambio climático. Sintetizamos las condiciones ambientales y tendencias de cobertura de coral en Guam y Samoa Americana utilizando condiciones climáticas actuales y 2 escenarios climáticos futuros: trayectorias de concentración representativas 4.5 y 8.5. Examinamos la superposición espacial entre condiciones ambientales favorables y desfavorables y lugares en los que arrecifes de coral mantuvieron o aumentaron su cobertura en la última década. Ubicaciones que representan 4 combinaciones de las características mencionadas pueden presentar diferentes estrategias de gestión: (1) conservación/restauración de corales robustos, (2) restauración de corales en declive, (3) conservación del material genético de corales robustos/mitigación de factores estresantes y (4) ninguna estrategia clara para corales en declive. En función de estas combinaciones, estimamos áreas potenciales para implementar múltiples acciones de gestión. Bajo condiciones climáticas actuales, la conservación del material genético/mitigación de factores estresantes estaban sobrerrepresentadas en Guam: 23% del área que disminuyó a 15% en escenarios futuros. La restauración del coral estaba inicialmente subrepresentada (0%). En Samoa Americana, la superficie proporcional para cada estrategia fue constante. La restauración del coral estaba sobrerrepresentada con 54-56% del área; la conservación del material genético y mitigación de factores estresantes estaban infrarrepresentadas (9% y 11%, respectivamente). Nuestro enfoque ofrece una forma rápida de evaluar dónde aplicar medidas de gestión con datos agregados sobre grandes extensiones para complementar evaluaciones detalladas y laboriosas de la dinámica de comunidades arrecifales, especialmente si las distintas comunidades coralinas delimitan las unidades de agregación. Estos resultados pueden orientar a gestores para seleccionar sitios ecológicamente adecuados para aplicar estrategias basadas en la resiliencia.

Palabras clave: resistencia; recuperación; resiliencia; blanqueamiento coralino; cambio climático

Introduction

Coral reefs are critical providers of food, coastal protection, recreational opportunities, economic opportunities, and cultural value (Barbier et al. 2011, Reguero et al. 2021). Coral bleaching events in the past decade have inflicted severe mortality to reefs worldwide (Stuart-Smith et al. 2018, Raymundo et al. 2019, Raj et al. 2021). Chronic stress from land-based sources of pollution and sedimentation threaten the ability of reefs to continue providing these services (Bruno et al. 2003, Fabricius 2005). Increasingly frequent coral bleaching events represent an acute stressor overlaying chronic issues (Heron et al. 2016). As major disturbances become more frequent due to climate change, the probability of long-term ecosystem shifts increases, which may disrupt the provision of reef-based services to island communities (Norström et al. 2009, Pratchett et al. 2009).

Strategies that promote climate resilience are receiving attention as the consequences of bleaching events increasingly affect vast swaths of the ocean (Comte and Pendleton 2018). By focusing on resilience, defined as the ability to either resist shifting to a different ecosystem state or to recover quickly to the original state following disturbance-induced change (Holling 1973, Kenneth et al. 2015), managers seek to maintain ecological processes that allow coral survival, growth, recovery, and recruitment. Resilience-based management (RBM) strategies include coral outplanting in climate refuges, conserving reefs with a history of low mortality during bleaching events, and maintaining healthy herbivore populations to reduce algal overgrowth (Graham et al. 2013, Maynard et al. 2015, Chung et al. 2019, Mcleod et al. 2019).

Resilience-based management is more likely to succeed when implemented under unstressful conditions or in stress-tolerant populations. Areas not subject to climate-related stress will become increasingly rare in the next century. Contrasting gradients in projected heat stress and acidification suggest that few locations will be true climate refuges maintaining twentieth-century conditions (van Hooidonk et al. 2014). Strategies that manage and mitigate local stressors increase the ability of corals to withstand the consequences of global stressors. For example, reducing sediment and nutrient pollution from coastal watersheds is important for ensuring clear water and reducing algal overgrowth in coral reefs, particularly in the wake of damage from bleaching events or storms (Smith et al. 2010, Risk and Edinger 2011).

Coral species that experience high temperature variability or that are regularly exposed to high temperatures can evolve to increase their thermal tolerance, highlighting the importance of corals that survive under sub-optimal environmental conditions (Safaie et al. 2018, Schoepf et al. 2020). Likewise, coral and endosymbiont taxa differ in their tolerance to nutrient pollution and contaminants, resulting in variable spatial distributions of corals capable of adapting or acclimating to multiple stressors (Fox et al. 2021, Nalley et al. 2021). Thus, coral characteristics influence which RBM strategies are appropriate for each coral species or population. Indeed, populations exhibiting tolerance to stressful conditions over time may be good candidates for additional conservation measures and can provide genetic material to restore corals elsewhere (Oliver and Palumbi 2011, Safaie et al. 2018). In addition, sites not subject to stressful or extreme environmental conditions may be good locations for restoration measures (Foo and Asner 2020; Table 1).

Table 1 Conceptual categorization of example resilience-based management strategies. The examples are arranged along 2 axes: (1) Coral resilience and (2) environmental favorability. The 4 resulting quadrants may be subject to different reef management strategies. 

Environmental favorability Coral resilience
Low or positive change, high stability Negative change, low stability
Favorable environment Conserve or restore Restore coral
Unfavorable environment Conserve coral
Genetic material
Mitigate stressors
Neither

Geographic assessments that identify either resilient coral populations or favorable environmental conditions are used to inform management recommendations throughout the Pacific Islands region, including those in Guam, Hawaii, and the Commonwealth of the Northern Mariana Islands (Maynard et al. 2015, 2018; Chung et al. 2019a, b). Thus, the objective of this study was to identify locations in Guam and American Samoa where reef managers could implement RBM strategies under present-day conditions and in future climate scenarios.

Materials and methods

Study areas

Guam (13.4255° N, 144.7471° E) and American Samoa (14.3191° S, 170.7586° W) are volcanic islands surrounded by nearshore coral reefs. Both locations experienced multiple coral bleaching events over the last decade, sometimes in consecutive years. The decline in coral cover following a bleaching event has not occurred uniformly around the islands (Raymundo et al. 2017, 2019; NOAA 2018). Both locations also experience water quality problems due to land management practices and land-based sources of pollution (Houk et al. 2005, Shuler and Comeros-Raynal 2020). Geologically, Guam is comprised of limestone in the north and steep volcanic hillsides in the south that burn seasonally, generating large amounts of sediment runoff. Development and land clearing are also associated with high sedimentation rates (Kottermair 2012, Prouty et al. 2014). In the volcanic archipelago of American Samoa, most human activity occurs on the island of Tutuila, whereas the Manuʻa Islands (Ofu, Olosega, and Ta‘ū) to the east are lightly inhabited and are largely protected as part of the National Park of American Samoa. The remote Swains Island and Rose Atoll of American Samoa were not considered in this study due to data limitations.

Scoring environmental favorability

We assessed geographic patterns in environmental conditions to identify areas favorable for coral growth and survival. We gathered spatial data layers with sufficient resolution (≤10 km) to evaluate environmental variation around the islands (Table S1). We divided environmental conditions into 2 categories, “managed” and “globally influenced,” to differentiate conditions either under management or outside its control. Managed environmental conditions were those influenced by typical management levers up to the spatial scale of island, including chlorophyll concentrations (a proxy for land-based nutrient runoff), fish biomass, herbivore biomass, turbidity (a proxy for land-based sediment runoff), ocean-based pollution, and macroalgal cover. Globally influenced environmental conditions were those outside the control of managers at the island scale. These conditions either require global cooperation to affect substantial change or cannot be controlled and include calcite concentrations (a proxy for ocean acidity), ocean surface irradiance, thermal stress (degree heating weeks), and wave energy (Table S1). We excluded the ocean-based pollution layer for American Samoa from the analysis because it exhibited no spatial variability and did not contribute to our goal of discerning spatial differences in environmental conditions.

Following the approach of Maynard et al. (2018), we scaled each environmental variable linearly from 0 to 1 in ArcMap 10.7 (Environmental Systems Research Institute, Inc.), with 0 representing conditions least favorable to coral growth and survival and 1 representing the most favorable conditions (Fig. 1), scaling each jurisdiction separately. Each raster cell represented one data point with many environmental attributes (NGuam = 299, NAS = 7,766). We controlled for covariation between variables with a principal component analysis (PCA) using the ‘FactoMineR’ package (Lê et al. 2008) in R v. 4.1 (R Core Team 2021). We performed separate PCAs for the managed and globally influenced conditions (Supplementary material, Tables S2, S3). We linearly rescaled the principal components (PCs) from 0 to 1 based on the minimum and maximum values, with 1 representing the most favorable conditions. We averaged these 2 PCs to obtain an overall score of environmental favorability (Fig. 1). The values with environmental favorability scores in the top 20th percentile served as a heuristic for “highly favorable environmental conditions”.

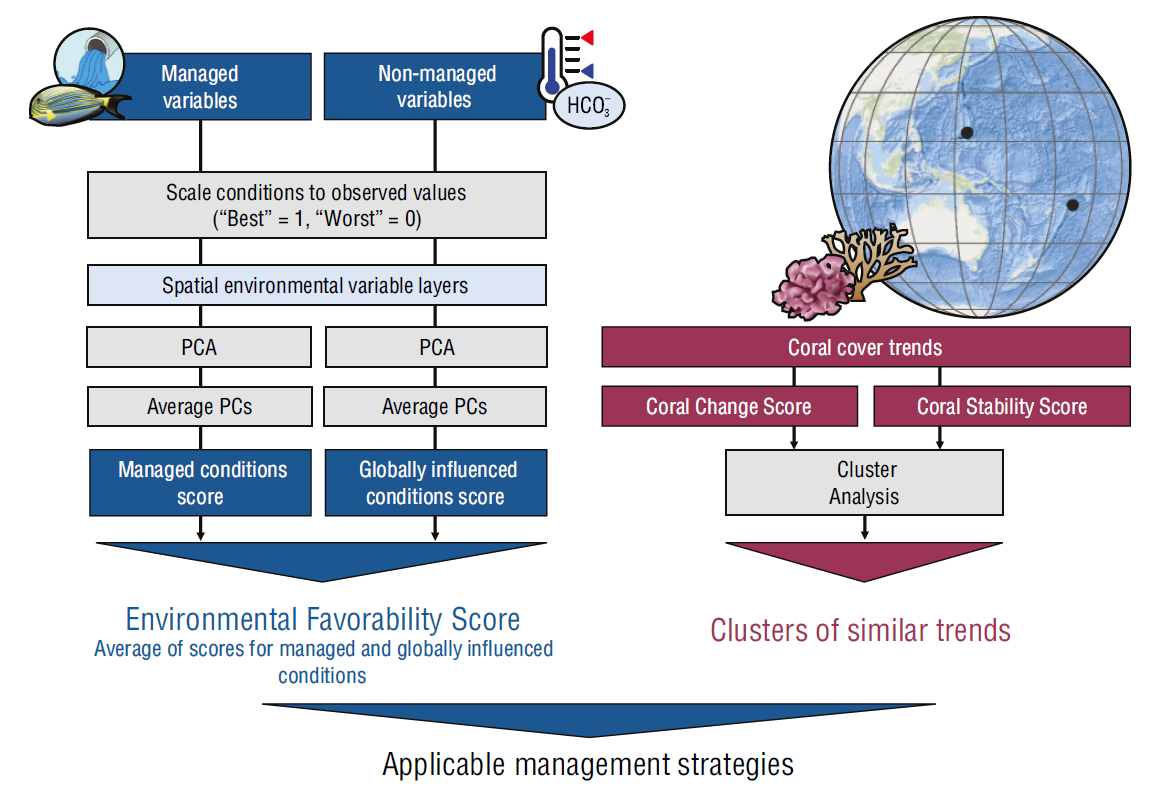
Figure 1 Overview of methods used to assess spatial patterns of environmental favorability and coral resilience. This process was repeated for each climate scenario. Black points on the globe represent study the locations, Guam (left) and American Samoa (right). PCA stands for Principal Component Analysis and PC stands for Principal Component. 

We assumed all input variables carried equal weight when contributing to the scores for managed and globally influenced conditions. Thus, we weighted the influence of these 2 sets of conditions on coral growth and survival equally. The degree to which environmental stressors synergistically affect coral reef ecosystems is location-specific (Ateweberhan et al. 2013, Houk et al. 2014), making variable weighting difficult to apply in our study areas. However, prior coral reef resilience assessments have also weighted all environmental conditions equally, including climatic and anthropogenic stressors (Maynard et al. 2015, 2018). We sought to account for potential correlation (Tables S4-S7) between environmental variables through the PCA, reducing the number of dimensions based on variables that increased or decreased in a coordinated manner (Bastazini et al. 2007, Jales-Cavalcanti et al. 2015, Moritsch 2018).

In addition to examining patterns under present-day climate conditions, we repeated this process for 2 future climate scenarios from global climate models representing conditions in 2100. Scenario 1, the intermediate emissions scenario, assumed greenhouse gas emissions stabilized mid-century, corresponding to Representative Concentration Pathway (RCP) 4.5. Scenario 2, the worst-case emissions scenario, assumed greenhouse gas emissions continued unabated, corresponding to RCP 8.5 (Riahi et al. 2011, Thomson et al. 2011). For the future climate scenarios, we replaced the present-day thermal stress layer with a layer of the projected timing of annual severe bleaching under RCP 4.5 or RCP 8.5 as a proxy for future thermal stress (van Hooidonk et al. 2016, UNEP 2017). We added soil erosion due to sea-level rise (SLR) as another future condition that could negatively impact corals by either reducing light availability for symbiont photosynthesis or increasing physiologically damaging sedimentation (Field et al. 2011, Storlazzi et al. 2011, Weber et al. 2012, Bessell-Browne et al. 2017). We measured the proximity to easily erodible soils, which SLR would inundate under RCP 4.5 and RCP 8.5, as a proxy for the severity of the effects of SLR (Supplementary material, erosion estimates related to SLR). Projections of the other globally influenced conditions (calcite concentrations, irradiance, and wave energy) were not available in a spatial resolution fine enough to discern geographic patterns within the jurisdictions, so we used the present-day climate scores for these 3 conditions for both future climate scenarios. We also assumed the managed conditions would remain the same across all scenarios because robust projections for how these conditions may change were not available.

Characterizing coral resilience

We used existing coral cover data from the National Oceanographic and Atmospheric Administration National Coral Reef Monitoring Program (NOAA NCRMP) to measure 2 aspects of coral resilience: the ability to recover coral cover quickly and the ability to resist change in coral cover over time. The NCRMP diver surveys recorded coral cover with multiple methods and sampling sites. These surveys excluded the reef flat zone, resulting in an underrepresentation of the complexity of coral cover dynamics across reef sites. For Guam, surveys from 2009 to 2017 were aggregated into 10 sectors of variable size that accounted for ecological similarities in substrate, coral communities, and benthic cover (Oliver et al. 2020a; Fig. 2a). We excluded data from 2016, when major storm events prevented adequate sampling for several sectors. For American Samoa, we used 11 coastal management sectors defined by NOAA (NOAA 2018) as units for measuring coral cover trends (Fig. 2b, c). Boundaries of the National Marine Sanctuary of American Samoa influenced sector boundaries, wherein geographically separated areas of the sanctuary were made into their own sectors. All sector names followed NOAA’s established naming conventions. We excluded the sector Tutuila Aunu‘u B due to insufficient data, leaving a total of 10 sectors. Annual sector-level averages, which were required due to the spatially variable sampling design of the NCRMP, were not conducive to identifying resilient coral populations at sub-kilometer scales.

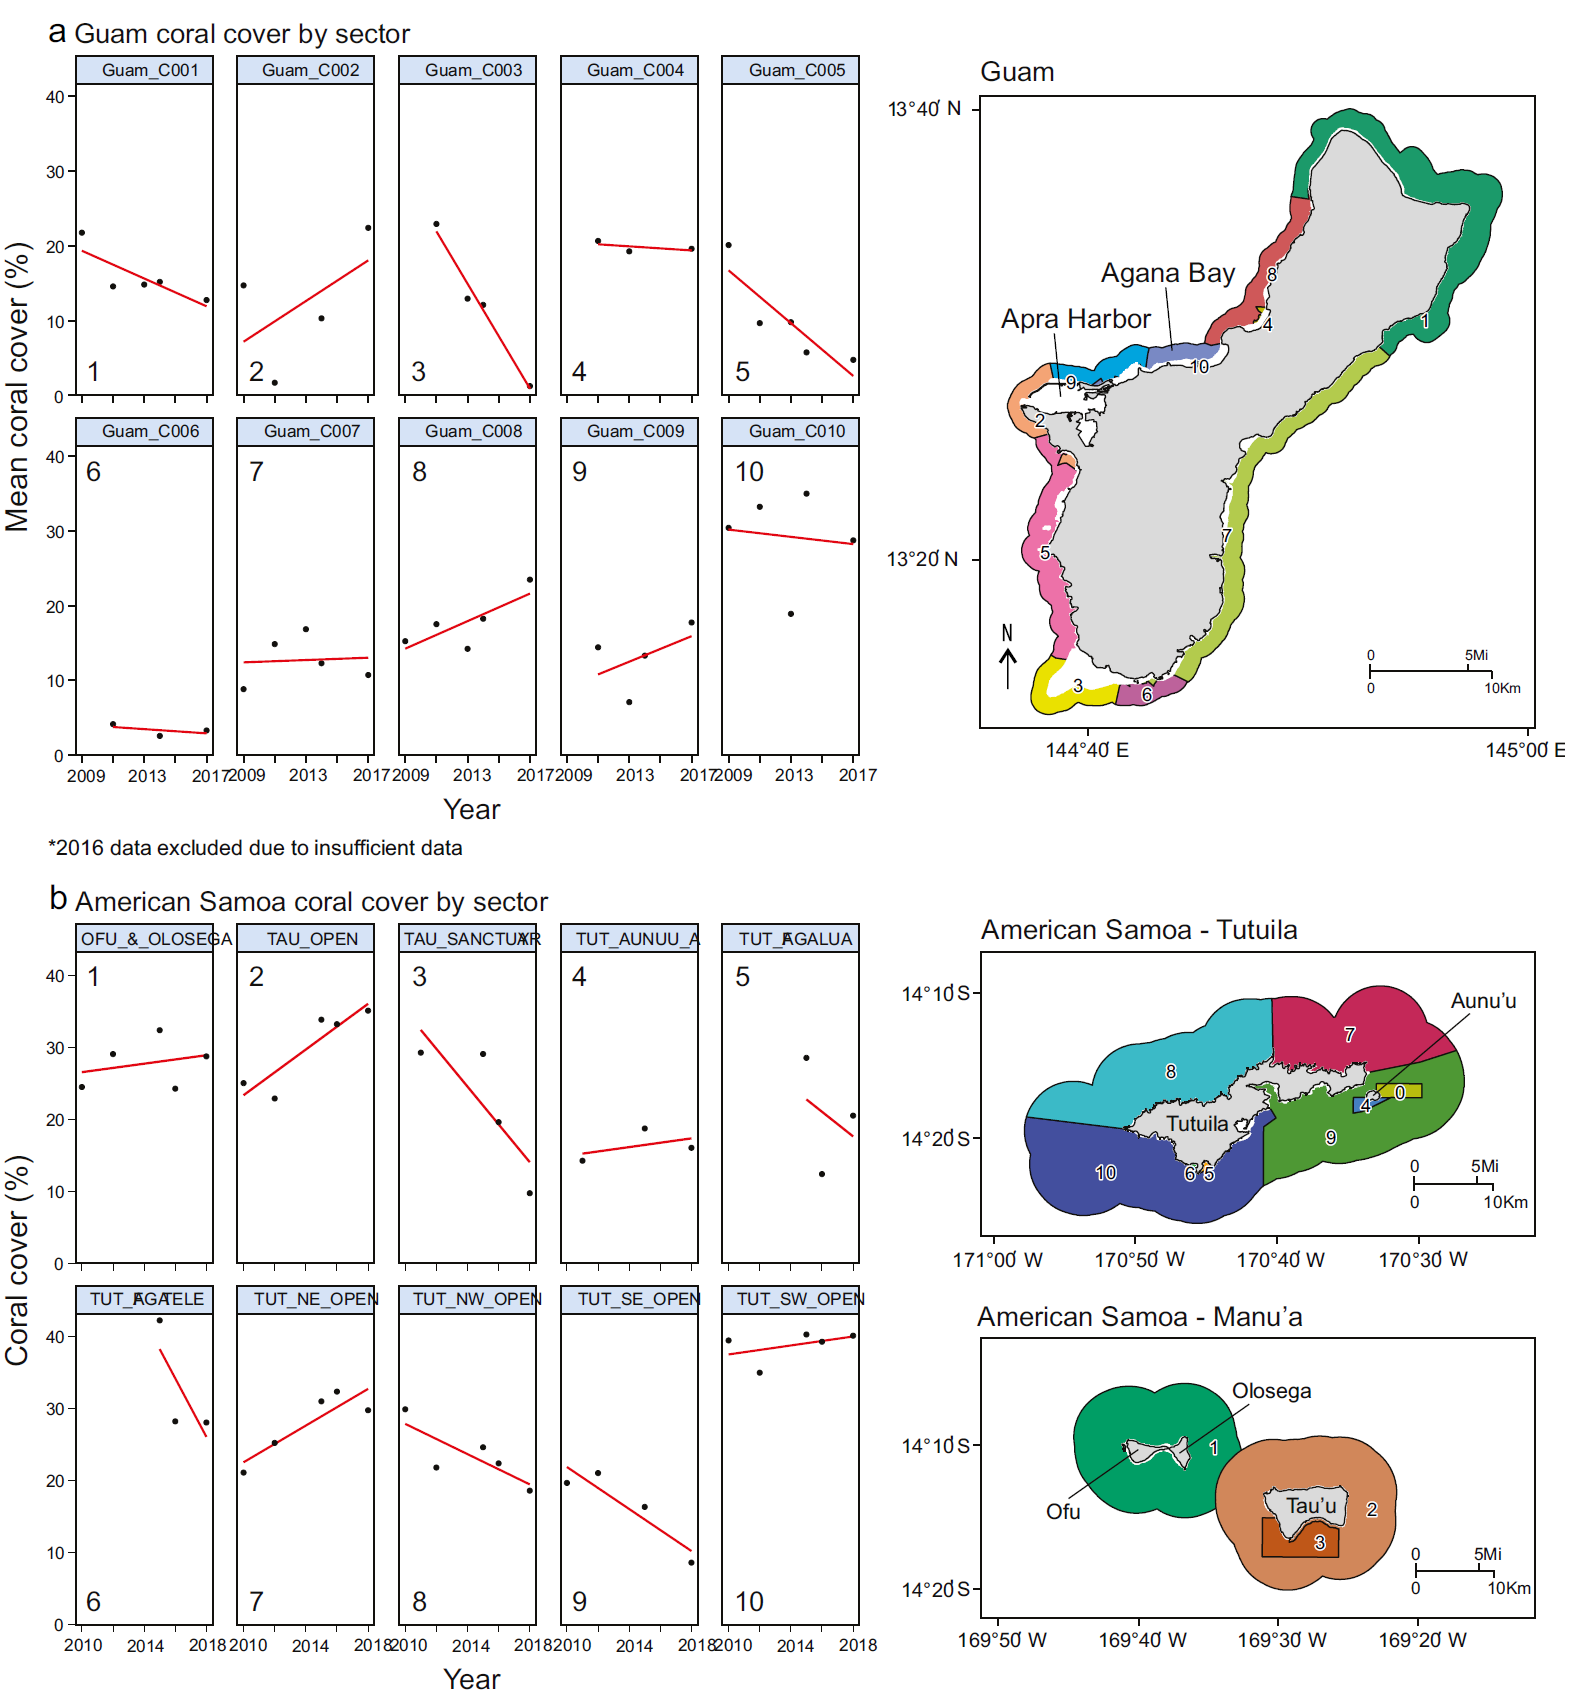
*Tutuila Aunnu B data excluded due to insufficient data

Figure 2 Mean percent coral cover by sector and map of sectors for (a) Guam and (b) American Samoa based on yearly aggregated data from the National Oceanographic and Atmospheric Administration National Coral Reef Monitoring Program. Trendlines are represented in red. Guam sectors are unnamed and are referred to by arbitrarily assigned numbers. Surveys from Guam in 2016 and from American Samoa sector Tutuila Aunu‘u B (labeled sector 0) in all years were excluded from analysis due to insufficient data. Map colors represent unique sectors. American Samoa sector names are: (1) Ofu and Olosega, (2) Ta‘ū Open, (3) Ta‘ū Sanctuary, (4) Tutuila Aunu‘u A, (5) Tutuila Fagalua, (6) Tutuila Fagatele, (7) Tutuila Northeast Open, (8) Tutuila Northwest Open, (9) Tutuila Southeast Open, (10) Tutuila Southwest Open. Reef flat, dredged, lagoon, back reef and intertidal areas are excluded from view. 

We quantified whether coral cover was increasing, a potential indicator of post-disturbance recovery, or remaining stable, a potential indicator of resistance to disturbance, by calculating a coral change score and coral stability score for every sector (Fig. 1). Without detailed information on the timing of stressors, we could not definitively determine whether coral cover demonstrated resilience. The coral change and coral stability scores did not account for species composition or biodiversity by sector, as this information was not available. These scores were calculated based on coral cover data alone; no environmental conditions were considered in calculating this score.

The coral change score (Equation 1) characterizes sectors according to their ability to rapidly increase coral cover without major fluctuations.

Equation 1. Coral change score

Puntuación de cambio en el coral = Signo de la pendiente de la cobertura del coral × slopeRMSE.

By using the slope of the coral cover trendline over time, rapid increases (positive slope) in coral cover resulted in higher positive scores, whereas rapid declines (negative slope) resulted in lower negative scores. Several sectors exhibited trendlines with non-significant slopes (P > 0.05), although these still suggested divergent trajectories for coral cover. Rather than remove these sectors due to their lack of significance, we incorporated root mean square error (RMSE) as a term to reflect the limited confidence in trend direction in these sectors. We divided the slope of the sector trendline by its RMSE so that sectors with high variability in coral cover received scores closer to zero than sectors with low variability, indicating weaker positive or negative trajectories. We square root-transformed the output to minimize the impact of outliers in the scores, such that the range of coral change scores was similar for Guam and American Samoa.

For the coral stability score (Equation 2), we characterized sectors according to their ability to maintain steady levels of coral cover over time without major fluctuations.

Equation 2. Coral stability score

Stability score = Inmean coral coverRMSE ×slope+1.

Sectors with higher mean coral cover over the entire sampling period received higher scores than sectors with lower mean coral cover. By dividing by the slope and RMSE, rapid increases or decreases in coral cover or high variability around the trendline resulted in low scores. We natural log-transformed the output to minimize the impact of outliers in the scores.

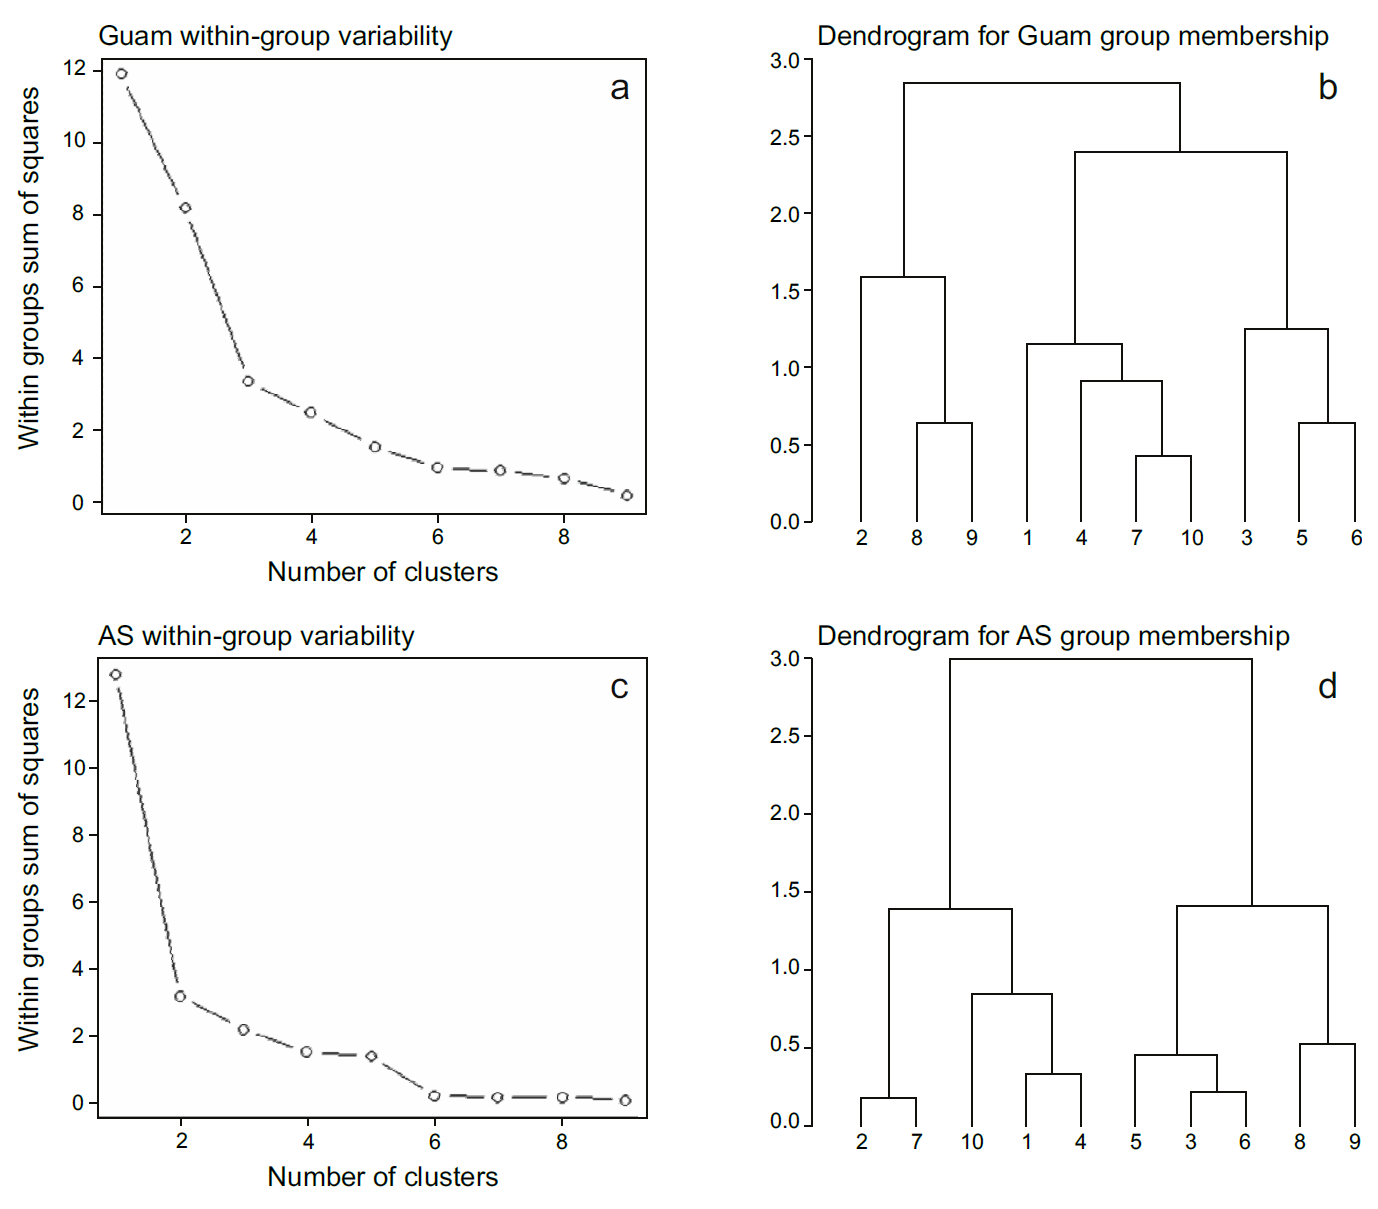
To facilitate comparisons among environmental favorability scores between sectors with similar dynamics in coral cover, we performed a cluster analysis using the coral change and stability scores of each sector to identify groups with statistically similar scores. Using the kmeans function of the ‘cluster’ package (Maechler et al. 2023) in R, we selected the optimal number of groups based on precipitous drops in the within-group sum of squares (Fig. S1). This function also assessed group membership for each sector (Fig. S1).

Identifying areas of overlap between coral resilience and favorable environmental conditions

We calculated the area of overlap between highly favorable environmental conditions and groups of coral sectors with similar cover trends using the cell center method to convert all raster grid cells to squares of the same area. We identified the spatial intersection between the resulting polygons representing environmental favorability scores ≥0.80 and sector polygons in ArcMap 10.7 (ESRI). We also identified the intersections between sectors with environmental favorability scores <0.80. Based on this overlap, we found the area in each quadrant corresponding to the potential management actions listed in Table 1 to determine the proportion of each jurisdiction that could be subject to different RBM strategies. We used a chi-squared test to determine whether these proportions were significantly different than expected at random.

Results

Environmental favorability

Under present-day climate conditions, the northeastern side of Guam exhibited the highest environmental favorability. This area had intermediate to high environmental favorability scores for managed conditions (0.50 to 0.80) and high environmental favorability scores for globally influenced conditions (>0.75). The lowest scores for managed conditions (0.22 to 0.35) were concentrated on the western side of the island around Apra Harbor. In contrast, the lowest scores for globally influenced conditions (≤0.30) were located in the southwestern quadrant of the island. High environmental favorability (≥0.70) scores were found in the northern half of Guam, and low scores (0.10 to 0.35) were present along the southwestern side (Fig. 3a).

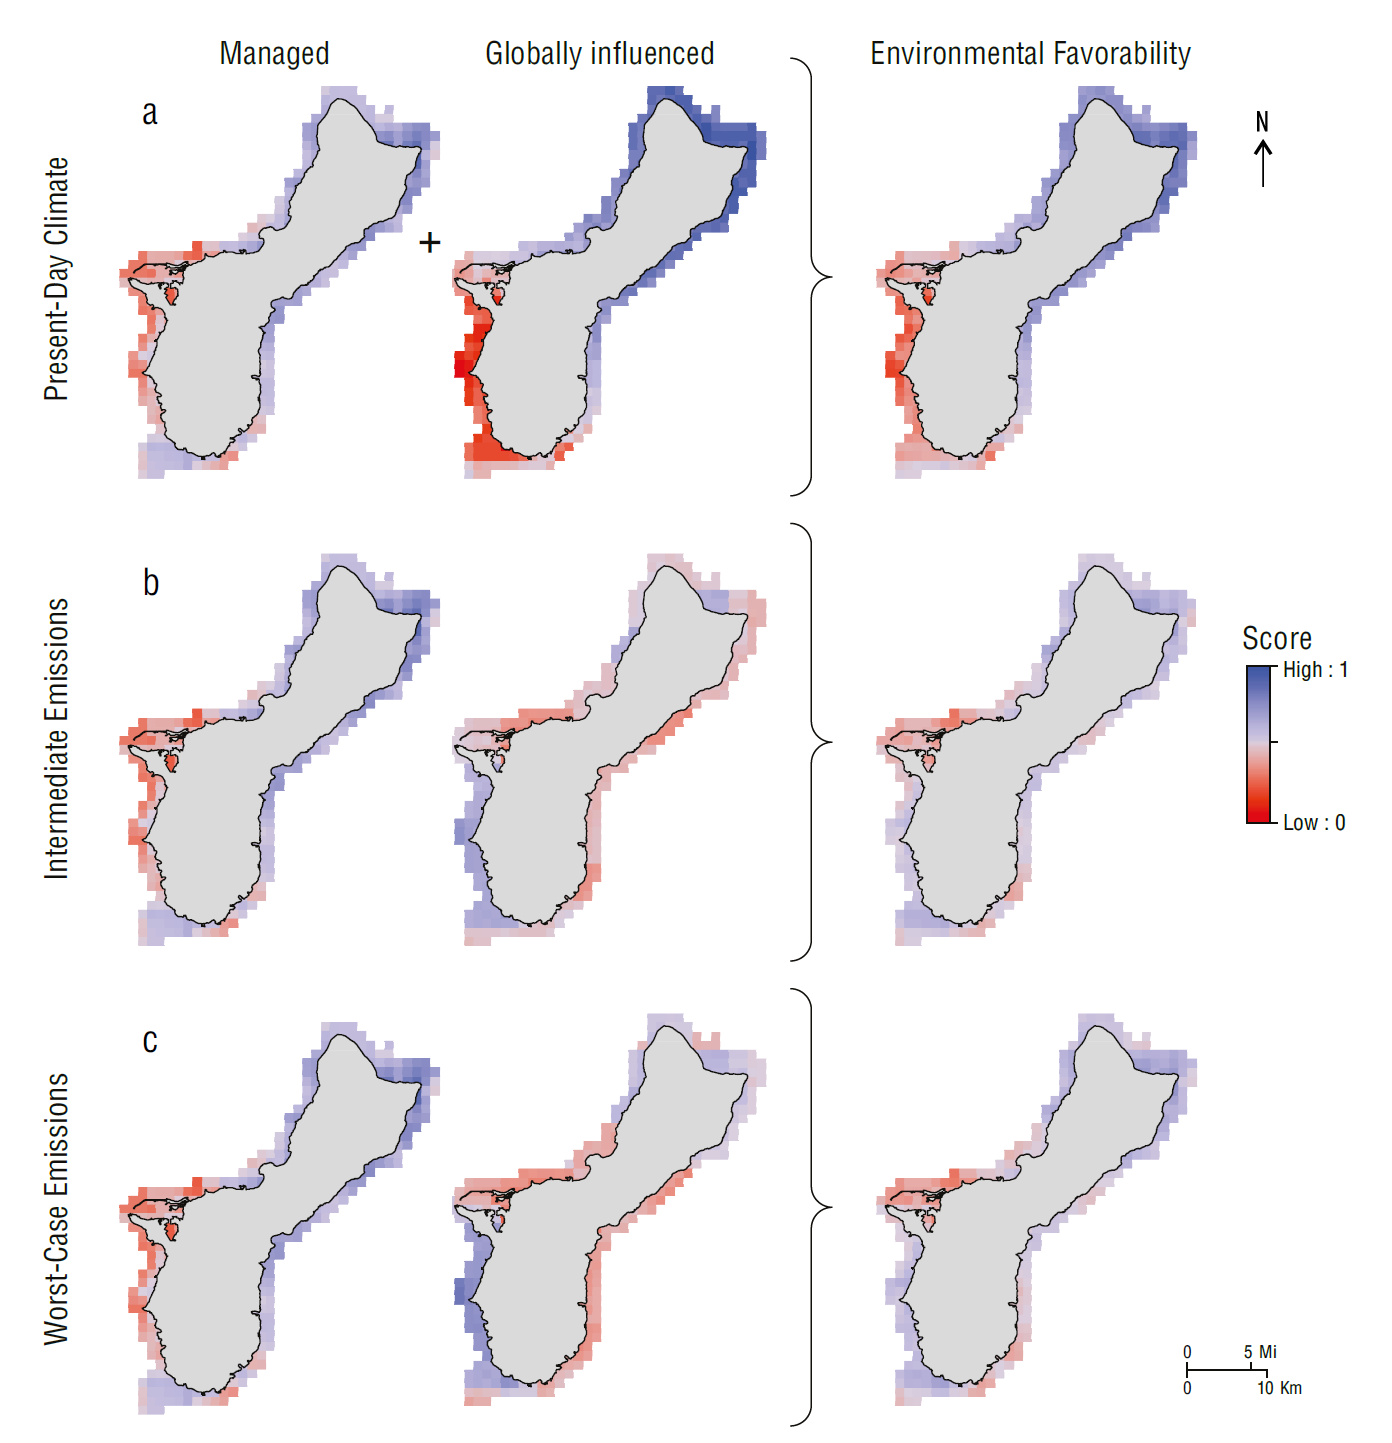
Figure 3 Scores for managed conditions, globally influenced conditions, and environmental favorability in Guam for the (a) present-day climate, (b) intermediate emissions scenario, and (c) worst-case emissions scenario. Scores for managed conditions remained the same across future climate scenarios. Red colors correspond to lower favorability and worse conditions for coral. Blue colors correspond to higher favorability and better conditions for coral. 

In the intermediate emissions and worst-case emissions scenarios, this pattern was reversed. The globally influenced conditions were more favorable along the southwestern side, largely because this portion of the island is projected to experience thermal stress capable of severe annual bleaching farther into the future than the northern side. The highest relative environmental favorability scores occurred in the southwest and north, although the differences between the best- and worst-scoring locations were not as pronounced as those under the present-day climate (Fig. 3b, c).

Under present-day climate conditions in American Samoa, the environmental favorability scores for managed conditions were lowest (0.00 to 0.40) along the southeastern side of Tutuila, while intermediate scores (0.35 to 0.65) were found around the southwestern side, and the highest scores were detected around the northwestern side (>0.65). The Manuʻa Islands had relatively high (>0.65) scores for managed conditions, with the exception of a small pocket at the southwestern corner of Ofu (Fig. 4a). This pattern reflected a confluence of relatively benign conditions for multiple contributing environmental variables, with no single condition determining the locations of high scores. In contrast, the highest scores for globally influenced conditions (>0.70) were concentrated around the southwestern side of Tutuila. The lowest scores (0.10 to 0.40) were found along the eastern tip of Tutuila and were accentuated by high thermal stress in the vicinity. The Manuʻa Islands exhibited a mixture of high and low scores for globally influenced conditions. The resulting environmental favorability scores were moderately low (≤0.40) around the eastern tip of Tutuila and moderately high (>0.65) everywhere else (Fig. 4a). These patterns were similar for the intermediate emissions and worst-case emissions scenarios (Fig. 4b,c).

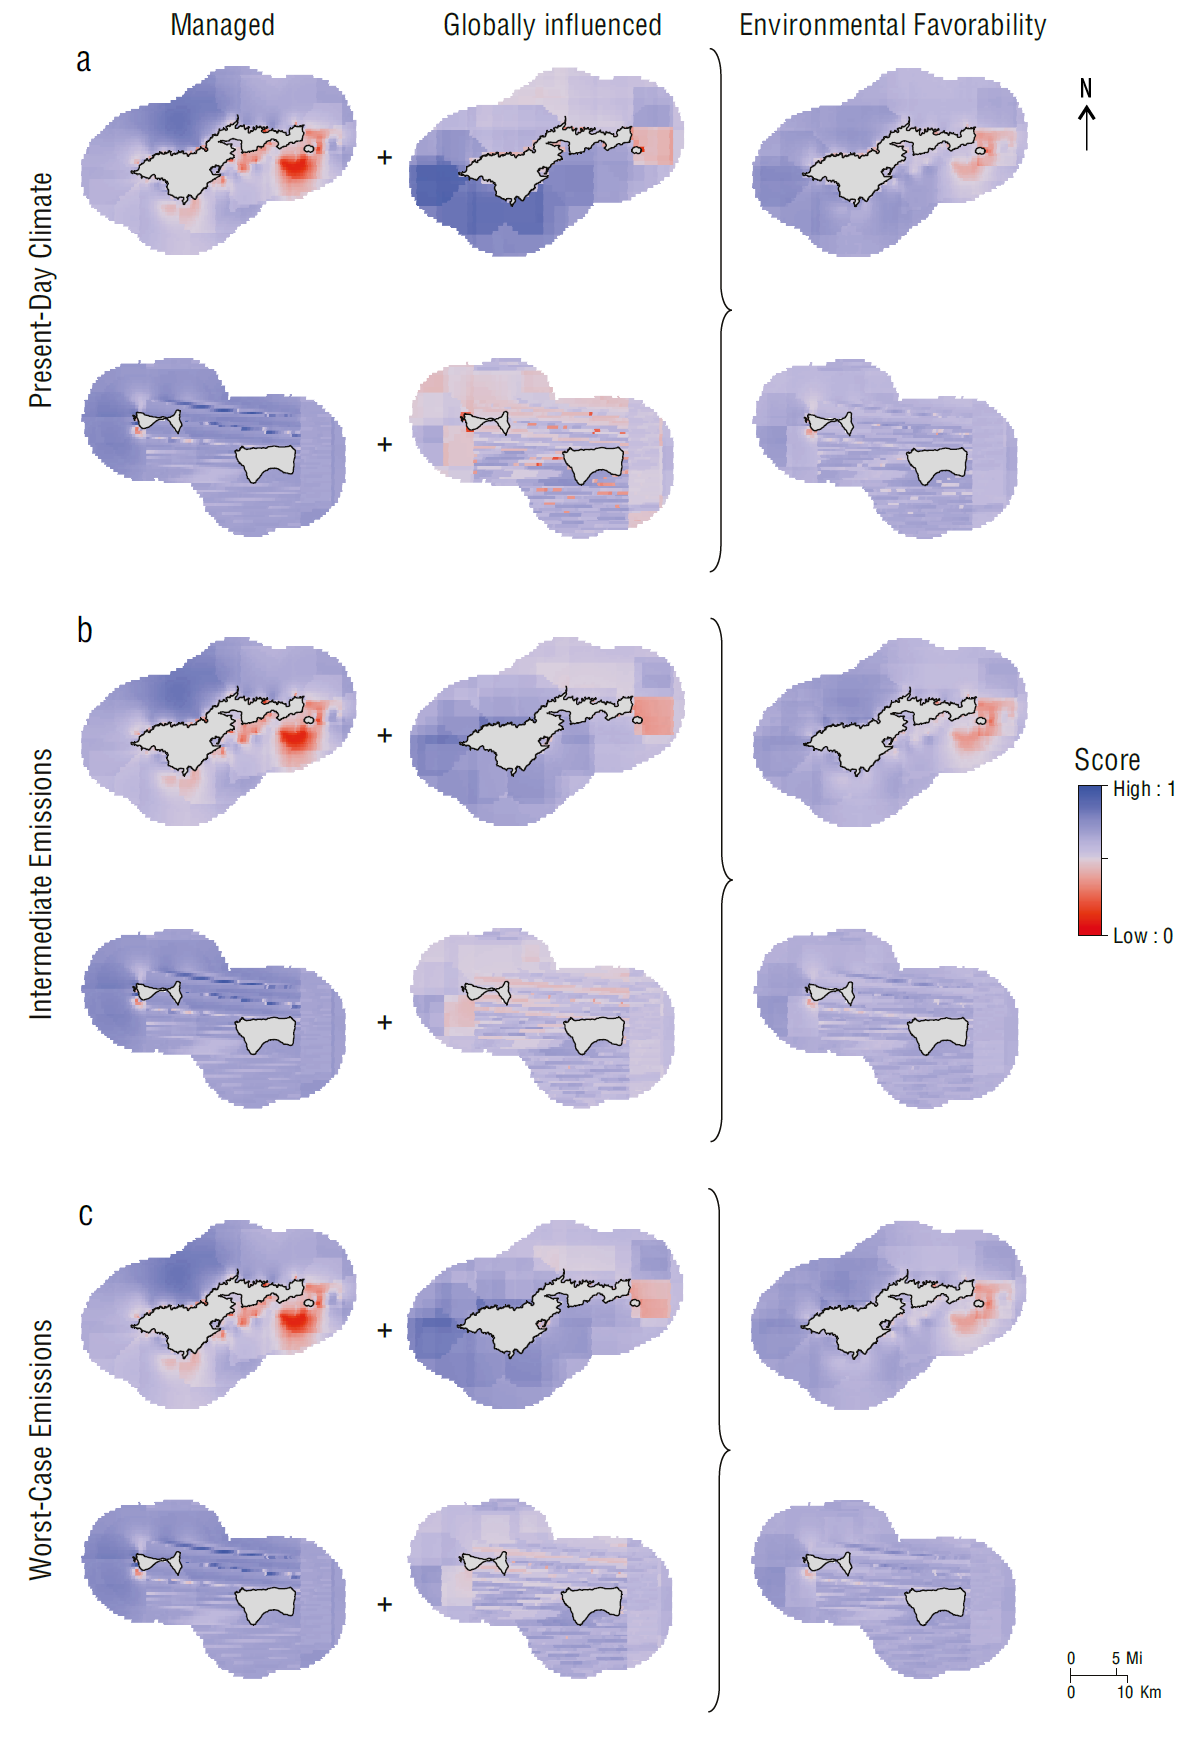
Figure 4 Scores for managed conditions, globally influenced conditions, and environmental favorability in American Samoa for the (a) present-day climate, (b) intermediate emissions scenario, and (c) worst-case emissions scenario. Scores for managed conditions remained the same across future climate scenarios. Red colors correspond to lower favorability and worse conditions for coral. Blue colors correspond to higher favorability and better conditions for coral. 

Coral change and stability

In Guam, the most negative coral change scores were located around the southern tip of the island. The most positive coral change scores were identified on the southeastern and northwestern sides, reflecting gradual gains in coral cover since 2009 (Figs. 2a, 5a). The southwestern side had the lowest coral stability scores, reflecting steep declines in coral cover approaching zero. The highest coral stability scores were observed along the southeastern side and near Agana Bay (Fig. 5b) where some of the highest percentages of coral cover persisted over time (Fig. 2). The sectors formed 3 groups with distinct trends in cover: a stable group around the northern and eastern sides of the island; a group with increasing cover on the northwestern side, which exhibited positive coral change scores and low coral stability scores; and a declining cover group on the southwestern side, which had negative coral change scores and low coral stability scores (Fig. 6a). The coral change and stability scores explained 72.0% of the variation between groups (between-group sum of squares: 8.567; total sum of squares: 11.901).

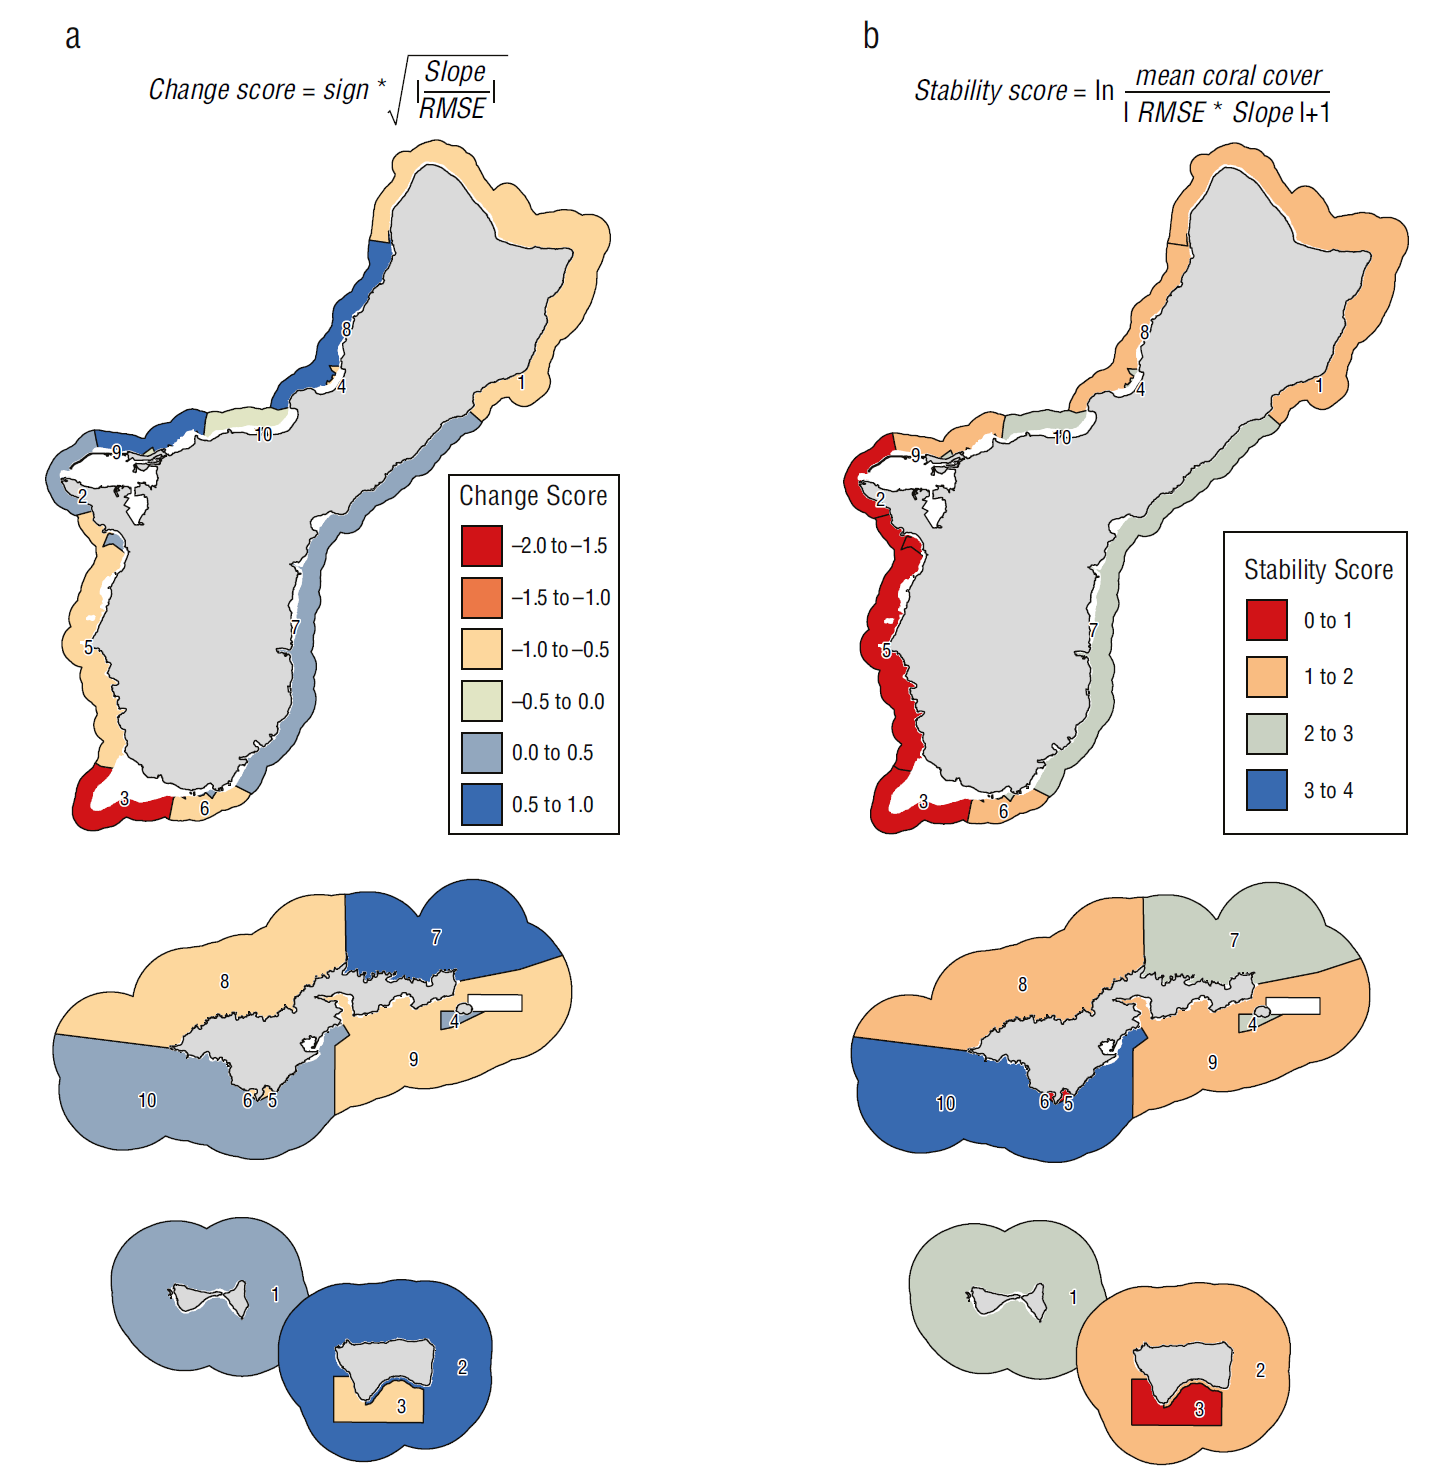
Figure 5 (a) Coral change score and (b) coral stability score by sector. Reds correspond to lower values and blues correspond to higher values. Guam sectors are unnamed and referred to by arbitrarily assigned numbers. American Samoa sector names are: (1) Ofu and Olosega, (2) Ta‘ū Open, (3) Ta‘ū Sanctuary, (4) Tutuila Aunu‘u A, (5) Tutuila Fagalua, (6) Tutuila Fagatele, (7) Tutuila Northeast Open, (8) Tutuila Northwest Open, (9) Tutuila Southeast Open, (10) Tutuila Southwest Open. Reef flat, dredged, lagoon, back reef and intertidal areas are excluded from view. Coral sector boundaries for Guam based on boundaries from Oliver et al. (2020a). Colors correspond to the coral change and stability scores. Guam sectors are unnamed and referred to by arbitrarily assigned numbers. Coral sectors for American Samoa based on boundaries from the NOAA National Coral Reef Monitoring Program. Not to scale. 

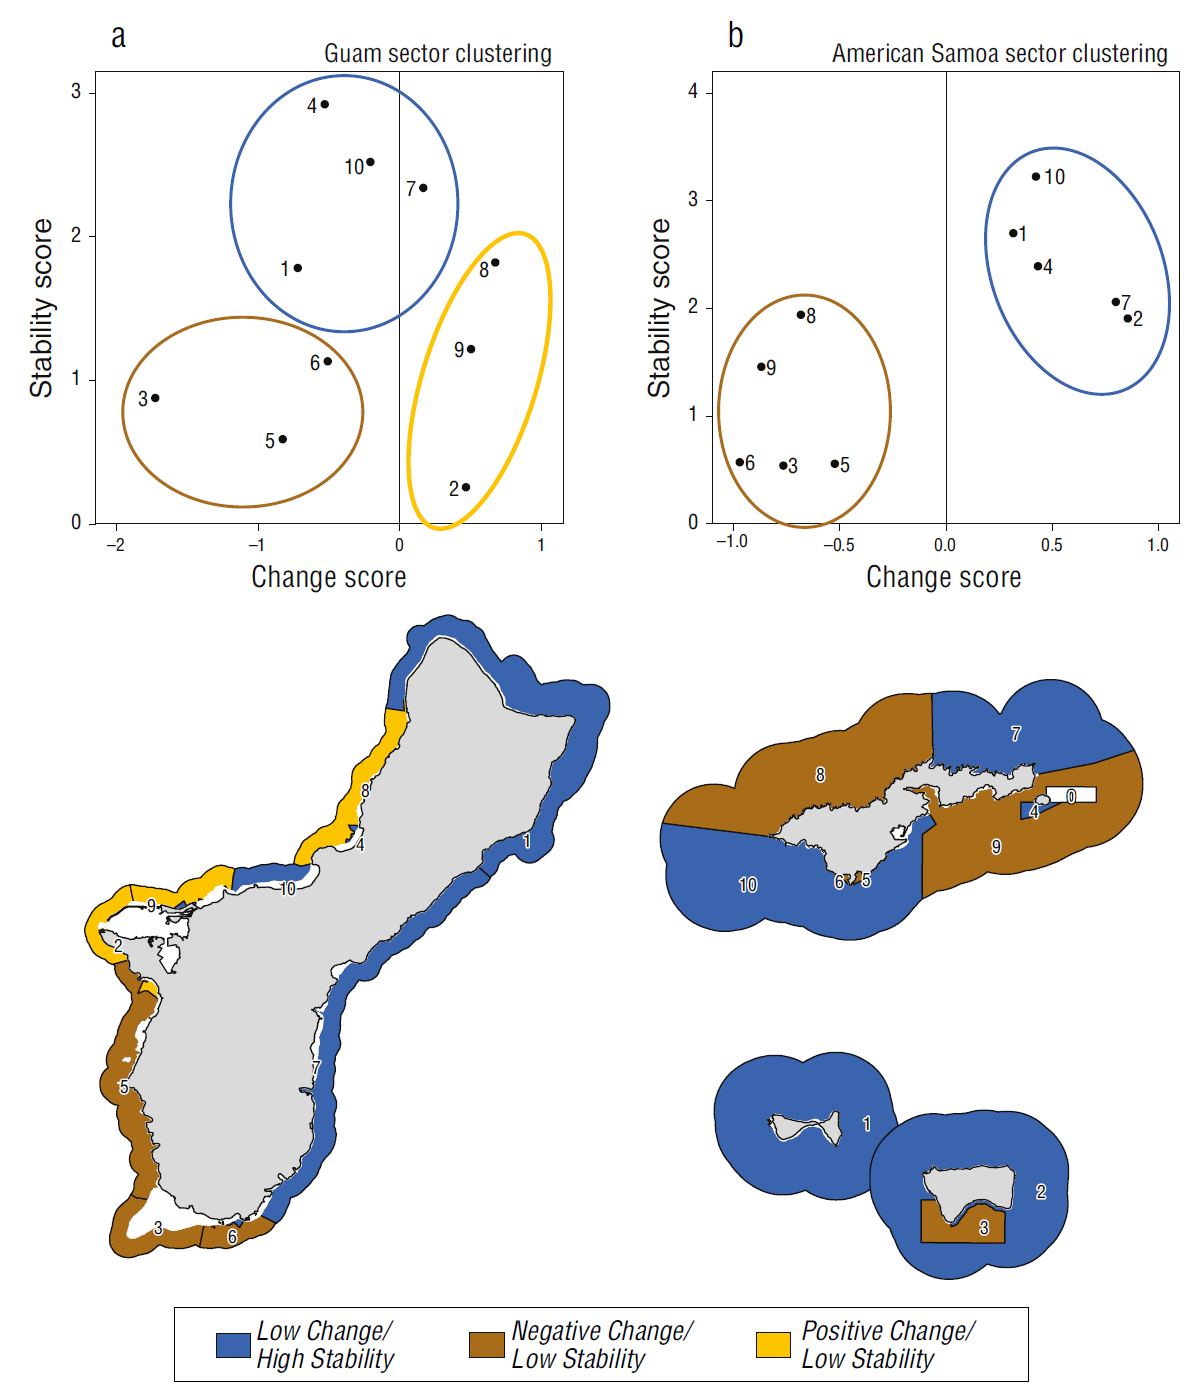
Figure 6 Sector clustering for (a) Guam and (b) American Samoa. Sectors are plotted based on change and stability scores. Cluster analysis determined group membership, shown by ellipses and corresponding colors for sector polygons on the maps. Blue indicates the low change/high stability group (high resilience). Yellow indicates the positive change/low stability group (moderate resilience). Brown indicates the negative change/low stability group (low resilience). Reef flat, dredged, lagoon, back reef and intertidal areas are excluded from view. 

In American Samoa, the northeast side of Tutuila and the unprotected sector of Ta‘ū had the highest positive coral change scores due to relatively high gains in coral cover since 2010 (Fig. 5a). Southwest Tutuila, Aunu‘u, Ofu, and Olosega had low positive coral change scores, reflecting slight increases in coral cover, whereas the rest of the sectors had low to moderate negative coral change scores due to declines in coral cover (Figs. 2b, 5a). Conversely, southwest Tutuila had the highest coral stability scores, as coral cover remained the highest out of all 10 sectors. Aunu‘u, Ofu, and Olosega had moderately high coral stability scores, maintaining high coral cover at lower levels or with more variability (Figs. 2b, 5a). Northwest Tutuila, southeast Tutuila, and the unprotected sector of Ta‘ū had moderately low coral stability scores, whereas the low coral stability scores in the 3 protected sectors (Ta‘ū Sanctuary, Fagalua, and Fagatele) resulted from relatively steep declines or high variability in coral cover (Figs. 2b, 5a). Here, sectors formed 2 distinct groups: a stable group with low coral change scores and high coral stability scores around southwest Tutuila, northeast Tutuila, Aunu‘u, and most of the Manuʻa Islands and a declining cover group with negative coral change scores and low coral stability scores in northwest Tutuila, southeast Tutuila, southern Ta‘ū, Fagalua Bay, and Fagatele Bay (Fig. 6b). The change and stability scores explained 75.3% of the variation between groups (between-group sum of squares: 9.608; total sum of squares: 12.759; Fig. 6).

Synthesis of coral resilience and environmental favorability for the implementation of RBM strategies

In both locations, the overlap of highly favorable environmental conditions and stable sectors declined in future climate scenarios. The northern half of Guam exhibited the most overlap under present-day climate conditions and in both future climate scenarios (Fig. 7). The overlap decreased from 54.1 km2 under present-day climate conditions to 29.6 and 30.5 km2 in the intermediate emissions and worst-case emissions scenarios, respectively (Fig. 7b,c). The overlap between sectors with increasing cover and highly favorable conditions was considerably smaller than that of the stable sectors and limited to <8.0 km2 on the northwestern side of the island for all climates considered (Fig. 7). Declining sectors did not overlap with highly favorable conditions under present-day climate conditions, but this increased to 4.0 and 4.9 km2 near the southern end of the island in the intermediate and worst-case emissions scenarios, respectively (Fig. 7).

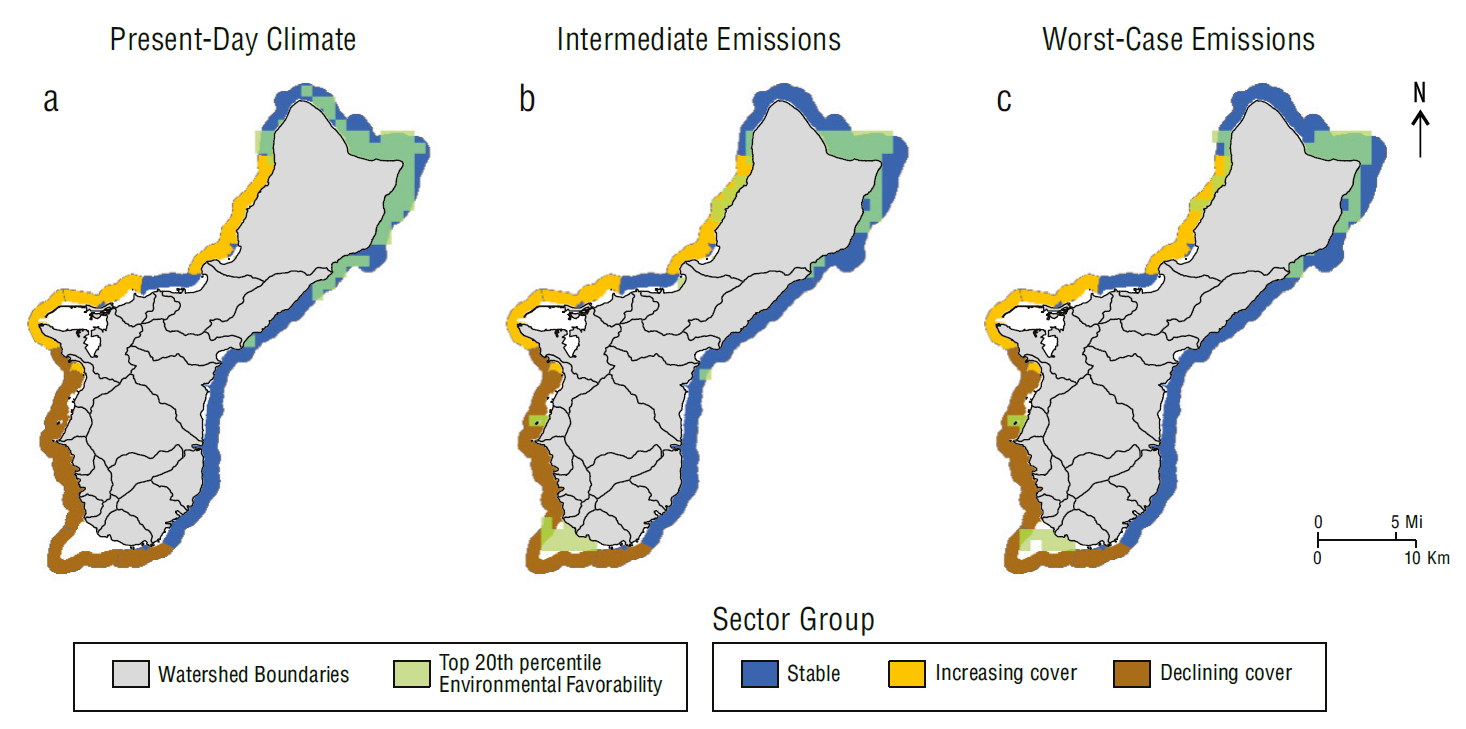
Figure 7 Map of overlap in Guam’s areas of high environmental favorability (light green) and high coral resilience (dark blue) for (a) present-day climate, (b) intermediate emissions scenario, and (c) worst-case emissions scenario. Watershed boundaries included for reference (WERI 2021). Reef flat, dredged, lagoon, back reef and intertidal areas are excluded from view. 

In American Samoa, stable sectors and highly favorable conditions overlapped around the south and southwest sides of Tutuila and the western side of Ofu (Fig. 8a) under present-day climate conditions. In both future climate scenarios, this overlap shifted to include less area from the south side of Tutuila and more area from western Ofu. The overlap declined from 207.5 km2 under present-day climate conditions to 179.2 and 190.1 km2 in the intermediate emissions and worst-case emissions scenarios, respectively (Fig. 8b,c). Stable sectors outside of highly favorable conditions made up the majority of the area of the waters of American Samoa across all climate scenarios (839.9 to 868.3 km2). Declining sectors overlapped with 134.1 km2 of highly favorable conditions under present-day climate conditions, concentrated around the northwestern sector of Tutuila (Fig. 8a). This area increased in future climate scenarios, remaining concentrated in northwestern Tutuila (Fig. 8b,c).

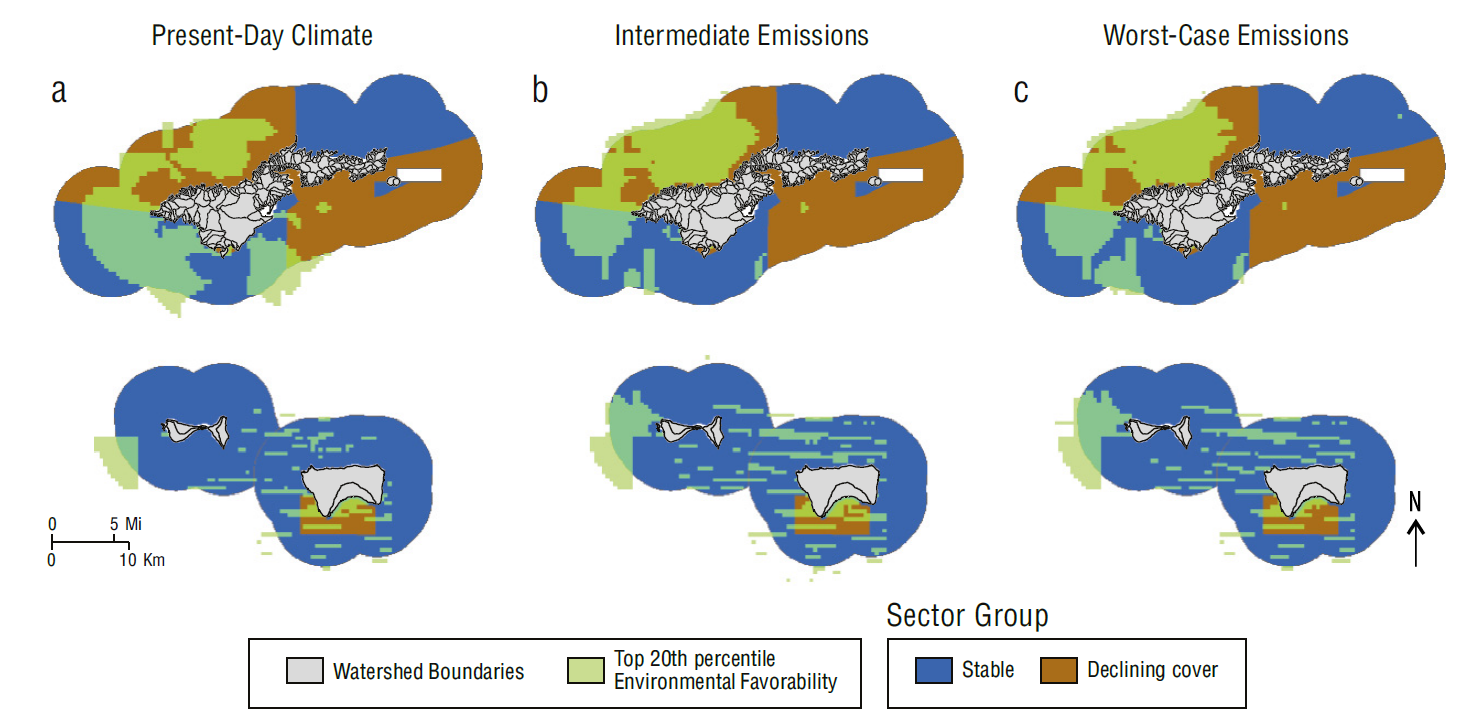
Figure 8 Map of overlap in American Samoa’s areas of high environmental favorability (light green) and high coral resilience (dark blue) for (a) present-day climate, (b) intermediate emissions scenario, and (c) worst-case emissions scenario. Watershed boundaries included for reference (Wright 2016a, 2016b). Reef flat, dredged, lagoon, back reef and intertidal areas are excluded from view. 

In Guam, the area suited for the conservation of stable or increasing coral cover declined in future climate scenarios. Under present-day climate conditions, this area comprised 23% of the 238.7 km2 of the Guam study area and was spatially overrepresented compared to what was expected at random (χ2 < 0.0001, d.f. = 1, P = 0.0049). In both future climate scenarios, the area for the representation of this strategy declined to 15.1% to 15.4% of the study area (Fig. 9a) and was not significantly different from what was expected at random (intermediate emissions: χ2 = 0.2209, d.f. = 1, P = 0.3616; worst-case emissions: χ2 = 0.1455, d.f. = 1, P = 0.2971). A restoration strategy for declining coral cover was represented by a very small proportion of the study area (<3%) under all climate scenarios. Strategies for conserving genetic material or mitigating stressors could be applied to the highest proportion of Guam (52% to 60% of the study area; Fig. 9a).

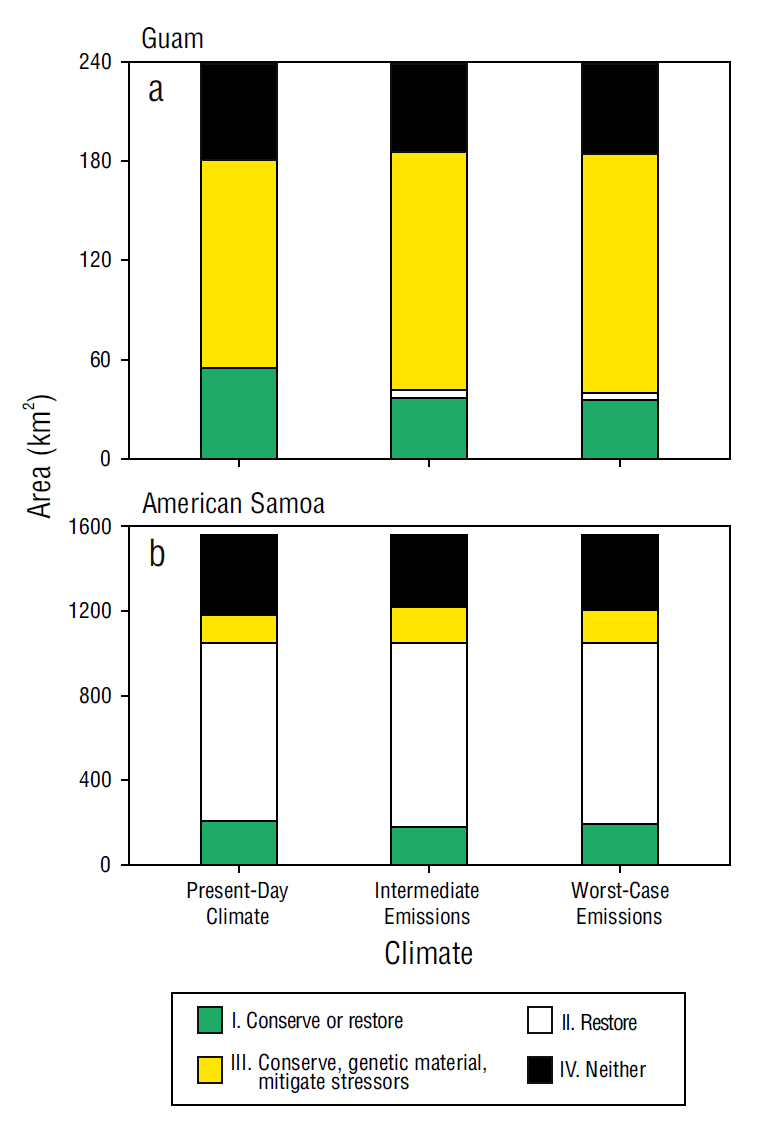
Figure 9 Area of sectors for (a) Guam and (b) American Samoa that correspond to management strategies outlined in Table 1 based on trends in coral cover and environmental favorability scores. 

In American Samoa, the proportions of the areas in which each applicable set of RBM strategies (Table 1) could be applied were similar (varying by <3%) across climate scenarios (Fig. 9b). The areas for applying the strategies of conserving stable coral populations, conserving genetic material, and mitigating stressors for declining coral cover under favorable conditions were similar, each occupying 9% to 13% of the study area (1,556.9 km2). The management strategy of restoring declining coral cover could be applied in the largest area, comprising 54% to 56% of the study area. This strategy was consistently overrepresented, whereas conserving genetic material and mitigating stressors were underrepresented (9% to 11%; present-day climate: χ2 < 0.0001, d.f. = 1, P < 0.0001; intermediate emissions: χ2 < 0.0001, d.f. = 1, P < 0.0001; worst-case emissions: χ2 < 0.0001, d.f. = 1, P < 0.0001; Fig. 9b). Despite exhibiting consistent proportions among strategy areas, American Samoa showed greater geographic shifts regarding where these strategies could be applied in future climate scenarios compared to those of Guam (Figs. 7-9).

Discussion

Our results highlight areas where corals showing 2 potential characteristics of resilience, positive change and stability, co-occur with favorable environmental conditions both now and in multiple future climate scenarios. Prior resilience assessments in the Pacific Islands region partially agree with the geographic patterns identified in this study. In Guam, the environmental favorability scores were highest around the northern half of the island (Fig. 3), which aligned with the highly resilient sites that Maynard et al. (2018) identified based on scaled scores for coral cover, coral diversity, coral recruitment, bleaching resistance, macroalgae cover, herbivorous fish biomass, and temperature variability. The northwestern coast of Guam is also a center of importance for marine biodiversity, suggesting that RBM strategies in this area could contribute additional benefits to taxa other than corals (Dobson et al. 2021). The stable coral sectors in American Samoa partially aligned with the results of a prior resilience assessment that incorporated coral diversity and coral performance during past bleaching events (Oliver et al. 2020a), particularly around the Manuʻa Islands (Fig. 6). However, around Tutuila, the stable sectors in this study were different than those identified by Oliver et al. (2020a), who found that only the northwestern sector of Tutuila exhibited medium to high resilience based on average scaled scores of coral diversity, herbivorous fish biomass, macroalgae cover, juvenile coral diversity, fishing depletion, bleaching resistance, coral disease, and temperature variability. This divergence illustrates that examining climate-related changes in community structure and ecosystem functions could complement our species-indifferent approach, yielding a more comprehensive picture of ecosystem resilience, as coral stress tolerance varies by taxon and life history stage (McCowan et al. 2012, Nalley et al. 2021).

The large differences in the relative proportions of the applicable RBM strategies between the 2 jurisdictions (Fig. 9) could have been driven by the greater overlap of highly favorable conditions with declining coral sectors in American Samoa, creating a larger area potentially suitable for restoration (Figs. 7, 8), whereas restoration did not emerge as a widespread strategy for Guam (Fig. 9). The principles of RBM suggest that restoration is more successful in areas with low environmental stress compared to the surrounding areas (Mcleod et al. 2019). In contrast, the presence of the large area of Guam suitable for the conservation of genetic material or stressor mitigation suggests that it contains several sectors resilient to challenging conditions. Repeated exposure to environmental variability and stress has been documented to increase positive outcomes after severe disturbance events. For example, corals exposed to variable water temperatures maintain higher photosynthetic efficiency and exhibit higher survival rates during heat stress events than those of corals living in less variable water temperatures. These differences can be attributed to symbiont clades and to the corals themselves (McClanahan et al. 2007, Oliver and Palumbi 2011).

Strengths and limitations of this approach

The sector-wide averages of the aggregated NOAA NCRMP data did not allow us to explicitly incorporate coral community structure into our approach. The sector boundaries in American Samoa were based on NOAA management units and were largely influenced by protected area boundaries. The disagreement between our results and those of Oliver et al. (2020a) regarding which sectors of American Samoa showed signs of resilience could stem from the fact that breaks in community structure were not closely aligned with sector boundaries. In contrast, coral community structure informed the boundaries of the Guam sectors, possibly explaining the comparatively better agreement between our results and those of Maynard et al. (2018). This suggests that setting the boundaries of aggregation units based on similarities in community structure can improve the use of coral cover metrics in resilience assessments in which repeated surveys of community composition are spatially limited or absent.

One strength of our approach is that it utilizes aggregated data such as those reported by government monitoring agencies. The collection and interpretation of coral community data, while offering valuable insights into ecosystem dynamics, requires more time and expertise than analyzing coral cover without regard to species. Coral change and coral stability scores provide metrics for comparisons among coral cover trends over time and are easily repeatable. Furthermore, it is easy to spatially overlay these metrics with environmental variables to reveal alignments in potential drivers. However, these scores do not capture nuances of community change post-disturbance. For example, in the wake of repeated bleaching events, a low-diversity assemblage of fast-growing species may recolonize a formerly diverse assemblage. Alternatively, an assemblage of slower-growing, heat-tolerant species may be all that survives (van Woesik et al. 2011, Guest et al. 2012). Implications for fish and invertebrate communities are also not captured in these scores. We do not suggest that this approach should replace community surveys. Rather, our approach complements these labor-intensive surveys by providing a rapid way to assess sector-wide trends.

Implications for management

When selecting sites to implement RBM, many managers prefer to target areas with desirable conditions for specific taxa in multiple climate scenarios. These preferences are based on the assumption that positive outcomes, in terms of ecosystem function and biodiversity, are more likely in these locations, regardless of the uncertainty surrounding the severity of climate change impacts (Moilanen et al. 2006, Polasky et al. 2011, Neuman et al. 2019). In this respect, Guam may exhibit more geographic consistency for applying RBM strategies than American Samoa as the climate continues to change. In contrast, the proportions of applicable RBM strategies remained similar in American Samoa, although larger geographic shifts regarding where they should be implemented were present (Figs. 7-9). Regardless, for both jurisdictions, the RBM strategies outlined in this study (Table 1) could be suitable in >75% of their sectors (Fig. 9).

A lack of fine-scale climate projections poses a challenge for evaluating the potential impacts of future environmental conditions on coral growth and survival. For example, sea surface temperature projections from the Coupled Model Intercomparison Project (CMIP6) were only available at 0.5-degree resolution (Krasting et al. 2018) at the time of analysis, representing small island territories with only a few cells. Future projections for only 2 globally influenced variables, thermal stress and SLR-related erosion, were available at sufficient resolution to be included in the analysis of future climate scenarios. Notably, the projected onset of annual severe bleaching differed by less than a decade between the intermediate emissions and worst-case emissions scenarios, likely contributing to the similarity in environmental favorability scores. In the Pacific Islands region, many marine management actions are considered at the scale of single watersheds, which typically have <10 km of coastline (Comeros-Raynal et al. 2019), demonstrating a mismatch between the spatial scales of the available climate projections and the detail needed for local management decisions. As the resolution of downscaled climate projections improves for more variables, this assessment could be repeated to provide greater local-scale nuance.

We have highlighted areas that may be suitable for conserving existing robust coral populations, restoring corals, and mitigating environmental stressors. These ecological considerations can be added to socioeconomic and logistical considerations to determine locally appropriate RBM strategies (Oliver et al. 2020c), assisting reef managers and local stakeholders in making decisions that facilitate adaptive responses to climate change.

Acknowledgments

Any use of trade, firm, or product names is for descriptive purposes only and does not imply endorsement by the U.S. Government. This work was funded by the U.S. Geological Survey Pacific Islands Climate Adaptation Science Center, supported in part by the Pacific Islands Regional Ocean Data Sharing Initiative, and coordinated by the Pacific Islands Ocean Observing System (PacIOOS) with funding from National Oceanographic and Atmospheric Administration (Award #NA16NOS0120024). The authors thank Tom Oliver and Kurt Ingeman for coral sector data and feedback on the development of the change and stability scores; Jim Potemra, Bernardo Vargas-Angel, David Burdick, and Curt Storlazzi for feedback on the resilience modeling process; Michael Ackerman for sharing data from the American Samoa Coral Drivers project; Melissa Iwamoto and PacIOOS for administrative and logistical support; and Cynthia Derosier and Trent Fish for technical support during feedback workshops with coastal managers. We thank the following agencies for feedback on map presentation: Guam Bureau of Statistics and Planning, Guam Department of Agriculture, University of Guam Marine Laboratory, Guam Port Authority, Commonwealth of the Northern Mariana Islands Bureau of Environmental and Coastal Quality, American Samoa Coral Reef Advisory Group, American Samoa Department of Commerce, NOAA Office of Coastal Management, NOAA Pacific Islands Fisheries Science Center, National Marine Sanctuary of American Samoa, and National Park of American Samoa.

References

Assis J, Tyberghein L, Bosch S, Verbruggen H, Serrão EA, de Clerck O, Tittensor D. 2018. Bio‐ORACLE v2.0: Extending marine data layers for bioclimatic modelling. Global Ecol Biogeogr 27:277-284. [ Links ]

Ateweberhan M, Feary DA, Keshavmurthy S, Chen A, Schleyer MH, Sheppard CRC. 2013. Climate Change Impacts on coral reefs: synergies with local effects, possibilities for acclimation, and management implications. Mar Pollut Bull. 74(2):526-539. https://doi.org/10.1016/j.marpolbul.2013.06.011 [ Links ]

Aucan J. 2018. Effects of Climate Change on Sea Levels and Inundation Relevant to the Pacific Islands. Pacific Marine Climate Change Report Card: Science Review 2018:43-49. [ Links ]

Barbier EB, Hacker SD, Kennedy C, Koch EW, Stier AC, Silliman BR. 2011. The value of estuarine and coastal ecosystem services. Ecol Monogr. 81(2):169-193. https://doi.org/10.1890/10-1510.1 [ Links ]

Bastazini CV, Munduruca JFV, Rocha PLB, Napoli MF. 2007. Which environmental variables better explain changes in anuran community composition? A case Study in the Restinga of Mata de São João, Bahia, Brazil. Herpetologica. 63(4):459-471. https://doi.org/10.1655/0018-0831(2007)63[459:WEVBEC]2.0.CO;2 [ Links ]

Bessell-Browne P, Negri AP, Fisher R, Clode PL, Duckworth A, Jones R. 2017. Impacts of turbidity on corals: the relative importance of light limitation and suspended sediments. Mar Pollut Bull . 117(1-2):161-170. https://doi.org/10.1016/j.marpolbul.2017.01.050 [ Links ]

Bruno JF, Petes LE, Harvell CD, Hettinger A. 2003. Nutrient enrichment can increase the severity of coral diseases: effect of nutrients on coral disease severity. Ecol Lett. 6(12):1056-1061. https://doi.org/10.1046/j.1461-0248.2003.00544.x [ Links ]

Chung AE, Wedding LM, Green AL, Friedlander AM, Goldberg G, Meadows A, Hixon MA. 2019. Building coral reef resilience through spatial herbivore management. Front Mar Sci. 6:98. https://doi.org/10.3389/fmars.2019.00098 [ Links ]

Chung AE, Wedding LM, Meadows A, Moritsch MM, Donovan MK, Gove J, Hunter C. 2019. Prioritizing reef resilience through spatial planning following a mass coral bleaching event. Coral Reefs. 38(4):837-850. https://doi.org/10.1007/s00338-019-01812-w [ Links ]

Comeros-Raynal MT, Lawrence A, Sudek M, Vaeoso M, McGuire K, Regis J, Houk P. 2019. Applying a ridge-to-reef framework to support watershed, water quality, and community-based fisheries management in American Samoa. Coral Reefs . 38(3):505-520. https://doi.org/10.1007/s00338-019-01806-8 [ Links ]

Comte A, Pendleton LH. 2018. Management strategies for coral reefs and people under global environmental change: 25 years of scientific research. J Environ Manage. 209:462-474. https://doi.org/10.1016/j.jenvman.2017.12.051 [ Links ]

Dobson G, Johnson I, Kowal V, Rhodes K, Lussier B, Byler K. 2021. Guam Costal Resilience Assessment. Prepared for the National Fish and Wildlife Federation. Ashville (NC): University of North Carolina Asheville National Environmental Modeling and Analysis. 63 p. [ Links ]

Fabricius KE. 2005. Effects of terrestrial runoff on the ecology of corals and coral reefs: review and synthesis. Mar Pollut Bull . 50(2):125-146. https://doi.org/10.1016/j.marpolbul.2004.11.028 [ Links ]

Field ME, Ogston AS, Storlazzi CD. 2011. Rising sea level may cause decline of fringing coral reefs. Trans Am Geophys Union. 92(33):273-274. https://doi.org/10.1029/2011EO330001 [ Links ]

Foo SA, Asner GP. 2020. Sea surface temperature in coral reef restoration outcomes. Environ Res Lett. 15(7):074045. https://doi.org/10.1088/1748-9326/ab7dfa [ Links ]

Fox MD, Nelson CE, Oliver TA, Quinlan ZA, Remple K, Glanz J, Smith JE, Putnam HM. 2021. Differential resistance and acclimation of two coral species to chronic nutrient enrichment reflect life‐history traits. Funct Ecol. 35(5):1081-1093. https://doi.org/10.1111/1365-2435.13780 [ Links ]

Graham NAJ, Bellwood DR, Cinner JE, Hughes TP, Norström AV, Nyström M. 2013. Managing resilience to reverse phase shifts in coral reefs. Front Ecol Environ. 11(10):541-548. https://doi.org/10.1890/120305 [ Links ]

Guest JR, Baird AH, Maynard JA, Muttaqin E, Edwards AJ, Campbell SJ, Yewdall K, Affendi YA, Chou LM. 2012. Contrasting patterns of coral bleaching susceptibility in 2010 suggest an adaptive response to thermal stress. PLoS ONE. 7(3):e33353. https://doi.org/10.1371/journal.pone.0033353 [ Links ]

Halpern BS, Frazier M, Potapenko J, Casey KS, Koenig K, Longo C, Lowndes JS, Rockwood RC, Selig ER, Selkoe KA, Walbridge S. 2015. Spatial and temporal changes in cumulative human impacts on the world’s ocean. Nat Commun 6:7615 [ Links ]

Heron SF, Maynard JA, van Hooidonk R, Eakin CM. 2016. Warming trends and bleaching stress of the world’s coral reefs 1985-2012. Sci Rep. 6(1):38402. https://doi.org/10.1038/srep38402 [ Links ]

Holling CS. 1973. Resilience and stability of ecological systems. Annu Rev Ecol Syst. 4(1):1-23. https://doi.org/10.1146/annurev.es.04.110173.000245 [ Links ]

Houk P, Benavente D, Iguel J, Johnson S, Okano R. 2014. Coral reef disturbance and recovery dynamics differ across gradients of localized stressors in the Mariana Islands. PLoS ONE . 9(8):e105731. https://doi.org/10.1371/journal.pone.0105731 [ Links ]

Houk P, Didonato G, Iguel J, van Woesik R. 2005. Assessing the effects of non-point source pollution on American Samoa’s coral reef communities. Environ Monit Assess. 107(1-3):11-27.https://doi.org/10.1007/s10661-005-2019-4 [ Links ]

Jales-Cavalcanti M, do Nascimento-Feitosa FA, Koening ML, Flores-Montes MJ, de Araújo-Filho MC, Araújo-da Silva R. 2015. Phytoplankton biomass dynamics and environmental variables around the Rocas Atoll Biological Reserve, South Atlantic. Brazilian J Oceanogr. 63(4):443-454. https://doi.org/10.1590/S1679-87592015093906304 [ Links ]

Jenness J, Houk P. 2014. UOGML Wave Energy ArcGIS Extension. Mangilao: University of Guam Marine Laboratory. [ Links ]

Kenneth RNA, Marshall PA, Abdulla A, Beeden R, Bergh C, Black R, Eakin CM, Game ET, Gooch M, Graham NAJ. 2015. Operationalizing Resilience for Adaptive Coral Reef Management under Global Environmental Change. Global Change Biol. 21(1):48-61. https://doi.org/10.1111/gcb.12700 [ Links ]

Kottermair M. 2012. Piti-Asan Watershed Management Plan. Mangilao (Guam): Water and Environmental Research Institute (WERI) of the Western Pacific-University of Guam. Technical Report No.: 138. [ Links ]

Krasting JP, John JG, Blanton C, McHugh C, Nikonov S, Radhakrishnan A, Rand K, Zadeh NT, Balaji V, Durachta J, et al. 2018. NOAA-GFDL GFDL-ESM4 Model Output Prepared for CMIP6 CMIP: Earth System Grid Federation. https://doi.org/10.22033/ESGF/CMIP6.1407 [ Links ]

Lê S, Josse J, Husson F. 2008. FactoMineR: A Package for Multivariate Analysis. J Stat Softw, 25(1):1-18. https://doi.org/10.18637/jss.v025.i01. [ Links ]

Maechler M, Rousseeuw P, Struyf A, Hubert M, Hornik K. 2023. cluster: Cluster Analysis Basics and Extensions. R package v. 2.1.5. [ Links ]

Maynard J, Johnson S, Burdick DR, Jarrett A, Gault J, Idechong J, Miller R, Williams GJ, Heron SF, Raymundo L. 2018. Coral reef resilience to climate change in Guam in 2016. NOAA Technical Memorandum CRCP. 29:1-51. https://doi.org/10.7289/V5/TM-CRCP-29 [ Links ]

McClanahan TR, Ateweberhan M, Muhando CA, Maina J, Mohammed MS. 2007. Effects of climate and seawater temperature variation on coral bleaching and mortality. Ecol Monogr . 77(4):503-525. https://doi.org/10.1890/06-1182.1 [ Links ]

McCowan DM, Pratchett MS, Baird AH. 2012. Bleaching susceptibility and mortality among corals with differing growth forms. Proceedings of the 12th International Coral Reef Symposium; 9-13 Jul 2012, vol. 9. Cairns (Australia). 6 p. [ Links ]

Mcleod E, Anthony KRN, Mumby PJ, Maynard J, Beeden R, Graham NAJ, Heron SF, Hoegh-Guldberg O, Jupiter S, MacGowan P, et al. 2019. The future of resilience-based management in coral reef ecosystems. J Environ Manage . 233:291-301. https://doi.org/10.1016/j.jenvman.2018.11.034 [ Links ]

Moilanen A, Runge MC, Elith J, Tyre A, Carmel Y, Fegraus E, Wintle BA, Burgman M, Ben-Haim Y. 2006. Planning for robust reserve networks using uncertainty analysis. Ecol Modell. 199(1):115-124. https://doi.org/10.1016/j.ecolmodel.2006.07.004 [ Links ]

Moritsch MM. 2018. Ecological causes and consequences of sea star wasting syndrome on the Pacific coast [dissertation]. [Santa Cruz (CA)]: Univesity of California Santa Cruz. 184 p. [ Links ]

Moritsch MM. 2021. Favorability of environmental conditions for coral reefs in Guam and American Samoa under multiple climate scenarios: U.S. Geological Survey data release. https://doi.org/10.5066/P9N32V3M [ Links ]

Nalley EM, Tuttle LJ, Barkman AL, Conklin EE, Wulstein DM, Richmond RH, Donahue MJ. 2021. Water quality thresholds for coastal contaminant impacts on corals: a systematic review and meta-analysis. Sci Total Environ. 794:148632. https://doi.org/10.1016/j.scitotenv.2021.148632 [ Links ]

NASA Ocean Biology Distributed Active Archive Center (DAAC). 2020. Earth Science Data and Information System (ESDIS): NASA; [accessed 2021 May 03]. https://oceandata.sci.gsfc.nasa.gov/directaccess/MODIS-Aqua/. [ Links ]

Neuman KK, Stein RW, Eyster CR, Gardali T. 2019. Climate-Smart Conservation of Beaches and Dunes for Western Snowy Plover Recovery in Monterey Bay, California. Petaluma (CA): Point Blue Conservation Science. Report No.: F15AC00642. [ Links ]

NOAA. 2018. US Coral Reef Monitoring Data Summary. NOAA Technical Memorandum CRCP . 31:1-224. https://doi.org/10.25923/G0V0-NM61 [ Links ]

NOAA. 2020. Coral Reef Watch Version 3.1. Daily Global 5 km Satellite Coral Bleaching Degree Heating Week Product, 1985-2020. College Park (Maryland, USA): NOAA Coral Reef Watch; [accessed 2021 Jan 10]. https://coralreefwatch.noaa.gov/product/5km/index_5km_composite.php. [ Links ]

NOAA Digital Coast. 2017. Digital Coast Sea Level Rise Viewer. 1-8. https://coast.noaa.gov/slr/. [ Links ]

Norström AV, Nyström M, Lokrantz J, Folke C. 2009. Alternative states on coral reefs: beyond coral-macroalgal phase shifts. Mar Ecol Prog Ser. 376:295-306. https://doi.org/10.3354/meps07815 [ Links ]

Oliver TA, Barkley H, Couch C, Kindinger T, Williams I. 2020b. Downscaling ecological trends from the spatially randomized datasets of the National Coral Reef Monitoring Program. NOAA Technical Memorandum NMFS-PIFSC.106:59. https://doi.org/10.25923/2FEF-8R42 [ Links ]

Oliver TA, Danika K, Hospital J, Maynard J, Dieter T. 2020a. Coral Reef Resilience and Social Vulnerability to Climate Change: American Samoa. Honolulu (HI): NOAA Pacific Islands Fisheries Science Center. [ Links ]

Oliver TA, Hospital J, Brainard R. 2020c. Spatial prioritization under Resilience Based Management: evaluating trade-offs among prioritization strategies. NOAA Technical Memorandum NMFS-PIFSC . 105:47. https://doi.org.10.25923/XDF2-T259 [ Links ]

Oliver TA, Palumbi SR. 2011. Do fluctuating temperature environments elevate coral thermal tolerance? Coral Reefs . 30(2):429-440. https://doi.org/10.1007/s00338-011-0721-y [ Links ]

[PacIOOS] Pacific Islands Ocean Observing System. 2022. Projects: Coral Reef Resilience in Guam and American Samoa; [accessed 2022 February 1]. http://www.pacioos.hawaii.edu/projects/coral-resilience-guam-amsam/. [ Links ]

[PIFSC] NOAA Pacific Islands Fisheries Science Center, [CRCP] NOAA Coral Reef Conservation Program, and [ESA-CCI] European Space Agency Climate Change Initiative. 2021a. Chlorophyll-a Long-term Mean, 1998-2018. American Samoa: [PacIOOS] Pacific Islands Ocean Observing System. [ Links ]

[PIFSC] NOAA Pacific Islands Fisheries Science Center, [CRCP] NOAA Coral Reef Conservation Program, and [ESA-CCI] European Space Agency Climate Change Initiative. 2021b. Turbidity (Kd490) Long-term Mean, 1998-2018. American Samoa: [PacIOOS] Pacific Islands Ocean Observing System. [ Links ]

[PIFSC] NOAA Pacific Islands Fisheries Science Center, [CRCP] NOAA Coral Reef Conservation Program, and [ESA-CCI] European Space Agency Climate Change Initiative. 2021d. Wave Power Long-term Mean, 2002-2012. American Samoa: [PacIOOS] Pacific Islands Ocean Observing System . [ Links ]

[PIFSC] NOAA Pacific Islands Fisheries Science Center, [CRCP] NOAA Coral Reef Conservation Program, and [ESA-CCI] European Space Agency Climate Change Initiative. 2021c. Photosynthetically Active Radiation (PAR) Long-term Mean, 2003-2018. American Samoa: [PacIOOS] Pacific Islands Ocean Observing System . [ Links ]

Polasky S, Carpenter SR, Folke C, Keeler B. 2011. Decision-making under great uncertainty: environmental management in an era of global change. Trends Ecol Evol. 26(8):398-404. https://doi.org/10.1016/j.tree.2011.04.007 [ Links ]

Pratchett M, Heron S, Mellin C, Cumming G. 2009. Recurrent mass-bleaching and the potential for ecosystem collapse on Australia’s Great Barrier Reef. In: Canadell J, Jackson R (eds.), Ecosystem Collapse and Climate Change. Vol. 241, Ecological Studies (Analysis and Synthesis). Cham (Switzerland): Springer Nature. p. 1492-1499. [ Links ]

Prouty NG, Storlazzi CD, McCutcheon AL, Jenson JW. 2014. Historic impact of watershed change and sedimentation to reefs along west-central Guam. Coral Reefs . 33(3):733-749. https://doi.org/10.1007/s00338-014-1166-x [ Links ]

Raj KD, Aeby GS, Mathews G, Williams GJ, Caldwell JM, Laju RL, Bharath MS, Kumar PD, Arasamuthu A, Asir NGG, Wedding LM, Davies AJ, Moritsch MM, Patterson-Edward JK. 2021. Coral reef resilience differs among islands within the Gulf of Mannar, southeast India, following successive coral bleaching events. Coral Reefs . 40(4):1029-1044. https://doi.org/10.1007/s00338-021-02102-0 [ Links ]

Raymundo LJ, Burdick D, Hoot WC, Miller RM, Brown V, Reynolds T, Gault J, Idechong J, Fifer J, Williams A. 2019. Successive bleaching events cause mass coral mortality in Guam, Micronesia. Coral Reefs . 38(4):677-700. https://doi.org/10.1007/s00338-019-01836-2 [ Links ]

Raymundo LJ, Burdick D, Lapacek V, Miller R, Brown V. 2017. Anomalous temperatures and extreme tides: Guam staghorn Acropora succumb to a double threat. Mar Ecol Prog Ser . 564:47-55. https://doi.org/10.3354/meps12005 [ Links ]

R Core Team. 2021. R: A Language and Environment for Statistical Computing. Vienna (Austria): R Foundation for Statistical Computing. https://www.R-project.org. [ Links ]

Reguero BG, Storlazzi CD, Gibbs AE, Shope JB, Cole AD, Cumming KA, Beck MW. 2021. The value of US coral reefs for flood risk reduction. Nature Sustainability. 4:688-698. https://doi.org/10.1038/s41893-021-00706-6 [ Links ]

Riahi K, Rao S, Krey V, Cho C, Chirkov V, Fischer G, Kindermann G, Nakicenovic N, Rafaj P. 2011. RCP 8.5-A scenario of comparatively high greenhouse gas emissions. Climatic Change. 109(1-2):33-57. https://doi.org/10.1007/s10584-011-0149-y [ Links ]

Risk MJ, Edinger E. 2011. Impacts of sediment on coral reefs. In: Hopley D (ed.), Encyclopedia of Modern Coral Reefs , Encyclopedia of Earth Sciences Series. Dordrecht (Netherlands): Springer Netherlands. p. 575-586. [ Links ]

Safaie A, Silbiger NJ, McClanahan TR, Pawlak G, Barshis DJ, Hench JL, Rogers JS, Williams GJ, Davis KA. 2018. High frequency temperature variability reduces the risk of coral bleaching. Nat Commun . 9(1):1671. https://doi.org/10.1038/s41467-018-04074-2 [ Links ]

Schoepf V, Jung MU, McCulloch MT, White NE, Stat M, Thomas L. 2020. Thermally variable, macrotidal reef habitats promote rapid recovery from mass coral bleaching. Front Mar Sci . 7:245.https://doi.org/10.3389/fmars.2020.00245 [ Links ]

Shuler CK, Comeros-Raynal M. 2020. Ridge to reef management implications for the development of an open-source dissolved inorganic nitrogen-loading model in American Samoa. Environ Manage. 66(3):498-515. https://doi.org/10.1007/s00267-020-01314-4 [ Links ]

Smith JE, Hunter CL, Smith CM. 2010. The effects of top-down versus bottom-up control on benthic coral reef community structure. Oecologia. 163(2):497-507. https://doi.org/10.1007/s00442-009-1546-z [ Links ]

Soil Survey Staff. 2020. Gridded Soil Survey Geographic (gSSURGO) Database for American Samoa and Guam; [accessed 2021 January 06]. https://gdg.sc.egov.usda.gov/. [ Links ]

Storlazzi CD, Elias E, Field ME, Presto MK. 2011. Numerical modeling of the impact of sea-level rise on fringing coral reef hydrodynamics and sediment transport. Coral Reefs . 30(S1):83-96. https://doi.org/10.1007/s00338-011-0723-9 [ Links ]

Stuart-Smith RD, Brown CJ, Ceccarelli DM, Edgar GJ. 2018. Ecosystem restructuring along the Great Barrier Reef following mass coral bleaching. Nature. 560(7716):92-96. https://doi.org/10.1038/s41586-018-0359-9 [ Links ]

Swanson DW, Bailey H, Schumacher B, Ferguson M, Vargas-Ángel B. 2018. Ecosystem Sciences Division standard operating procedures: Data collection for rapid ecological assessment benthic surveys. NOAA Technical Memorandum NMFS-PIFSC -71:63. [ Links ]

Thomson AM, Calvin KV, Smith SJ, Kyle GP, Volke A, Patel P, Delgado-Arias S, Bond-Lamberty B, Wise MA, Clarke LE, et al. 2011. RCP4.5: a pathway for stabilization of radiative forcing by 2100. Climatic Change . 109(1-2):77-94. https://doi.org/10.1007/s10584-011-0151-4 [ Links ]

[UNEP] United Nations Environment Programme. 2017. Coral Bleaching Futures: Downscaled Projections of Bleaching Conditions for the World’s Coral Reefs , Implications of Climate Policy and Management Responses. Nairobi (Kenya): United Nations Environment Programme. 71. [ Links ]

Van Hooidonk R, Maynard JA, Manzello D, Planes S. 2014. Opposite latitudinal gradients in projected ocean acidification and bleaching impacts on coral reefs. Global Change Biol . 20(1):103-112. https://doi.org/10.1111/gcb.12394 [ Links ]

Van Hooidonk R, Maynard J, Tamelander J, Gove J, Ahmadia G, Raymundo L, Williams G, Heron SF, Planes S. 2016. Local-scale projections of coral reef futures and implications of the Paris Agreement. Sci Rep . 6(1):39666. https://doi.org/10.1038/srep39666 [ Links ]

Van Woesik R, Sakai K, Ganase A, Loya Y. 2011. Revisiting the winners and the losers a decade after coral bleaching. Mar Ecol Prog Ser . 434:67-76. https://doi.org/10.3354/meps09203 [ Links ]

Weber M, de Beer D, Lott C, Polerecky L, Kohls K, Abed RMM, Ferdelman TG, Fabricius KE. 2012. Mechanisms of damage to corals exposed to sedimentation. Proc Natl Acad Sci. 109(24). https://doi.org/10.1073/pnas.1100715109 [ Links ]

[WERI] Water and Environmental Research Institute of the Western Pacific. 2016. Watersheds, Major - Southern Guam. Dataset. Distributed by Pacific Islands Ocean Observing System; [accessed 1 August 2023]. [ Links ]

Williams G, Maynard J. 2019. Human and natural drivers of coral reef resilience to climate-induced coral bleaching in Guam; identifying potential climate refugia. Final report for Grant No. NA18NOS4820106. [ Links ]

Wright DJ. 2016. Watersheds, Minor - Tutuila, American Samoa. Dataset. Distributed by Pacific Islands Ocean Observing System; [accessed 2022 August 01]. [ Links ]

Wright DJ. 2016. Watersheds, Major - Manua, American Samoa. Dataset. Distributed by Pacific Islands Ocean Observing System; [accessed 2022 August 01]. [ Links ]

Data Availability

GIS layers are available for download (Moritsch 2021; https://doi.org/10.5066/P9N32V3M). Maps are available in an interactive web viewer on the PacIOOS website (PacIOOS 2022; http://www.pacioos.hawaii.edu/projects/coral-resilience-guam-amsam/)

Copyediting by MacTavish Scientific Editing

Supplementary material

Raster processing

All rasters were projected into the appropriate coordinate system (WGS UTM 55N for Guam, WGS UTM 2S for American Samoa) and aligned to a single grid for each jurisdiction in ArcMap 10.7 (ESRI). We rescaled rasters to a common spatial resolution appropriate to the jurisdiction. For Guam, spatial autocorrelation within coral community composition declines after 2,300 m (Williams and Maynard 2019). We used this distance to inform our choice of resolution. Because we required each ecological sector to be represented by at least one pixel in width, we chose 1,150 m (half of the distance of spatial autocorrelation) for the output resolution so that the smallest sectors would still be represented separately from their larger neighbors while still maintaining units that nested with the autocorrelation distance.

For American Samoa, a literature search did not reveal any studies documenting the distance of spatial autocorrelation. Preliminary conversations with managers highlighted a preference for datasets with <1 km resolution to assist bay-scale management objectives. Several environmental datasets had already been generated at a 500 m resolution (http://www.pacioos.hawaii.edu/projects/coral-drivers-amsam; Table S1). To increase relevance to management and compatibility of our data with those layers, we chose to use a 500 m resolution for this jurisdiction. Where native resolution of the environmental rasters did not match the chosen resolution of resilience maps (1,150 m for Guam, 500 m for American Samoa), we resampled the rasters using the Nearest Neighbor method to better preserve original data values. Polygon data, such as mean macroalgal cover in each sector, was converted into rasters matching the output resolution using the cell centers method.

Sea-level rise-related soil erosion estimates

We found the overlap between USDA SSURGO soils with higher probability of erosion (Soil Survey Staff 2020) and areas that would be inundated with 61 cm (2 ft) and 91 cm (3 ft) of sea-level rise (SLR). We found polygons from the SSURGO database with the following geomorphic types: coastal plain, alluvial flats, valley flats, valley floors, swamps, depressions, basin floors, and fill. These are all low-slope (≤5%) areas. We used NOAA estimates of sea-level rise-driven extreme-tide inundation from NOAA Digital Coast (2017). While these did not correspond exactly with SLR expected in Representative Concentration Pathway (RCP) 4.5 or 8.5 (Aucan 2018), we chose the closest available heights in the 30.5 cm (1 ft) increments mapped by NOAA. We used the Cost Distance function in ArcMap to produce a raster of over-water distance from these erodible polygons to all water cells.

Filling empty nearshore pixels in remotely sensed data

Ocean color data can be unreliable in nearshore environments due to sediment runoff. In American Samoa, nearshore pixels had already been masked out and interpolated in the nearshore for chlorophyll a, turbidity, irradiance, and wave energy datasets (NOAA PIFSC et al. 2021a-d). Guam ocean color datasets (NASA Ocean Biology DAAC 2020) had nearshore pixels masked but not re-filled by interpolation. We used the Focal Statistics method in ArcMap to calculate the mean of a 3-cell radius in a circular neighborhood around missing nearshore pixels to estimate nearshore values of chlorophyll a and turbidity (Table 1).

Principal component analysis

We selected principal components (PC) with Eigenvalues ≥1 (Table S2, S3). Variables loading onto PC with Eigenvalues < 1 were omitted from further analysis. To determine variable loadings for each PC (Table S2, S3), we used a cutoff of >0.4 or <-0.4. Variables with moderate values could be associated with multiple PC. When rescaling the PC, we assigned 1 to the conditions that were best for coral and 0 to conditions that were worst. For example, for Guam’s managed conditions, PC1 consisted of chlorophyll, macroalgal cover, pollution, and turbidity all increasing in favorability (Table S2). Correlations coefficients between variables in the same principal component analysis are listed in Table S4-S7.

Table S1 Sources of environmental data used in calculation of Environmental Favorability Scores. GU = Guam, AS = American Samoa. RCP 4.5 corresponds to the Intermediate Emissions scenario. RCP 8.5 corresponds to the worst-case emissions scenario. Continued on next page. 

Variable Place Description Units Scenario Source Dates Original resolution
Managed variables
Chlorophyll GU Chlorophyll a annual mean mg·m-3 All (NASA Ocean Biology DAAC 2020) 1997-2018 4.80 km
Chlorophyll AS Chlorophyll a annual mean mg·m-3 All (PIFSC et al. 2021a) 1998-2018 5.40 km
Herbivore Biomass GU, AS Herbivore biomass from NCRMP surveys g·m-2 All (Swanson et al. 2018) 2015-2017 Point
Fish biomass GU, AS Total reef fish biomass from NCRMP surveys (excluding sharks and rays) g·m-2 All (Swanson et al. 2018) 2015-2017 Point
Turbidity GU Total organic and inorganic matter held in solution and suspension in the water column kd490 (KD4) All (NASA Ocean Biology DAAC 2020) 2003-2020 4.00 km
Turbidity AS Total organic and inorganic matter held in solution and suspension in the water column kd490 (KD4) All (PIFSC et al. 2021b) 1998-2018 0.50 km
Ocean-based pollution GU Pollution coming from commercial shipping and ports, based on shipping volume and modeled plumes within 100 km from ports Index-based All (Halpern et al. 2015) 2003-2011 0.93 km
Macroalgal cover GU, AS Average percent cover of macroalgae by sector in NCRMP surveys Percent All (Swanson et al. 2018) 2009-2018 Polygon
Globally influenced variables - present
Calcite GU, AS Mean monthly calcite concentration mmol·m-3 All (Assis et al. 2018) 2000-2014 7.00 km
Irradiance AS Photosynthetically available radiation (PAR) E·m-2·d-1 All (PIFSC et al. 2021c) 2013-2018 0.50 km
Irradiance GU Photosynthetically available radiation (PAR) E·m-2·d-1 All (NASA Ocean Biology DAAC 2020) 2002-2019 4.60 km
Cumulative thermal stress GU, AS Average monthly maximum Degree Heating Weeks (oC above the maximum monthly mean per week, cumulative over the prior 12 weeks) Degree heating weeks (°C) Present-Day Climate (NOAA Coral Reef Watch 2020) 2013-2020 5.00 km
Wave energy GU Mean daily wave energy along shoreline based on wind direction, wind speed, and fetch length, created with University of Guam Marine Lab Wave Energy ArcGIS Extension J·m-3 All (Jenness and Houk 2014) 2014 0.33 km
Wave energy AS Long term mean cumulative annual wave power based on Wave Watch III global wave model data and coastline analysis of wave exposure MW·hr-1·m-1 All (PIFSC et al. 2021d) 2002-2012 0.50 km
Globally influenced variables - future
Future thermal stress GU, AS Year of annual severe bleaching using RCP 4.5 and RCP 8.5 sea surface temperature projections Year RCP 4.5, RCP 8.5 (van Hooidonk et al. 2016; UNEP 2017) 2015 4.80 km
Sea-level rise GU, AS 2100 projections for sea-level rise heights of 2ft (~RCP 4.5 = 0.57 m) and 3ft (~RCP 8.5 = 0.76 m) m RCP 4.5, RCP 8.5 (NOAA Digital Coast 2017) 2100 3.00 m
Soil type GU, AS Erosion-prone soil geomorphic types Polygon RCP 4.5, RCP 8.5 (Soil Survey Staff 2020) 2020 10.00 m

Table S2 Principal Component (PC) Eigenvalues and variable loadings for Guam. Sign indicates direction of loading on the PC. Input variables were scaled based on favorability to coral growth and survival from 0 (worst) to 1 (best) prior to analysis, such that the direction of loading represents favorability rather than the directionality of the environmental conditions themselves. SLR indicates sea-level rise. 

Managed PC1 PC2
Eigenvalues 1.88 1.59
% Variation 31.40 26.50
Loading variables Chlorophyll (+)
Macroalgae (+)
Pollution (+)
Turbidity (+)
Fish biomass (+)
Herbivore biomass (+)
Globally influenced (Present-Day Climate) PC1
Eigenvalues 2.07
% Variation 44.10
Loading variables Calcite (+)
Thermal stress (-)
Irradiance (+)
Globally influenced (Intermediate Emissions, RCP 4.5) PC1 PC2 PC3
Eigenvalues 1.66 1.11 1.05
% Variation 33.30 22.10 20.90
Loading variables Calcite (+) Irradiance (+) Bleaching date (+) Calcite (+)
SLR-erosion (+)
Globally Influenced (worst-case emissions, RCP 8.5) PC1 PC2
Eigenvalues 1.74 1.28
% Variation 34.70 25.60
Loading variables Calcite (+)
Irradiance (+)
Bleaching date (+)
SLR-erosion (+)

Table S3 Principal component (PC) eigenvalues and variable loadings for American Samoa. Sign indicates direction of loading on the PC. Input variables were scaled based on favorability to coral growth and survival from 0 (worst) to 1 (best) prior to analysis, such that the direction of loading represents favorability rather than the directionality of the environmental conditions themselves. SLR indicates “sea-level rise.” 

Managed PC1 PC2
Eigenvalues 2.53 1.27
% Variation 50.60 25.40
Loading variables Chlorophyll (+)
Herbivore biomass (+)
Macroalgae (+)
Turbidity (+)
Fish biomass (+)
Globally influenced (Present-Day Climate) Eigenvalues 1.76 1.00
% Variation 44.10 25.10
Loading variables Calcite (-)
Thermal stress (+)
Irradiance (+)
Wave power (+)
Globally influenced (Intermediate Emissions, RCP 4.5) Eigenvalues 1.49 1.31
% Variation 29.90 26.20
Loading variables Bleaching date (+)
Calcite (-)
Irradiance (+)
SLR-erosion (+)
Wave power (+)
Globally influenced (Worst-case Emissions, RCP 8.5) Eigenvalues 1.48 1.34
% Variation 29.60 26.70
Loading variables Bleaching date (+)
Calcite (-)
Irradiance (+)
SLR-erosion (+)
Wave power (+)

Table S4 Correlation matrix for managed environmental variables for Guam. 

Chlorophyl Fish biomass Herbivore biomass Macroalgae Pollution Turbidity
Chlorophyl 1.000 -0.091 0.026 0.381 0.401 0.270
Fish biomass -0.091 1.000 0.586 0.048 -0.013 0.149
Herbivore biomass 0.026 0.586 1.000 -0.018 -0.052 -0.101
Macroalgae 0.381 0.048 -0.018 1.000 0.303 0.041
Irradiance -0.477 -0.254 -0.257 -0.594 -0.261 -0.098
Pollution 0.401 -0.013 -0.052 0.303 1.000 0.321
Turbidity 0.270 0.149 -0.101 0.041 0.321 1.000

Table S5 Correlation matrix for globally influenced environmental variables for Guam. Variables for RCP 4.5 (intermediate emission scenario) were not used in the same component analysis as RCP 8.5 (worst-case emissions scenario). Present-day thermal stress was also not used in the future climate scenarios. 

Calcite Present thermal stress Irradiance Wave power Bleaching RCP 4.5 Bleaching RCP 8.5 Erosion RCP 4.5 Erosion RCP 8.5
Calcite 1.000 -0.166 0.491 -0.323 0.157 0.424 -0.023 -0.057
Present thermal stress -0.166 1.000 -0.776 0.293 0.359 0.386 0.435 0.433
Irradiance 0.491 -0.776 1.000 -0.155 -0.173 -0.079 -0.312 -0.312
Wave power -0.323 0.293 -0.155 1.000 -0.037 -0.080 0.379 0.394
Bleaching RCP 4.5 0.157 NA -0.173 -0.037 1.000 NA -0.040 NA
bleaching RCP 8.5 0.424 NA -0.079 -0.080 NA 1.000 NA 0.134
erosion RCP 4.5 -0.023 NA -0.312 0.379 -0.040 NA 1.000 NA
erosion RCP 8.5 -0.057 NA -0.312 0.394 NA 0.134 NA 1.000

Table S6 Correlation matrix for managed environmental variables in American Samoa. 

Fish biomass Herbivore biomass Chlorophyll Turbidity Macroalgae
Fish biomass 1.000 0.376 0.093 0.051 -0.034
Herbivore biomass 0.376 1.000 -0.432 -0.414 -0.208
Chlorophyll 0.093 -0.432 1.000 0.913 0.574
Turbidity 0.051 -0.414 0.913 1.000 0.590
Macroalgae -0.034 -0.208 0.574 0.590 1.000

Table S7 Correlation matrix for globally influenced environmental variables in American Samoa. Variables for RCP 4.5 (intermediate emission scenario) were not used in the same component analysis as RCP 8.5 (worst-case emissions scenario). Present-day thermal stress was also not used in the future climate scenarios. 

Bleaching RCP4.5 Bleaching RCP8.5 Calcite Present thermal stress Erosion RCP4.5 Erosion RCP 8.5 Irradiance Wave power
Bleaching RCP4.5 1.000 NA -0.266 NA -0.110 NA -0.216 -0.214
Bleaching RCP8.5 NA 1.000 -0.279 NA NA -0.165 -0.220 -0.136
Calcite -0.266 -0.279 1.000 0.478 -0.165 -0.160 0.275 0.067
Present thermal stress -0.304 -0.225 0.478 1.000 0.005 -0.015 0.328 0.188
Erosion RCP4.5 -0.110 NA -0.165 NA 1.000 NA -0.032 0.228
Erosion RCP 8.5 NA -0.165 -0.160 NA NA 1.000 -0.066 0.257
Irradiance -0.216 -0.220 0.275 0.328 -0.032 -0.066 1.000 0.005
Wave power -0.214 -0.136 0.067 0.188 0.228 0.257 0.005 1.000

Figure S1 (a) Guam kmeans cluster analysis results for optimal number of clusters and (b) sector membership within clusters. (c) American Samoa (AS) cluster analysis results for optimal number of clusters and (d) sector membership within clusters. Precipitous drops in sum of squares were used to determine the optimal number of clusters. Numbers inside plots for (b) and (d) refer to corresponding sectors. 

Received: October 06, 2022; Accepted: July 30, 2023; Published: December 28, 2023

*Corresponding author. E-mail: monicamoritsch@gmail.com

Creative Commons License This is an open-access article distributed under the terms of the Creative Commons Attribution License