


 text in
  English (pdf)
 Article in xml format
 Article references
 Send this article by e-mail
 Cited by SciELO
  Similars in
SciELO
Similars in
SciELO 
 Permalink
INTRODUCTION
The silky shark, Carcharhinus falciformis (Bibron, 1839) (Family Carcharhinidae), is a species widely distributed in tropical seas, and it is found in the western Atlantic, eastern Atlantic, Indo-Pacific, and eastern Pacific, and in the latter from southern Baja California, Mexico, to northern Chile (Compagno et al. 1989, Menni and Lucifora 2007). Although it is considered a vulnerable species (IUCN 2019), C. falciformis is one of the most abundant sharks in the catches of the artisanal fishery of the Pacific waters off Mexico, and it is one of the most important species in the fisheries of the states of Baja California Sur, Chiapas, and Yucatán (Bonfil 2008, Cabrera-Chávez-Costa et al. 2010). In addition, it is the shark species most frequently caught as incidental fauna in the yellowfin and skipjack tuna fishery in the eastern Pacific Ocean (Duffy et al. 2015).
Sharks are considered top predators in many coastal ecosystems and can exert top-down influence on communities, helping control populations at lower trophic levels (Cortés 1999, Heithaus et al. 2010). Studies on the trophic ecology of sharks help to understand the role that these predators play within an ecosystem and their importance as a link between the upper and lower levels of the food chain (Cortés 1999, Borrell et al. 2011, Bornatowski et al. 2014, Barría et al. 2018, Hayden et al. 2019). Furthermore, the information from these studies is important because it allows us to make inferences about the predator-prey relationship; identify the relative importance of a particular prey item in a shark’s diet, including identifying prey abundance, distribution, and preferences; and determine if sharks show a spatial segregation to reduce competitive interactions between conspecifics, by sex or by possible ontogenetic changes in the diet (Estupiñán-Montaño et al. 2017).
Regarding trophic ecology, the diet of C. falciformis changes depending on its area of distribution, allowing it to use different food sources, such as fish, squid, argonauts, and pelagic crabs (Myers 1999, Rosas-Luis et al. 2017). While some sharks have a broad trophic niche (generalists), others have a narrow trophic niche (specialists), which shows important differences in feeding habits between species (Cortés 1999, Barría et al. 2015). Duffy et al. (2015) mentioned that, in the tuna fishing areas of the eastern Pacific Ocean (Mexico and Panama), C. falciformis tends to select its prey and, depending on the area, feeds mainly on the fish Thunnus albacares, Cubiceps pauciradiatus, Katsuwonus pelamis, and some species of the family Carangidae and the squid Dosidicus gigas. In Ecuador, C. falciformis feeds mainly on the fishes K. pelamis and T. albacares (Rosas-Luis et al. 2017). On the other hand, Cabrera-Chávez-Costa et al. (2010) determined that C. falciformis is a specialist predator due to increased consumption of the lobster Pleuroncodes planipes, the mackerel Scomber japonicus, and the squid D. gigas in Baja California Sur, Mexico. Conversely, Flores-Martínez et al. (2016) considered it to be a generalist species and a tertiary consumer that feeds mainly on the D. gigas squid off the coast of Chiapas, Mexico.
Elasmobranchs have slow growth, late maturity, and low fertility; therefore, in general, they are species that are highly vulnerable to overexploitation, which is the case of the silky shark, C. falciformis (Schaefer et al. 2021). Despite its wide ecological and economic importance, there are no studies on this species in the study area, so this work represents the first record of the trophic ecology of immature organisms of C. falciformis in the state of Guerrero, Mexico. The objectives of this study were (1) to describe the trophic spectrum of the species, (2) to identify variations in the diet between maturity stages and sexes, (3) to determine the breadth of the trophic niche and the feeding strategy of the species, and (4) to estimate its trophic level.
MATERIALS AND METHODS
Sample collection
Biological samples of C. falciformis were obtained from the catches of the small-scale fishery fleet operating in Acapulco, Guerrero, Mexico (16°52ʹ-16°41ʹ N and 99°29ʹ-100°11ʹ W) (Fig. 1). The force of the wind distinguishes this fishing area, and this force is influenced by the topography of the American continent and by the presence of the Costa Rican Coastal Current and the Tehuantepec Basin, which are characterized by high temperatures and small annual oscillations (Kessler 2006). Small-scale fishing in the study area is carried out with small fiberglass boats with outboard motors, and a working session can extend from 4 to 6 days. As fishing gear, the fishery uses handlines (hook number 5, eagle claw) and longlines (150-200 m, braided line number 3); as bait, the bigeye scad, Selar crumenophthalmus.

Samples were collected weekly during October-December 2016 and June, November, and December 2017. The total length (TL) and the total weight (TW) of all collected organisms were recorded. Sex was determined based on external sexual characteristics (presence or absence of claspers). The stomachs were extracted and frozen for further analysis.
Laboratory work
Based on the state of digestion, each prey found in the stomach contents was counted, weighed, and identified to the lowest possible taxonomic level with specialized keys. Fishes with in a minimum state of digestion were identified with the keys of Allen and Robertson (1994) and Fischer et al. (1995). Fishes with a high degree of digestion were identified by the vertebral characteristics based on the keys of Clothier (1950). Cephalopods were identified using the works of Iverson and Pinkas (1971) and Wolff (1982), which are based on the identification of beaks. Crustaceans were identified with the keys of Fischer et al. (1995).
To avoid possible biases associated with opportunistic feeding while the organisms were being captured, only those prey with some evidence of digestion were considered. Likewise, the species that were used as bait for the capture were discarded, and only the prey found inside the stomachs were taken into account. Unidentified prey items within each functional group were also included in the quantitative diet analysis.
Data analysis
Samples were compared between sizes (neonates and juveniles) and sexes (males and females). Based on Alejo-Plata et al. (2007), we considered those organisms with sizes from 48 to 71 cm TL as neonates and those with sizes from 72 to 170 cm TL as juveniles. Most of the organisms obtained were considered immature.
Sample size
To determine if the sample size was representative of the C. falciformis diet, a prey accumulation curve was created. This curve was created with the program EstimateS (Colwell 2009) by applying 500 iterations to the values of species richness of the stomachs analyzed. This procedure allowed us to estimate the mean and variance of each sample and, based on this, plot the average cumulative number of prey items in each sample versus the group of stomachs analyzed. To have a standard precision measure, we calculated the coefficient of variation (CV) of the 4 endpoints, in general and by categories (size and sex) (Bizzarro et al. 2009). If the CV was less than or equal to 0.05, the number of stomachs examined was considered adequate to represent the diet (Jiménez-Valverde and Hortal 2003, Hernández-Aguilar et al. 2012). To evaluate the representativeness of the sample size, we used the Clench function (Soberón and Llorente 1993): S n = (a × n)/(1 + b × n), where S n is the number of cumulative species, n is the number of sampled stomachs, and a and b are model parameters.
Diet composition
The prey-specific index of relative importance (%PSIRI) (Brown et al. 2011) was used to comprehensively assess the importance of each prey category in the silky shark diet. It was calculated as follows:
where %FO is the frequency of occurrence (%FO = number of stomachs containing prey i/total number of stomachs with stomach contents × 100) and %PN i and %PW i are, respectively, the numerical and gravimetric specific abundance indices of the prey %PA = ∑%A ij /n i , where %A ij is the abundance (expressed in number or weight) of prey of category i in the j-th stomach and n i is the number of stomachs containing prey i.
Niche breadth and feeding strategy
The Levin index (B i ) (Krebs 1999) was used to measure niche breadth. This index quantitatively evaluated whether the organisms were generalists (varied feeding without selection) or specialists (preference for certain prey items). It was calculated as follows:
where P ij is the proportion of the diet of predator i that includes prey j, and n is the number of prey categories. The values of this index oscillate between 0 and 1; a B i less than 0.6 indicates specialized predators, whereas a B i greater than 0.6 indicates generalist predators (Labropoulou and Eleftheriou 1997).
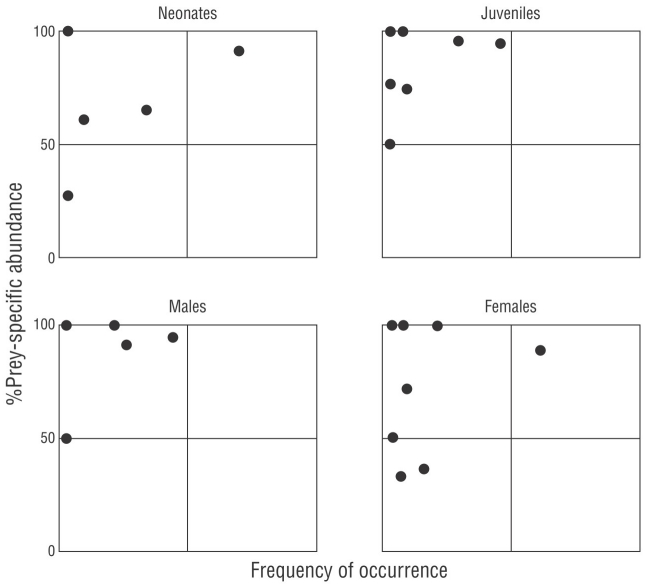
In addition, we used the Costello (1990) model modified by Amundsen et al. (1996) to determine the feeding strategy of C. falciformis. This analysis is based on the 2-dimensional representation of the specific abundance for each prey and the %FO of the different types of prey in the diet. This representation allowed us to visualize the feeding strategy (generalist or specialist), the importance of the prey (as rare or dominant), and the trophic behavior of the population; that is, if a prey is consumed in large quantities by a few individuals (individual specialization) or if it is consumed by the majority of the individuals studied (population specialization) (Amundsen et al. 1996). Dots located in the upper right section of the Amundsen plot reflect a predator population with a narrow niche breadth (Amundsen et al. 1996). Dots located in the upper left section indicated the specialization of individual predators, that is, specialization on different types of prey, and prey categories consumed by only a limited fraction of predators.
Trophic niche overlap
The EcosimR routine for niche overlap (Gotelli et al. 2014) was used to assess diet overlap by size (neonates and juveniles) and sex (males and females). The routine was modified using the Morisita-Horn index instead of the Pinkas index (Horn 1966, Smith and Zaret 1982). It was calculated with the following equation:
where P xi is the proportion of prey i to the total number of prey consumed by predator x, P yi is the proportion of prey i to the number of total prey consumed by predator y, and n is the total number of prey items. Cλ values from 0.00 to 0.29 indicate low dietary overlap; Cλ values from 0.30 to 0.59, moderate overlap; and Cλ values from 0.60 to 1.00, high overlap (Langton 1982). A null distribution was compared with the overlap index values to know if the dietary differences were the result of biological processes and not random. A total of 1,000 index simulations were performed using the RA3 randomization algorithm in EcosimR (Gotelli et al. 2014).
Trophic level
We calculated the trophic level of C. falciformis using the method proposed by Cortés (1999):
where P j is the proportion of each prey category in the predator’s diet and NT j is the trophic level of each category of prey j. The trophic levels of the prey were obtained from databases available online: FishBase (Froese and Pauly 2015) and Sea Around Us (Pauly and Zeller 2015). For unidentified prey, the average trophic level corresponding to their functional group was used: teleosts (3.24), crustaceans (2.52), cephalopods (3.20), sea turtles (2.40), and birds (3.87) (Cortés 1999).
RESULTS
The sizes of C. falciformis fluctuated between 48.00 and 222.00 cm TL, and the average TL was 90.80 cm, with a standard deviation of 30.47 cm TL. A total of 165 C. falciformis stomachs were obtained, of which 34.54% had stomach contents and 65.45% were empty. The prey accumulation curves suggested that the number of stomachs analyzed were sufficient to characterize the diet of C. falciformis in general and by category, that is, the CV was less than or equal to 0.05 in all cases (Table 1).
Table 1 Results of the prey accumulation curves of the silky shark, Carcharhinus falciformis, caught off the coast of Guerrero, Mexico.
| Category | Number of sampled organisms | Number of stomachs with food | % Representation of sample size | Coefficient of variation |
| General | 165 | 57 | 76.36 | ≤0.05 |
| Neonates | 48 | 17 | 80.16 | ≤0.05 |
| Juveniles | 113 | 39 | 75.37 | ≤0.05 |
| Males | 63 | 22 | 80.07 | ≤0.05 |
| Females | 102 | 35 | 75.33 | ≤0.05 |
The diet of C. falciformis consisted of 11 food components, from 5 taxonomic groups: 4 Crustacea, 3 Teleostei, 2 Mollusca, 1 Reptilia, and 1 Aves. According to the %PSIRI, the group of crustaceans represented 77.17% of importance in the diet (Table 2).
Table 2 Composition of the general diet of the silky shark, Carcharhinus falciformis, caught off the coast of Guerrero, Mexico. %FO, frequency of occurrence; %PN, numerical specific abundance index; %PW, gravimetric specific abundance index; and %PSIRI, prey-specific index of relative importance.
| Prey item | %FO | %PN | %PW | %PSIRI |
| Mollusca | ||||
| Cephalopoda | 7.02 | 41.95 | 66.83 | 3.82 |
| Stigmatoteuthis hoylei | 1.75 | 0.12 | 50.00 | 0.44 |
| Crustacea | ||||
| Portunidae | 3.51 | 100.00 | 100.00 | 3.51 |
| Portunus xantusii | 54.39 | 90.82 | 91.37 | 49.54 |
| Euphylax robustus | 1.75 | 100.00 | 100.00 | 1.75 |
| Unidentified crustaceans | 22.81 | 99.99 | 96.15 | 22.37 |
| Teleostei | ||||
| Balistidae | ||||
| Balistes polylepis | 1.75 | 25.00 | 50.00 | 0.66 |
| Mugilidae | ||||
| Mugil sp. | 1.75 | 100.00 | 100.00 | 1.75 |
| Unidentified teleost | 17.54 | 84.20 | 68.27 | 13.37 |
| Reptilia | ||||
| Lepidochelys olivacea | 3.51 | 24.85 | 33.78 | 1.03 |
| Aves | ||||
| Unidentified birds | 1.75 | 100.00 | 100.00 | 1.75 |
| Total | 100.00 |
Variation of the diet by sizes
The diet of C. falciformis neonates was composed of 5 food components: 2 Crustacea, 1 Teleostei, 1 Mollusca, and 1 Reptilia. The Crustacea group represented 68.64% of the diet, according to the %PSIRI, and the crab Portunus xantusii was the most important prey within this group (%PSIRI = 62.76). The fish group represented 25.08% of the diet. The Mollusca group, represented by cephalopods, had an importance value of 5.15%. Hatchlings of the sea turtle Lepidochelys olivacea represented 1.13% (Fig. 2).
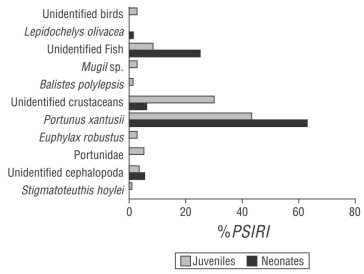
Figure 2 Prey-specific index of relative importance (%PSIRI) for neonates and juveniles of the silky shark, Carcharhinus falciformis, caught off the coast of Guerrero, Mexico.
Juveniles of C. falciformis had a diet composed of 10 food components: 4 Crustacea, 3 Teleostei, 2 Mollusca, and 1 Aves. According to the %PSIRI, the group of crustaceans represented 81.32% of the diet; within this group, P. xantusii was the most important prey (%PSIRI = 43.50). The fish group represented 12.14% of the diet; Mugil sp. and Balistes polylepis showed importance values of 2.56% and 0.96%, respectively. The mollusk group represented 3.98% of the diet, within which Stigmatoteuthis hoylei represented 0.64%. Birds represented 2.56% of the importance (Fig. 2). The value of the Morisita-Horn index obtained between neonates and juveniles was 0.86, which indicated that the diets did not show great differences.
Variation of the diet by sex
The diet of male silky sharks consisted of 6 food components: 3 Crustacea, 2 Mollusca, and 1 Teleostei. According to the %PSIRI, the group of crustaceans was the most important component of the diet, with a value of 74.77%; P. xantusii stood out with 44.09%. Fish represented 22.72% of the diet. The mollusk group represented 2.50% (Fig. 3). Females had a diet composed of 9 food components: 3 Crustacea, 3 Teleostei, 1 Mollusca, 1 Reptilia, and 1 Aves. The crustacean group was the most important in the diet (%PSIRI = 78.68); P. xantusii stood out with 52.97%. The fish group represented 11.42% of the diet, within which Mugil sp. represented 2.85% and B. polylepis 1.07%. Cephalopods represented 5.35% of the diet. Hatchlings of the sea turtle L. olivacea represented 1.67% of the diet, and birds 2.85% (Fig. 3). The value of the Morisita-Horn index obtained was 0.80, which indicated that the diets between males and females did not show great differences.

Niche breadth and feeding strategy
Values of B i obtained for all categories were less than 0.60 (neonates = 0.40, juveniles = 0.16, males = 0.20, females = 0.23), which indicated that C. falciformis had a specialist-type feeding strategy. According to the Amundsen’s model, C. falciformis preferred the crab P. xantusii (located at the top of the graph, Fig. 4), although variation in resource use was also observed between individuals (points located at the top left of the graph, Fig. 4). The same trend was observed by size and by sex (Fig. 4).
DISCUSSION
The time between the moment the sharks were captured and the landing in the study area was 4 to 6 days, which is enough time for the gastric juices to decompose and digest the prey consumed by these predators, even after their death (Bowen 1996, Calle-Morán and Galván-Magaña 2020). This could explain the high percentage of empty stomachs and the advanced degree of digestion of the prey, which has been previously reported for sharks caught with longlines. For example, Cabrera-Chávez-Costa et al. (2010) reported that 46.0% of the C. falciformis stomachs analyzed in Baja California Sur were found to be empty, whereas Flores-Martínez et al. (2016) reported 83.6% empty stomachs for the same species in Chiapas.
Regarding the degree of digestion of the prey, cephalopods (beaks) and fish (vertebrae) were in an advanced state of digestion, because of the soft tissue of their bodies, whereas crustaceans, which have harder structures, were in an intermediate state of digestion. This made it difficult for the prey identification level to reach the lowest possible taxon in some cases and, consequently, decreased the opportunity of detecting possible differences between food categories. However, even with these limitations, the number of stomachs analyzed was sufficient to characterize the trophic spectrum of C. falciformis and observe general trends in its diet.
Variation of the diet by size
Carcharhinus falciformis neonates and juveniles had similar diet compositions, since both fed mainly on crustaceans and had P. xantusii as their most important prey. This result coincides with that reported for the same species in Oaxaca, where P. xantusii made up the highest percentage of the diet (Ruíz-Pérez et al. 2016). However, it contrasts with what other authors have reported for organisms measuring larger sizes than those reported in this study; they indicated that C. falciformis fed mainly on squid and fish (Cabrera-Chávez-Costa et al. 2010, Flores-Martínez et al. 2016, Rosas-Luis et al. 2017).
Cabrera-Chávez-Costa et al. (2010) indicated that juvenile C. falciformis females need more energy for their growth and, therefore, they must feed on prey that they can access and capture without so much energy expenditure; on the other hand, adult females can direct their feeding to a specific prey that covers their energy requirements, either by quantity or by quality of food. In general, observations show that as a shark increases in size, its efficiency in capturing its prey also increases because its senses are fully developed (Lowe et al. 1996, Borrell et al. 2011). Large sharks are capable of capturing large and fast prey, such as fish and squid, which provide higher energy content; conversely, small sharks tend to feed on prey that are not as fast and have a low energy content, such as crustaceans (Lowe et al. 1996, Cabrera-Chávez-Costa et al. 2010).
Cortés and Gruber (1990) indicated that variations in the diet of sharks could be due to the fact that juvenile organisms tend to move over reefs and feed at the bottom, whereas adults tend to be closer to the surface and feed in oceanic areas. When they are young, juvenile sharks occupy coastal areas as nursery grounds, where they also learn to hunt and feed on prey that may provide an abundant food source or are easy to capture, such as crustaceans (McElroy et al. 2006). The predominantly soft (sandy) substrate with patches of coral reefs, rocky reefs, islets, and seamounts in the study area results in a highly heterogeneous system (Palacios-Salgado 2014) that can be exploited by neonates and juveniles of C. falciformis for feeding.
Variation of the diet by sex
Cabrera-Chávez-Costa et al. (2010) indicated that the diet of the silky shark on the coast of Baja California Sur showed a high overlap between both sexes, in which females had P. planipes, D. gigas, and Coryphaena equiselis as main prey, whereas males consumed P. planipes, D. gigas, S. japonicus, Auxis spp., and Argonauta nouryi. The results of the present study showed a high overlap between males and females of C. falciformis, since they shared P. xantusii as their main prey. In this regard, Pittenger (1984) mentioned that sharks can share space in places where food is available and abundant, which could indicate that, in our study area, male and female silky sharks share the same space and they feed on similar species. It has been mentioned that when males and females use the same feeding ground, competition is compensated by the existence of abundant food resources (Colwell and Futuyma 1971), which may be indicative of the abundance of prey in the study area.
On the other hand, Lowe et al. (1996) indicated that larger sharks, which can consequently feed on larger prey, have access to different habitats and can segregate by gender and size, and that this helps to reduce competition for food. Therefore, it is likely that, in the study area, segregation by sex was not observed because most of the samples obtained were from small-sized organisms.
Niche breadth and feeding strategy
Sharks exhibit selective (Cabrera-Chávez-Costa et al. 2010, Ruíz-Pérez et al. 2016) and generalist (Compagno 1984, Castro 1996, Flores-Martínez et al. 2016) behavior, depending on the abundance and availability of their prey. In areas with little diversity, they tend to feed on available prey and show a generalist behavior (Compagno 1984, Castro 1996). In more diverse areas, they tend to select the prey that provides more energy (Cabrera-Chávez-Costa et al. 2010). These differences reaffirm the opportunistic nature of the species and its variation in diet according to its geographic distribution, since in the northwestern part of Mexico, C. falciformis feeds mainly on cephalopods (Cabrera-Chávez-Costa et al. 2010) and in the south it, mainly consumes crustaceans (Ruíz-Pérez et al. 2016).
Although we observed low trophic niche breadth values, which indicates that C. falciformis had a specialist feeding strategy, the values obtained for neonates of both sexes were always higher than those obtained for juveniles. The results suggest that smaller organisms tend to be generalist feeders, whereas larger ones tend to be more selective of their prey according to their energy needs (Cabrera-Chávez-Costa et al. 2010).
Trophic level
The trophic level reported for C. falciformis in the present study (3.70) is lower than that reported by other authors for the same species. For example, Cortés (1999) determined a trophic level of 4.20, Flores-Martínez et al. (2016) determined a trophic level of 4.30-4.40 for organisms with sizes from 70.00 to 203.00 TL, and Estupiñán-Montaño et al. (2017) reported a trophic level of 4.57 for organisms with sizes from 95.00 to 310.00 cm TL. The results of these authors suggest that C. falciformis is a tertiary predator, which highlights its potential role as apex predator in the ecosystem (Cortés 1999). However, in our study we reported a narrow range of lengths (most of the sampled animals were immature), which could explain why our results indicated that C. falciformis acts as a secondary consumer in the food web.
Several authors have pointed out that there is a positive relationship between body size and trophic position, where trophic levels can increase as fish grow (Cousins 1980, Cohen et al. 1993, Heithaus et al. 2013). This is because as the size of the fish increases, their efficiency in capturing prey also increases because their senses are fully developed and they are capable of capturing larger and faster prey (Flores-Martínez et al. 2016). Although we did not find differences in trophic position between neonates and juveniles, we would expect the trophic level of adults to be higher (Borrell et al. 2011).
The preference of C. falciformis for portunid crustaceans positions it as an important predator of these species. Thus, the predation exerted can regulate the population size of its prey, which suggests that its elimination could cause changes in the abundances of other species (Bornatowski et al. 2014, Navia et al. 2016). Knowledge on the feeding habits of the species could be used to build trophic models that help understand the role that this predator plays within the marine ecosystem and the consequences its elimination could have; it could therefore provide information that contributes to the sustainable management of fishery resources in the study area.

