


 text in
  English (pdf)
 Article in xml format
 Article references
 Send this article by e-mail
 Cited by SciELO
  Similars in
SciELO
Similars in
SciELO 
 Permalink
INTRODUCTION
Recent studies have focused on the role coastal zones play in the CO2 flux ocean-atmosphere (fCO2), given how scarce information is for these zones (Laruelle et al. 2014, Jiménez-López et al. 2019). Coastal zones play a considerable role in the global carbon cycle due to high primary production and coastal processes such as upwelling (Gattuso et al. 1998). The fCO2 depends on complex interactions between heating/cooling of the water column, photosynthesis, respiration, wind mixing, internal waves, tidal processes, advection, and thermocline vertical shifts (Takahashi et al. 2002, Wanninkhof 2014, Coronado-Álvarez et al. 2017). In general, these interactions have been classified into thermal and non-thermal effects (these represent biological activity and include changes in alkalinity, advection, and sea-air exchange) (Takahashi et al. 2002).
The Gulf of California (GC) has a net vertical exchange of water with the adjacent Pacific Ocean, with an outflow of surface water toward the Pacific (0-200 m) and an inflow of subsurface water (200-600 m) (Marione 2003). The surface waters that outflow from the GC to the Pacific are relatively poor in dissolved inorganic carbon (DIC), and the water that enters at depth has higher DIC concentrations (Rodríguez-Ibáñez et al. 2013). Within the eastern Pacific area with very low dissolved oxygen values, the GC is located in the minimum dissolved oxygen zone (Levin 2002, Paulmier and Ruiz-Pino 2009). The extremely low dissolved oxygen values cause denitrifying bacteria respiration, which results in a nitrate deficit with respect to the Redfield ratios for NO3-PO4 (Thomas 1966) and NO3-DIC (Rodríguez-Ibáñez et al. 2013). Due to this, and to the dissolution of calcium carbonate exoskeletons at depth (Peterson 1966), GC upwelling waters have an excess of DIC relative to nitrate concentrations; furthermore, when photosynthesis proceeds and nitrate is consumed, excess DIC could cause CO2 to leak into the atmosphere.
Data on the partial pressure of CO2 in surface waters (pCO2W) of the GC are scarce and most come from the region of the Midriff Islands (Tiburón and Ángel de la Guarda) (Hernández-Ayón et al. 2013). The GC has intense upwelling events on the eastern coast in winter (December to May) (Álvarez-Borrego 2010) and very weak upwelling events on the western coast in summer (July to October) (Santamaría-del-Ángel et al. 1999). Heating of upwelling water (with high values of pCO2W) decreases the solubility of gases and contributes to producing CO2 release into the atmosphere (Coronado-Álvarez et al. 2017). This implies that upwelling areas in the GC are sources of CO2 to the atmosphere, at least for long-term averages, for example, the average of 1 year. However, fCO2 can revert to negative values in upwelling relaxation events due to the effect of primary production. This study presents the variability of fCO2 in 5 coastal zones of the GC and analyzes the influence of controlling processes on fCO2 and the emission and absorption capacity of CO2 in these zones.
MATERIALS AND METHODS
Oceanographic campaigns
Oceanographic campaigns were carried out off the Mexican coast between September 2016 and July 2017. In September 2016, 2 samplings were done aboard the R/V Altaír, which belongs to the Secretaría de Marina Armada de México (SEMAR); the first was done in the marine-coastal zone of Navachiste (off the north of Sinaloa) (NAV2016) and the second in the coastal zone off Guaymas (Sonora) (GUA2016). In March 2017, samplings were carried out in the marine-coastal zone of Navachiste (NAV2017) on board a boat with an outboard motor. In June 2017, 3 areas were sampled aboard the R/V Río Tecolutla of the SEMAR: off Mulegé (MUL2017), in Concepción Bay (BC2017), and off Mazatlán (MAZ2017) (Fig. 1).
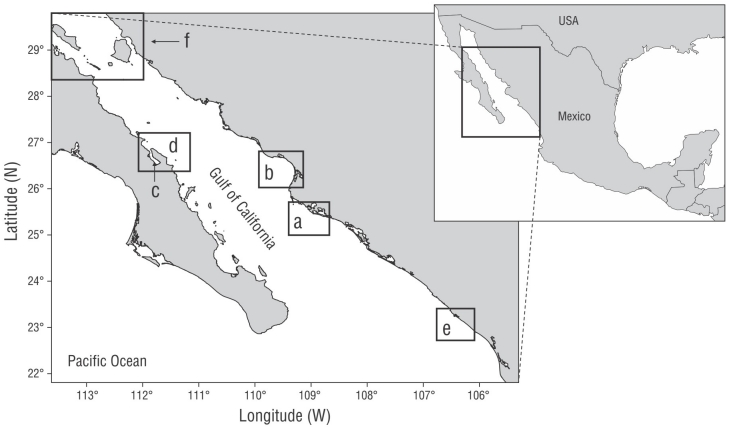
Figure 1 Study area in the Gulf of California. Sampled subregions are shown in black squares: Navachiste (a), Guaymas (b), Concepción Bay (c), Mulegé (d), Mazatlán (e), Midriff Islands (f).
Temperature and salinity were measured using a Sea-Bird 19 Plus CTD, equipped with a 5-L Niskin bottle rosette. Discrete samples of surface water were collected to analyze pH, DIC, and total alkalinity (TA) in 350-mL sodium borosilicate bottles with 100 µL of a saturated solution of mercuric chloride used as a preservative to stop biological activity. Samples were taken at 8 stations at NAV2016, 5 at GUA2016, 9 at NAV2017, 4 at BC2017, 9 at MUL2017, and 7 at MAZ2017. The bottles were sealed with Apiezón grease to prevent evaporation and contact with the atmosphere.
Laboratory analysis
We used an Apollo SciTech AS-C3 instrument to analyze the DIC. We used 6% phosphoric acid to convert all the DIC to CO2, and we quantified this with a Li-COR 7000 high-precision infrared analyzer (Dickson and Goyet 1994). TA was analyzed with an Apollo SciTech AS-ALK2 titration system and 0.1 M hydrochloric acid solution (the 3 methods are detailed in Hernández-Ayón 1995). We verified the precision and accuracy of the methods and took care not to exceed 5 µmol·kg‒1 (0.25% error) in the difference of DIC and TA with respect to reference values. The reference substandards were developed at the Instituto de Investigaciones Oceanológicas of the Universidad Autónoma de Baja California (Mexico).
The calculation of pCO2W was performed with the CO2SYS program (Lewis and Wallace 1998) using surface data of DIC, TA, temperature, salinity, and the dissociation constants of Lueker et al. (2000). We estimated fCO2 using the Liss and Merlivat (1986) equation: F = KwK0 (∆pCO2), where Kw is the CO2 transfer coefficient as a function of wind speed at 10 m above sea level and K0 is the solubility coefficient of CO2 as a function of temperature and salinity. The gas transfer coefficient of Ho et al. (2006) and the CO2 solubility coefficient of Weiss (1974) were used. The partial pressure of CO2 in the atmosphere (pCO2A) was obtained from the internet portal of the Earth System Research Laboratories (ESRL) of the National Oceanic and Atmospheric Administration (NOAA, USA) for each sampling day, and the values corresponded to the Mauna Loa station, Hawaii (NOAA 2017). Due to failures in the ship’s anemometer, the wind data for the different areas were obtained from the MeteoEarth electronic portal (http://www.meteoearth.com), from the model of the European Center for Medium-Range Weather Forecasts; this model was used because the spectral space is larger than the physical parameterizations in a reduced grid (ECMWF 2017).
To better understand the variation of the sea surface temperature (SST) and chlorophyll concentration (Chlsat) in the GC during the different cruises, 5-day satellite averages of the Aqua-Modis sensor were used for the approximate dates of each campaign. For SST, daytime data were used with radiance of 11 µm wavelength and pixel size of 1.1 × 1.1 km2. For Chlsat, images with processing level 3 and the same pixel size as those of the SST were used. In addition, daily sea surface height anomaly (SSHa) images were obtained, with spatial resolution of 0.25° and L4 level data, produced by AVISO and CMEMS. Geostrophic velocity was calculated according to Pond and Pickard (2013). All images were processed in Matlab.
Statistical analysis and data visualization
Principal component analysis (PCA) was performed to determine which factors influenced the variability of pCO2W in the different areas of the GC. Beforehand, the corresponding analysis of variance was performed to determine the normality of the data; when they were not normal, the PCA was carried out. Data of the SST, salinity, DIC, TA, pCO2W, pCO2A, and Chlsat were normalized; the Broken-stick criterion was used according to Peres-Neto et al. (2003), and the correlation and significance of all variables were obtained. All of the above was done with the help of the Statistica software.
Maps of the salinity, DIC, pCO2W, and fCO2 were made with the free distribution Ocean Data View software v.5.0 (Schlitzer 2016). Map interpolations were done using the data-interpolating variational analysis (DIVA) of the Ocean Data View to ensure the conservation of structures and better visualize results.
RESULTS
Oceanographic conditions inferred from satellite images
Satellite composites of SSHa, SST, and Chlsat showed contrasting conditions in September 2016 and March 2017, and transition conditions in June 2017 (Fig. 2). In September 2016 anticyclonic eddies were recorded along the GC. In NAV2016, geostrophic flow (~16 cm·s-1) towards the south was observed; and in GUA2016, geostrophic flow (~18 cm·s-1) towards the coast was observed as part of a small anticyclonic eddy (~90 km) with a SSHa of ~24 cm (Fig. 2a). Negative anomalies of the sea level were observed in March 2017 in most of the GC, with the exception of the zone adjacent to La Paz Bay, and an anticyclonic eddy was recorded at the entrance of the gulf (~17 cm·s-1 and height of 15 cm). Part of a cyclonic eddy (-10 cm) was observed in NAV2017 (Fig. 2b). In June 2017, an intense water inflow occurred in the eastern region of the GC and an intensification of the current with a high sea level (>25 cm·s-1 and height of 25 cm) was observed in Guaymas, which extended to the region of the Midriff Islands (>30 cm·s-1 and height of 22-36 cm). In MUL2017, we observed the influence of a cyclonic eddy with flow towards the coast in the northern part (~12 cm·s-1). In MAZ2017, we recorded the entry of water into the GC with a speed of ~25 cm·s-1 and a cyclonic circulation at the mouth of the GC (Fig. 2c).
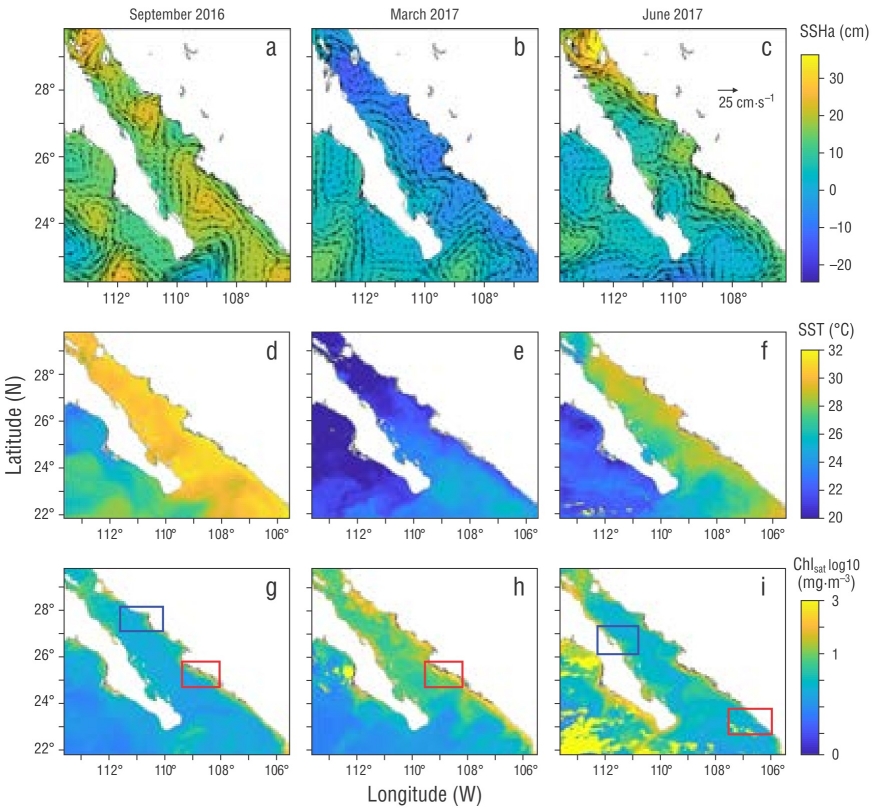
Figure 2 Sea surface height anomalies (SSHa) and geostrophic flow (cm·s-1) (a-c), sea surface temperature (SST, d-f), and chlorophyll (Chlsat, g-i) in September 2016 (squares: red, NAV2016; blue, GUA2016), March 2017 (red square, NAV2017), and June 2017 (squares: red, MAZ2017; blue, MUL2017).
In September 2016, in practically the entire GC, SST was >29 °C (Fig. 2d) and Chlsat values were <0.5 mg·m-3. In NAV2016, a coastal strip with Chlsat values >1.5 mg·m-3 was observed; in GUA2016, lower values (~0.8 mg·m-3) were observed (Fig. 2g). In March 2017, SST values were lower than in September throughout the gulf, with differences greater than 8 °C, and Chlsat was up to ˃1 mg·m-3 higher than in September, with different mesoscale structures in concordance with SSHa data. In NAV2017, SST values were <22 °C and Chlsat was >1.5 mg·m-3 (Fig. 2e, h). Due to the patterns recorded in June, this month was considered a transition period, with intermediate values of SST and Chlsat between September and March. MUL2017 and MAZ2017 showed SST values <29 °C and Chlsat values >0.5 mg·m-3 (Fig. 2f, i).
Variability of salinity, dissolved inorganic carbon, pCO2W, and fCO2
Salinity distribution showed that NAV2016 (Fig. 3a) had lower values (34.70 ± 0.21, mean and standard deviation, respectively, here and henceforth) than NAV2017 (35.29 ± 0.29) (Fig. 3c). There was little variation (35.14 ± 0.01) in GUA2016 (Fig. 3b). Homogeneous values were also recorded (35.94 ± 0.13) in BC2017 (Fig. 3d). Values were 35.28 ± 0.13 in MUL2017 (Fig. 3e), and the central region had the maximum values. MAZ2017 also had little variation in salinity (35.02 ± 0.05) (Fig. 3f).
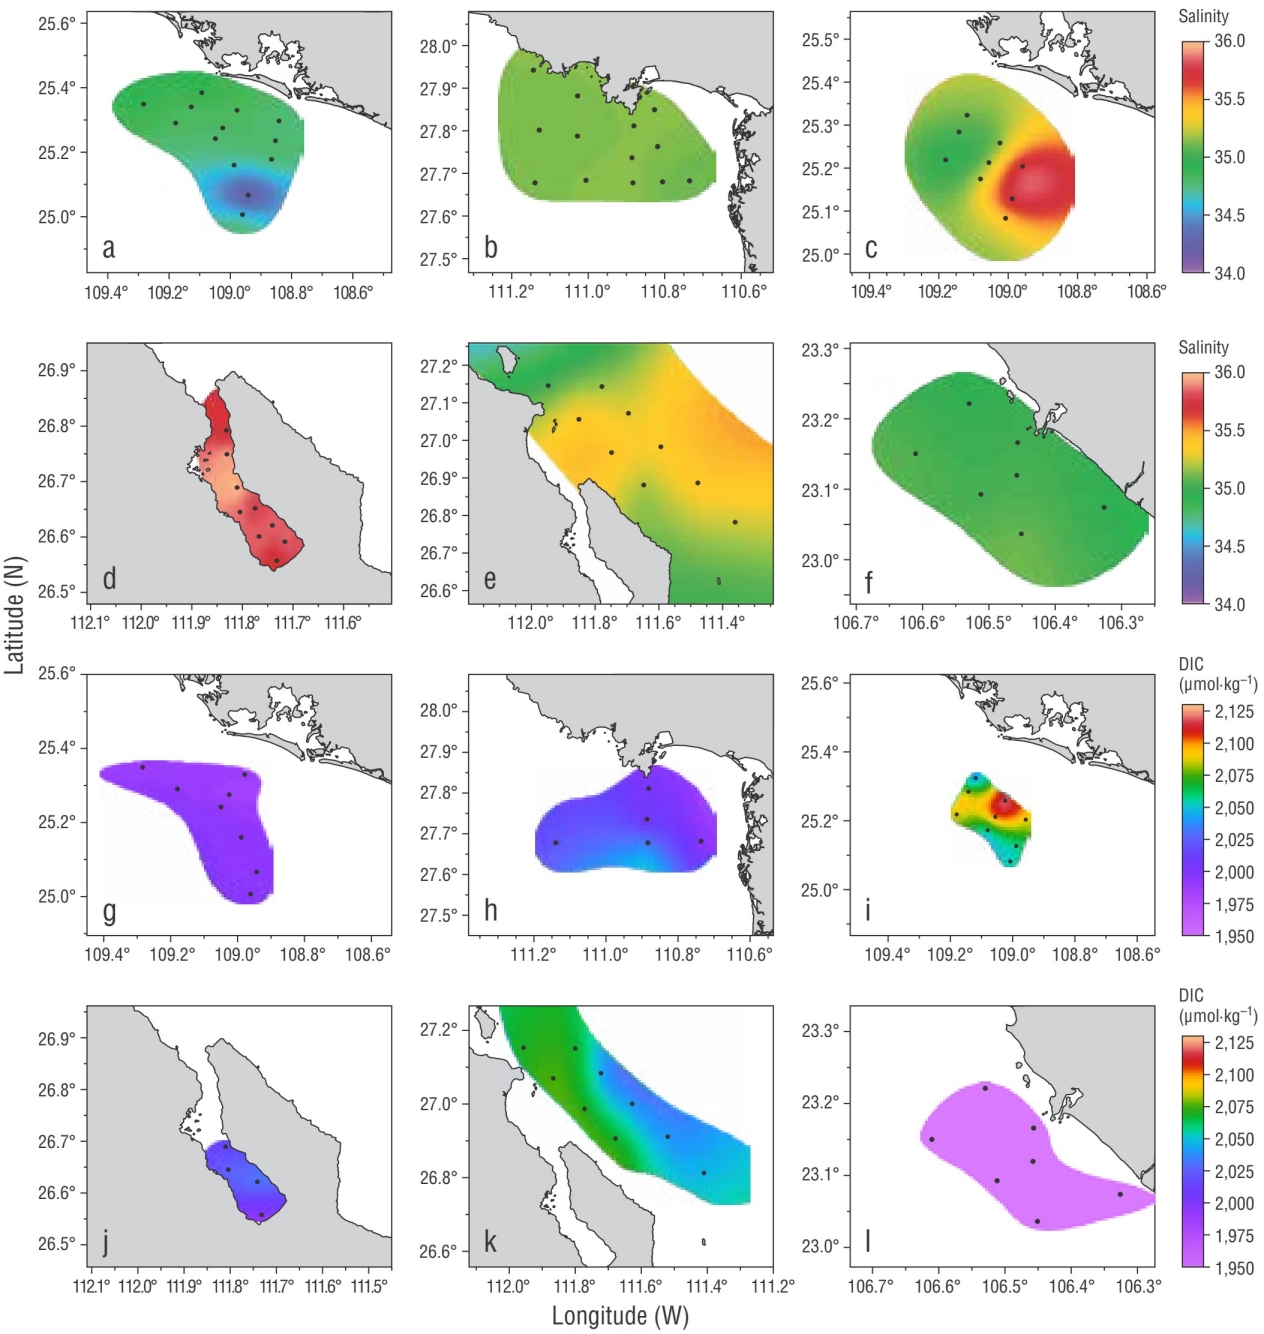
Figure 3 Horizontal distribution of salinity and dissolved inorganic carbon (DIC) for the different subregions: NAV2016 (a, g), GUA2016 (b, h), NAV2017 (c, i), BC2017 (d, j), MUL2017 (e, k), and MAZ2017 (f, l). The figures were confectioned using Ocean Data View.
DIC and pCO2W values showed contrasting conditions in NAV2016 (1,994 ± 3.52 µmol·kg-1 and 428 ± 12.21 µatm, respectively; Figs. 3g, 4a) and NAV2017 (2,076 ± 25.08 µmol·kg-1 and 363 ± 46.94 µatm, respectively, Figs. 3i, 4c). In NAV2017, variations of DIC and pCO2W were similar; values of both properties were relatively low at the northernmost station (~2,070 µmol·kg-1 and ~315 µatm, respectively), increased in the central area (~2,120 µmol·kg-1 and ~420 µatm), and decreased towards the south (~2,080 µmol·kg-1 and ~330 µatm). GUA2016 showed little variation of DIC and pCO2W, although with higher values towards the south of the area (2,015 ± 16.22 µmol·kg-1 and 434 ± 29.06 µatm, respectively) (Figs. 3h, 4b). In BC2017, little variation of DIC and slightly more marked variation of pCO2W were recorded (2,017 ± 14.69 µmol·kg-1 and 377 ± 29.45 µatm, respectively) (Figs. 3j, 4d). In MUL2017 there was greater variability; DIC had low values towards the central zone in the open sea and high values towards the edges (2,058 ± 15.05 µmol·kg-1), and pCO2W had higher values to the north of the study area (414 ± 37.79 µatm) (Figs. 3k, 4e). DIC and pCO2W had the lowest values (1,934 ± 5.94 µmol·kg-1 and 305 ± 12.64 µatm, respectively) in MAZ2017, although pCO2W increased in the center of the area (Figs. 3l, 4f). In general, DIC and pCO2W had the highest average values in NAV2017 and GUA2016, respectively, whereas both variables had the lowest values in MAZ2017. All the above information is summarized in Table 1.
Table 1 Mean values (standard deviation) of salinity, dissolved inorganic carbon (DIC), seawater CO2 partial pressure (pCO2W), and ocean-atmosphere CO2 flux (fCO2) during the 6 cruises.
| Location | Salinity | DIC (mmol·kg-1) | pCO2W (μatm) | fCO2 (mmol C·m-2·d-1) |
| NAV2016 | 34.70 (0.21) | 1,994 (3.52) | 428 (12.21) | 0.38 (0.52) |
| GUA2016 | 35.14 (0.01) | 2,015 (16.22) | 434 (29.06) | 0.56 (0.46) |
| NAV2017 | 35.29 (0.29) | 2,076 (25.08) | 363 (46.94) | -0.40 (0.39) |
| BC2017 | 35.94 (0.13) | 2,017 (14.69) | 377 (29.45) | -0.90 (0.87) |
| MUL2017 | 35.28 (0.13) | 2,058 (15.05) | 414 (37.79) | -0.05 (0.74) |
| MAZ2017 | 35.02 (0.05) | 1,934 (5.94) | 305 (12.64) | -2.26 (1.85) |
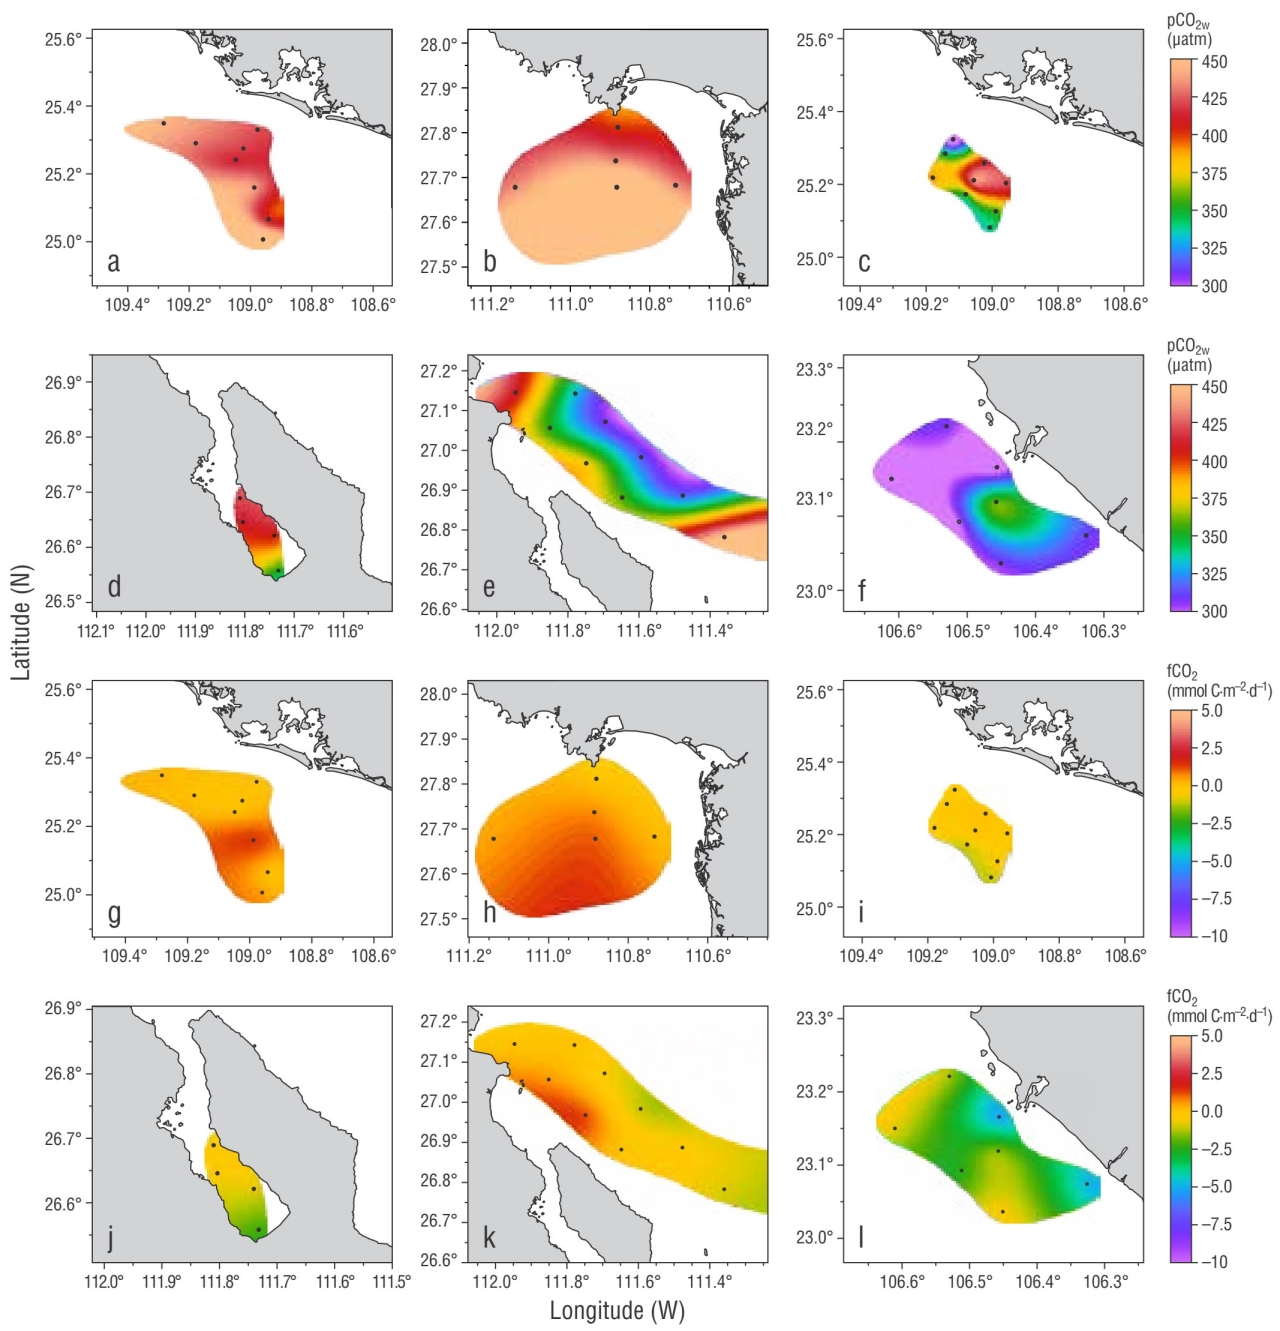
Figure 4 Horizontal distribution of seawater CO2 partial pressure (pCO2W) and CO2 flux variability (fCO2) for the different subregions: NAV2016 (a, g), GUA2016 (b, h), NAV2017 (c, i), BC2017 (d, j), MUL2017 (e, k), and MAZ2017 (f, l). The figures were confectioned using Ocean Data View.
Four of the 5 regions studied behaved as CO2 sinks in March and June 2017: NAV2017, BC2017, MUL2017, and MAZ2017. NAV2016 behaved as a light source of CO2 into the atmosphere; the average fCO2 there was 0.38 ± 0.52 mmol C·m-2·d-1, and values ranged from practically in equilibrium with the atmosphere (0.03 mmol C·m-2·d-1) to 1.57 mmol C·m-2·d-1 (Fig. 4g). In GUA2016, the average fCO2 was 0.56 ± 0.46 mmol C·m-2·d-1; the spatial pattern showed equilibrium values at the most coastal station and maximum values of 1.14 mmol C·m-2·d-1 at the most oceanic station (Fig. 4h). The positive values for September 2016 indicate a slight flow from the sea to the atmosphere. NAV2017 behaved differently; 78% of the area had negative fCO2 values, with an average of -0.40 ± 0.39 mmol C·m-2·d-1 and a range of values from -1.03 to 0.39 mmol C·m-2·d-1 (Fig. 4i). BC2017 trended to larger negative values towards the inner bay, with an average CO2 flux of -0.90 ± 0.87 mmol C·m-2·d-1 (Fig. 4j). MUL2017 showed positive values to the north and negative values to the south, with an average of -0.05 ± 0.74 mmol C·m-2·d-1 and a range of values from -1.01 to 1.37 mmol C·m-2·d-1 (Fig. 4k). The entire area of MAZ2017 showed negative values, with an average of -2.26 ± 1.85 mmol C·m-2·d-1 and a range of values from -4.99 to -0.42 mmol C·m-2·d-1 (Fig. 4l).
Statistics
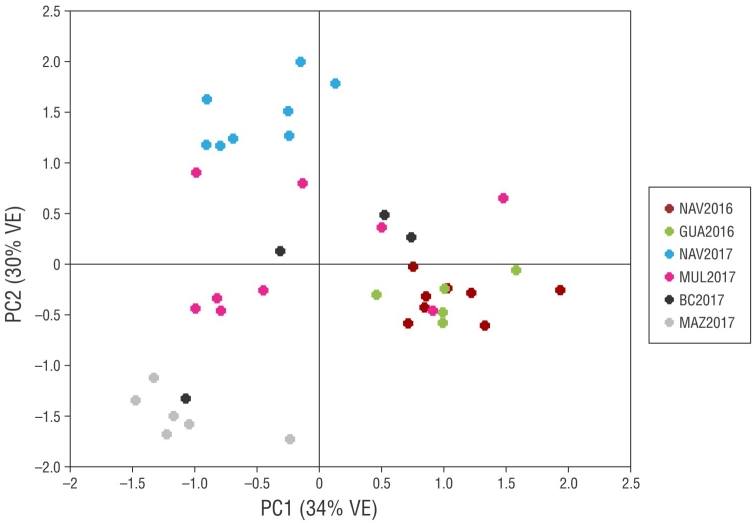
The PCA showed an explained variance of 34% for the first component and 30% for the second (Fig. 5). In the first component, the variables with the greatest weight were DIC, TA, and SST (0.95, 0.80, and -0.74, respectively), and the one with the least contribution was Chlsat (0.57). In the second component, the variables with the greatest weight were pCO2W and pCO2A (0.95 and -0.74, respectively). The zones that were centered throughout the first component were NAV2016, GUA2016, and some MUL2017 stations. NAV2017 and MAZ2017 showed an opposite behavior (Fig. 5). Due to the amount of data recorded per zone, it was difficult to indicate that the weight of the variables suggested that in the primary processes of the carbonate system in NAV2016 and GUA2017 thermal effects predominate and that biological ones do so to a lesser degree. The PCA suggested that biological effects were stronger than physical effects at NAV2017, whereas at MUL2017, BC2017, and MAZ2017, both effects may have contributed similarly.
DISCUSSION
Oceanographic conditions
The circulation pattern in the GC is determined by the presence of eddies at the mouth. In September 2016 (summer, Fig. 2a), we recorded a cyclonic eddy at the mouth, the inflow of water from the western part of the gulf, the presence of anticyclonic eddies, and the outflow of water in the Sinaloa coast. The aforementioned inflow and outflow of water from the gulf coincides with that reported by Portela et al. (2016), but for spring; for summer, they indicated that the water entered through the eastern coast (Sinaloa) and outflowed through the western coast (Baja California). Beier (1997) reported a cyclonic circulation in the GC in summer, which does not coincide with the pattern recorded in this study. The anticyclonic eddies recorded in Guaymas and Sinaloa coincide with that reported by Pegau et al. (2002) from a time series from 1997 to 2001. In March 2017 (winter, Fig. 2b), an anticyclonic eddy appeared at the mouth of the GC, with negative sea level anomalies in practically the entire GC that, despite the geostrophic velocities, were small; in addition, we observed a flow towards the south of the gulf on the peninsular coast, but the influence of the anticyclonic eddy that crossed towards Sinaloa suggests a limited circulation towards the inner gulf. Beier (1997) and Castro et al. (2017) reported an anticyclonic circulation in winter, whereas Castro et al. (2000) reported, in their 1992-1998 study, a cyclonic circulation between winter and spring in the central part of the gulf. This difference in circulation patterns has been reported by Castro et al. (2017), who concluded that mesoscale eddies can modify the seasonal exchange of water at the entrance of the GC. In June 2017 (Fig. 2c) a geostrophic flow towards the inner gulf was recorded off the coast of Sinaloa, indicative of a cyclonic circulation, which coincides with Beier (1997) and Portela et al. (2016). Therefore, this study suggests that the circulation pattern was anticyclonic in the GC in September 2016 (summer) and cyclonic in June 2017 (transition).
The climatic conditions in the GC were contrasting in September 2016 and March 2017, and transitional in June 2017, which coincides with that reported by Roden (1964). September is considered one of the warmest months and March one of the coldest (Soto-Mardones et al. 1999). In September 2016 (Fig. 2d, g), high temperatures (˃30 °C) were associated with low chlorophyll concentrations (˂0.1 mg·m‒3) near the eastern coast, which coincides with what was reported by Santamaría-del-Angel et al. (1999). For March 2017 (Fig. 2e, h), low SSTs (~22 °C) were associated with high Chlsat concentrations (˃2 mg·m‒3) in the eastern coast of the gulf, due to the effect of coastal upwelling in winter. In particular, comparisons of NAV2016 with NAV2017 suggested the presence of coastal upwelling in March and its absence in September (Fig. 2d, e, g, h). In June 2017 (Fig. 2f, i), in the central and southern regions of the GC, SSTs were higher by the mainland than by the peninsula, which coincides with Santamaría-del-Ángel et al. (1999) and Soto-Mardones et al. (1999), mainly for summer (~1 °C difference).
Variability of salinity, dissolved inorganic carbon, pCO2W, and fCO2
The lowest average salinity was recorded in NAV2016, and the highest salinities were recorded in NAV2017 and BC2017 (Fig. 3a, c, d). In GUA2016 (Fig. 3b), surface salinity values >35 indicated the presence of the Gulf of California Water (GCW), which had already been described by Delgadillo-Hinojosa et al. (2001). In NAV2016 (Fig. 3a), values <35 were a result of the presence of transition water and GCW (Portela et al. 2016). The salinity recorded in GUA2016 (Fig. 3b) represents, according to Bray (1988), the general circulation of the GC. In NAV2017 (Fig. 3c), in agreement with what was reported by Castro et al. (2000), salinity values were a combined product of coastal upwelling water and GCW flowing south into the gulf. Concepción Bay (Fig. 3d) is a semi-enclosed bay where solar radiation in summer could have caused water evaporation and increased salinity. In MAZ2017 (Fig. 3f), salinity was homogeneous throughout the area, which suggests that transitional water entered the gulf (Portela et al. 2016). Therefore, in the sampling months (September 2016, March and June 2017), according to salinity records, GCW and transitional water were located at the surface.
In NAV2016, we recorded the highest temperature and Chlsat (
The highest DIC concentration was recorded in NAV2017 (
In BC2017, fCO2 values ranged from -2.15 to -0.16 mmol C·m‒2·d‒1 (Fig. 4j). Chlsat values (data not shown) indicated that much of the area was mesotrophic to eutrophic, with possible high photosynthetic activity in the days prior to sampling, which could have caused the negative fCO2 values. However, there are spatiotemporal variations between the absorption and contribution of CO2 in the study area that should be considered in subsequent research to describe the variability of fCO2.
In the MUL2017 region, the average DIC concentration was 2,058 μmol·kg-1, lower than that reported by Hernández-Ayón et al. (2013), who indicated that there was a relationship between the variables of the carbonate system and the water masses in the region of the Midriff Islands and reported values of ~2,080 μmol·kg-1 for the summer of 2004. The spatial variability of DIC in this region could be due to the cyclonic eddy found in this area, with differences in the intensity of the geostrophic current (Fig. 2c); this eddy could have influenced the pCO2W values to be below equilibrium to the south of the area and to be positive to the north of the area, probably due to the shearing of the water, which promotes the release of CO2 into the atmosphere. Therefore, the fCO2 value of -0.05 mmol C·m-2·d-1 (Fig. 4k) was probably due to combined physical and biological effects.
The flow of water into the GC along the eastern coast in MAZ2017 carried
properties that resulted in the lowest concentration records of
Chlsat, DIC, pCO2W, and fCO2 (
Correlations
The PCA grouped, on the one hand, NAV2016 and GUA2016, where anticyclonic eddies predominated and the variables were similar, except Chlsat. On the other hand, it grouped NAV2017 and MAZ2017, both with the lowest fCO2 values; in the first, the negative sea level anomaly predominated, and in the second, the coastal flow on the eastern coast. Therefore, the fCO2 is determined by the oceanographic conditions of the area, which acts as a source or sink at different times.
It is important to consider that the GC is part of the great oceanographic dynamics of the eastern Pacific. According to Rodríguez-Ibáñez et al. (2013), the net contribution of nutrients and DIC is not transported homogeneously throughout the GC, due to regional differences in physical dynamics, which promotes variations in CO2 fluxes. These authors reported that, in a one-year average, the GC was a light emitter. In the present study, the average of the samplings carried out in 2016 and 2017 in the 5 coastal zones was -0.42 mol C·m-2·d-1, which suggests that the GC behaved as a light CO2 sink. Laruelle et al. (2014) classified GC as a CO2 emitter (0-1 mol C·m-2·y-1). In regions dominated by coastal upwelling on the eastern edges, when there are changes in coastal currents, and these occur in short time scales, the physical and biological processes are modified, as well as the ocean-atmosphere CO2 equilibrium conditions (Cai et al. 2020). Concentrations of DIC, pCO2W, and, therefore, the fCO2 are associated with the oceanographic dynamics of the area and, among others, with the presence of mesoscale processes, coastal upwelling, advection, and biological processes. Thus, oceanographic conditions in the GC (such as cyclonic eddies, anticyclonic eddies, and coastal upwelling) and its biology, which vary throughout it and in time, influenced changes in pCO2W and fCO2. Based on the information obtained in this study in the 5 zones, we describe possible responses to understand the mechanisms by which a positive or negative ocean-atmosphere CO2 exchange occurs; nevertheless, substantial efforts are needed for more information at the spatial and temporal level to further the understanding of CO2 flux dynamics in the GC.
Coronado-Álvarez et al. (2017) created time series of SST, salinity, and pCO2W with high-frequency point data (every 3 h) recorded by a MAPCO2 system (for more details see Sutton et al. 2014) anchored to an oceanographic buoy. With the Observatorio del Monitoreo Costero (Coastal Monitoring Observatory), these authors obtained a 7-year time series, off the northwest of Baja California, in an area of intense upwelling. Coronado-Álvarez et al. (2017) observed significant changes in these properties and in fCO2 that lasted for periods as short as hours and as long as interannual segments. Their spectral analysis showed significant semidiurnal, diurnal, ~15-d, and ~28-d variance components. Their description is very limited because they only used data for one geographic point, but their results indicate that those of the present study should be taken as preliminary results because they are instantaneous for each cruise. Continued efforts are needed to understand and more appropriately piece together the puzzle of the role GC plays in fCO2.

