


 text new page (beta)
 English (pdf)
 Article in xml format
 Article references
 Send this article by e-mail
 Cited by SciELO
  Similars in
SciELO
Similars in
SciELO 
 Permalink
Introduction
In general, coastal upwelling areas are the most productive zones in the marine environment, especially the ones in regions with eastern boundary currents (Hill et al. 1998). High phytoplankton biomass (chlorophyll a ~150 mg·m-2) and primary production (~3.5 g Cm-2·d-1) values are observed during upwelling events. Although these coastal ecosystems make up only 1% of the ocean surface, they provide ~11% of the 7.2 Gt C·y-1 of new production (Chavez and Toggweiler 1995). For instance, in the Peruvian-Chilean coastal system, one of the most productive coastal systems in the world (4 to 20 g Cm-2·d-1, Daneri et al. 2000), upwelling of deep waters with high partial pressure of carbon dioxide, low temperatures, low oxygen concentrations, and high nutrient concentrations (e.g., Strub et al. 1998) results in high phytoplankton productivity within a narrow coastal band. This high productivity is mainly due to the contribution of large cells (>20 µm) such as diatoms, which is prompted by an increase in nitrate concentrations (Chavez and Messié 2009, Varela et al. 2010). During upwelling relaxation periods, however, there is an increase of nanoplankton cells (<5 µm) and heterotrophic bacteria (Wetz and Wheeler 2004, Sherr et al. 2005).
The California Current is a cold current; at its southern limit, it is influenced by warm subtropical climate and the confluence of coastal currents flowing from the equator northward (Durazo and Baumgartner 2002, Durazo 2009). Off the western coast of the Baja California Peninsula, Mexico, several coastal upwelling areas (Walsh et al. 1977, Zaytsev et al. 2003) with increasing phytoplankton (~50 × 106 cells·L-1) and zooplankton (~1 g·m-3 wet weight) biomass during upwelling events (Cervantes-Duarte et al. 1993, Martínez-López and Verdugo-Díaz 2000) have been identified and studied. Upwelling intensity along the peninsula decreases towards the tropics; the coastal area off Magdalena Bay is the southernmost upwelling area and the one with the least upwelling intensity (Zaytsev et al. 2003, Auad et al. 2011). However, the Magdalena-Almejas area is one of the most productive and biologically diverse lagoon systems on the Pacific coast of Mexico (Lluch-Belda et al. 2003), and it is therefore an area with a high percentage of fishery production in Baja California Sur, a state occupying fourth place in fishery production nationwide (CONAPESCA 2013). The seasonal variation of hydrographic conditions and its relation to primary production in the region have been studied by Kahru et al. (2009) and Cervantes-Duarte et al. (2015); these authors reported a latitudinal (south-north) productivity increase, with maximum values during intense upwelling periods. In addition, climate events such as El Niño affect phytoplankton communities along the coasts of Baja California, reducing diversity and increasing the contribution of subtropical groups such as coccolithophores (Hernández-Becerril et al. 2007). The objective of this study was therefore to evaluate the effect of environmental variability on phytoplankton biomass and primary production off Magdalena Bay, Baja California Sur, Mexico.
Materials and methods
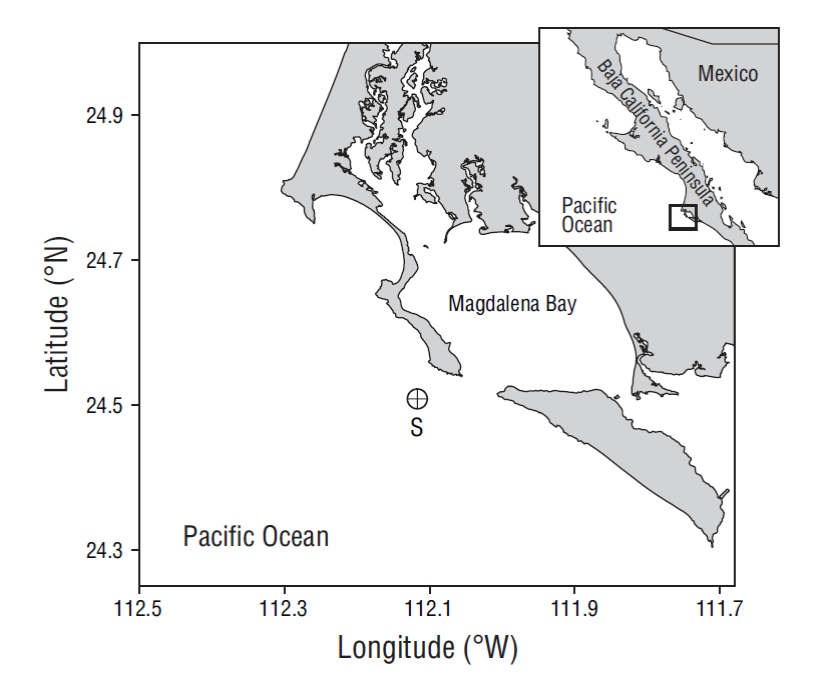
Hydrographic data and phytoplankton biomass and primary production data were collected monthly between April 2013 and August 2014 at a station off Magdalena Bay (24.5ºN, 112.1ºW; Fig. 1) aboard the vessel CICIMAR-30. Temperature and salinity vertical profiles were obtained during each survey using a Sea-Bird Electronics 19 CTD. Water samples were collected at 5 depths corresponding to different irradiance levels (100%, 33%, 10%, 3%, and 1%); irradiance levels were estimated using Secchi disc water transparency measurements (Kd = 1.7/ZD, where Kd is the diffuse attenuation coefficient [m] and ZD is the depth at which the Secchi disc can no longer be seen [m]; Kirk 1994). Water samples were collected with 5-L Niskin bottles to determine nitrate, phosphate, and silicate concentrations, chlorophyll a contents, and phytoplankton biomass. In addition, water samples were collected with 2-mL Eppendorf tubes to count phytoplankton cells by flow cytometry. Samples were fixed with 100 µL of 10% paraformaldehyde and frozen at -10 ºC until analysis (4 months after the last cruise). For the counts, 1:1 sample dilutions were prepared with filtered sea water and 10 µL of microbeads measuring 10 µm in diameter. Counts were performed using a Beckman Coulter CyAn ADP flow cytometer equipped with 3 excitation lasers (405, 488, and 635 nm) to measure size, complexity, and fluorescence (Watson 2005, Aquino-Cruz et al. 2013). Results were analyzed using Infinicyt 1.6.
Samples collected in 200-mL flasks between April and June 2013 were fixed with Lugol acetate and analyzed to determine cell abundance and the main phytoplankton species during intense upwelling periods (Zaytsev et al. 2003). Cells were then counted in 10, 25, and 50-mL sedimentation chambers using the Utermöhl (1958) method and the criteria defined by Hasle (1978) and Andersen and Throndsen (2004). For the nutrient (except silicate) and chlorophyll a analyses, 1 L of seawater was filtered through 25-mm-diameter glass fiber filters (GF/F, ~0.7 µm pore size). Nutrient concentrations and chlorophyll a contents were analyzed by spectrophotometry (Strickland and Parsons 1972). Chlorophyll a was extracted with 10 mL of 90% acetone, refrigerated for 24 h, and analyzed with a Genesis 2 spectrophotometer (Venrick and Hayward 1984). To estimate primary production (PP) rates, duplicate samples were collected in 250-mL polycarbonate bottles. Together with a dark bottle, the bottles containing the samples were inoculated with 5 µCi of NH14CO3 and incubated for 2 h at midday according to the Steeman-Nielsen (1952) method. Samples were then filtered through Nucleopore GN-6 filters (0.45 µm pore size). Filters were placed in 20-mL scintillation vials with 0.5 mL of 10% HCl for 3 h to purge carbon not fixed by photosynthesis; thereafter, 10 mL of scintillation fluid (Ecolite) were added and the activity was determined with a Beckman LS 6500 scintillation counter. Carbon assimilation by phytoplankton or PP (mg Cm-3·h-1) was calculated with the equations used by Parsons et al. (1984). To analyze nutrient availability and nutrient uptake by phytoplankton, the nitrate:phosphate (N:P) and silicate:phosphate (Si:P) ratios were assessed for linearity and significance (P < 0.05) after performing a Pearson correlation with STATISTICA 8 software. The integration method used for the measured variables was the sum of the areas of simple polygons.
Results
Hydrographic characteristics
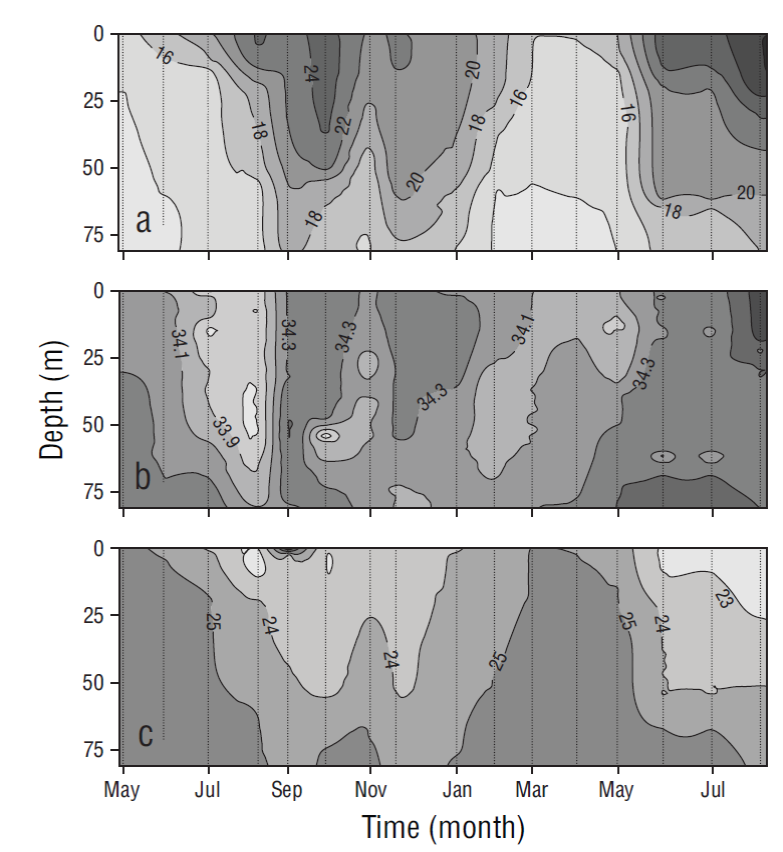
Temperature, salinity, and density showed seasonal patterns. Relatively cold periods were observed from May to June 2013 and from March to June 2014, and a warm period was observed from July 2013 to February 2014. The water column (80 m) was mixed during the cold period and stratified during the warm period (Fig. 2). During the cold months, temperature ranged from 13.09 to 25.02 ºC, salinity from 33.61 to 34.50, and density from 22.90 to 25.95 kg·m-3. During the warm months (August-February), temperature ranged from 13.86 to 29.28 ºC and the thermocline was deep (~50 m) from August to October; salinity ranged from 33.68 to 34.70 and density from 21.74 to 25.54 kg·m-3 (Fig. 2).
Nutrient distribution
Variations in nitrate, phosphate, and silicate concentrations were observed with depth and the changing seasons of the year. In general, concentrations increased from the surface toward the bottom of the water column, which was mixed during the cold months and stratified during the warm months (Fig. 3). The integrated values of all nutrient concentrations in the water column showed that concentrations were higher during the cold period than during the warm period (Table 1).
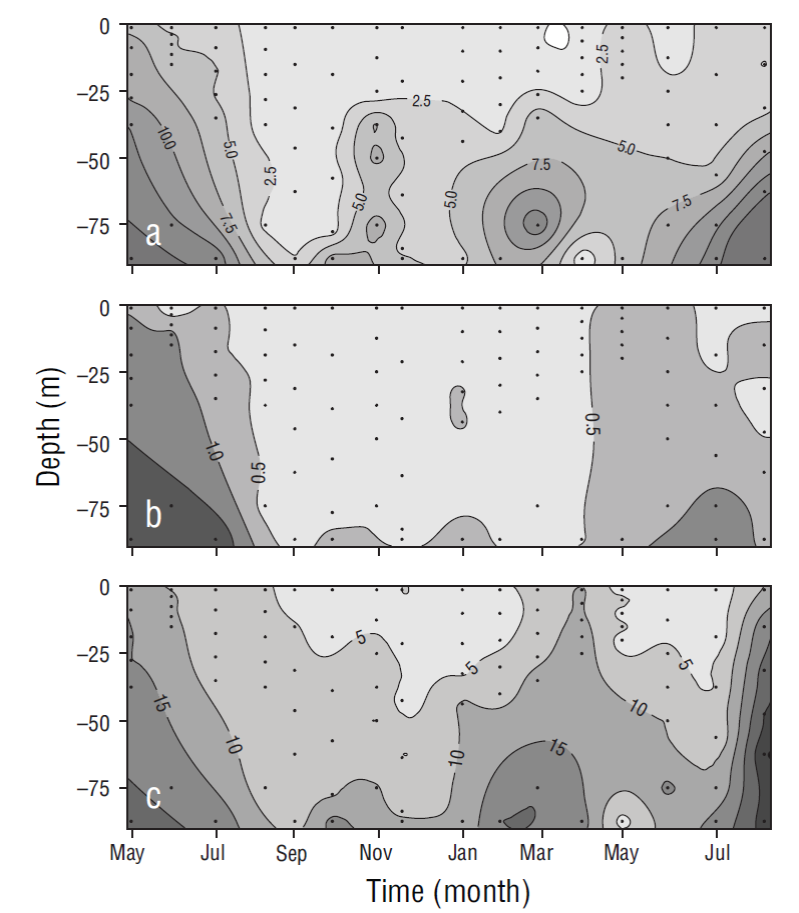
Figure 3 Temporal distribution for nitrate (a), phosphate (b), and silicate (c) concentrations (µM) at the sampling site. Dots show sampling frequency (5 samples in the euphotic zone and 1 close to the bottom).
Table 1 Integrated values of nutrient concentrations (mmol·m-2) in the water column (0-80 m) at the sampling site. **Extreme values not considered in the mean.
| Date | March-July (cold) | August-February (warm) | |||||
| Nitrate | Phosphate | Silicate | Nitrate | Phosphate | Silicate | ||
| 27 Apr 2013 | 692 | 125** | 1,458** | ||||
| 29 May 2013 | 869** | 97 | 1,237 | ||||
| 28 Jun 2013 | 519 | 76 | 843 | ||||
| 31 Jul 2013 | 563 | 78 | 761 | ||||
| 06 Sep 2013 | 81** | 17 | 421 | ||||
| 28 Sep 2013 | 144 | 12 | 430 | ||||
| 26 Oct 2013 | 96 | 12 | 498 | ||||
| 28 Nov 2013 | 313 | 17 | 479 | ||||
| 17 Dec 2013 | 191 | 13 | 315** | ||||
| 31 Jan 2014 | 234 | 39 | 566 | ||||
| 28 Feb 2014 | 233 | 12 | 695 | ||||
| 28 Mar 2014 | 340 | 17** | 718 | ||||
| 30 Apr 2014 | 45** | 31 | 960 | ||||
| 30 May 2014 | 359 | 55 | 217** | ||||
| 03 Jul 2014 | 250 | 40 | 505 | ||||
| 08 Aug 2014 | 441 | 53** | 400 | ||||
| 13 Sep 2014 | 687** | 44 | 1,635** | ||||
| Mean | 454 | 63 | 837 | 202 | 21 | 515 | |
The N:P ratio (6.7:1.0 [r = 0.76, n = 48]) for the March-July period was significant (P < 0.05). The correlation for the August-February period (10.3:1.0 [r = 0.67, n = 54]) was also significant (P < 0.05). The Si:P ratio was 13.5:1.0 (r = 0.66, n = 48) in the March-July period and 15.7:1.0 (r = 0.51, n = 54) in the August-February period (P < 0.05).
Phytoplankton biomass and primary production
In general, phytoplankton biomass, for which chlorophyll a concentration was used as proxy, and PP were highest at the surface. The chlorophyll a and PP values for June at 100% (7.6 mg·m-3 and 80.4 mg Cm-3·h-1, respectively) and 30% (7.9 mg·m-3 and 78.1 mg Cm-3·h-1) light levels decreased toward the deeper part of the euphotic zone at 1% light level (4.7 mg·m-3 and 4.4 mg C·m-3·h-1) (Fig. 4). Average chlorophyll a (2.6 mg·m-3 and 89 mg·m-2, surface and integrated values, respectively) and integrated PP (196 mg Cm-2·h-1) values for the March-July period were higher than the average chlorophyll a (0.6 mg·m-3 and 37 mg·m-2) and PP (43 mg Cm-2·h-1) values for the August-February period (Table 2). The frequency of relatively high values, for both variables, was maximum during the cold period with respect to the warm period. During the study period the relation between chlorophyll a and integrated chlorophyll a in the euphotic zone showed a significant correlation (r = 0.90, n = 17; P < 0.05). Likewise, the correlation between integrated chlorophyll a and integrated PP in the euphotic zone was significant (r = 0.70, n = 17; P < 0.05).
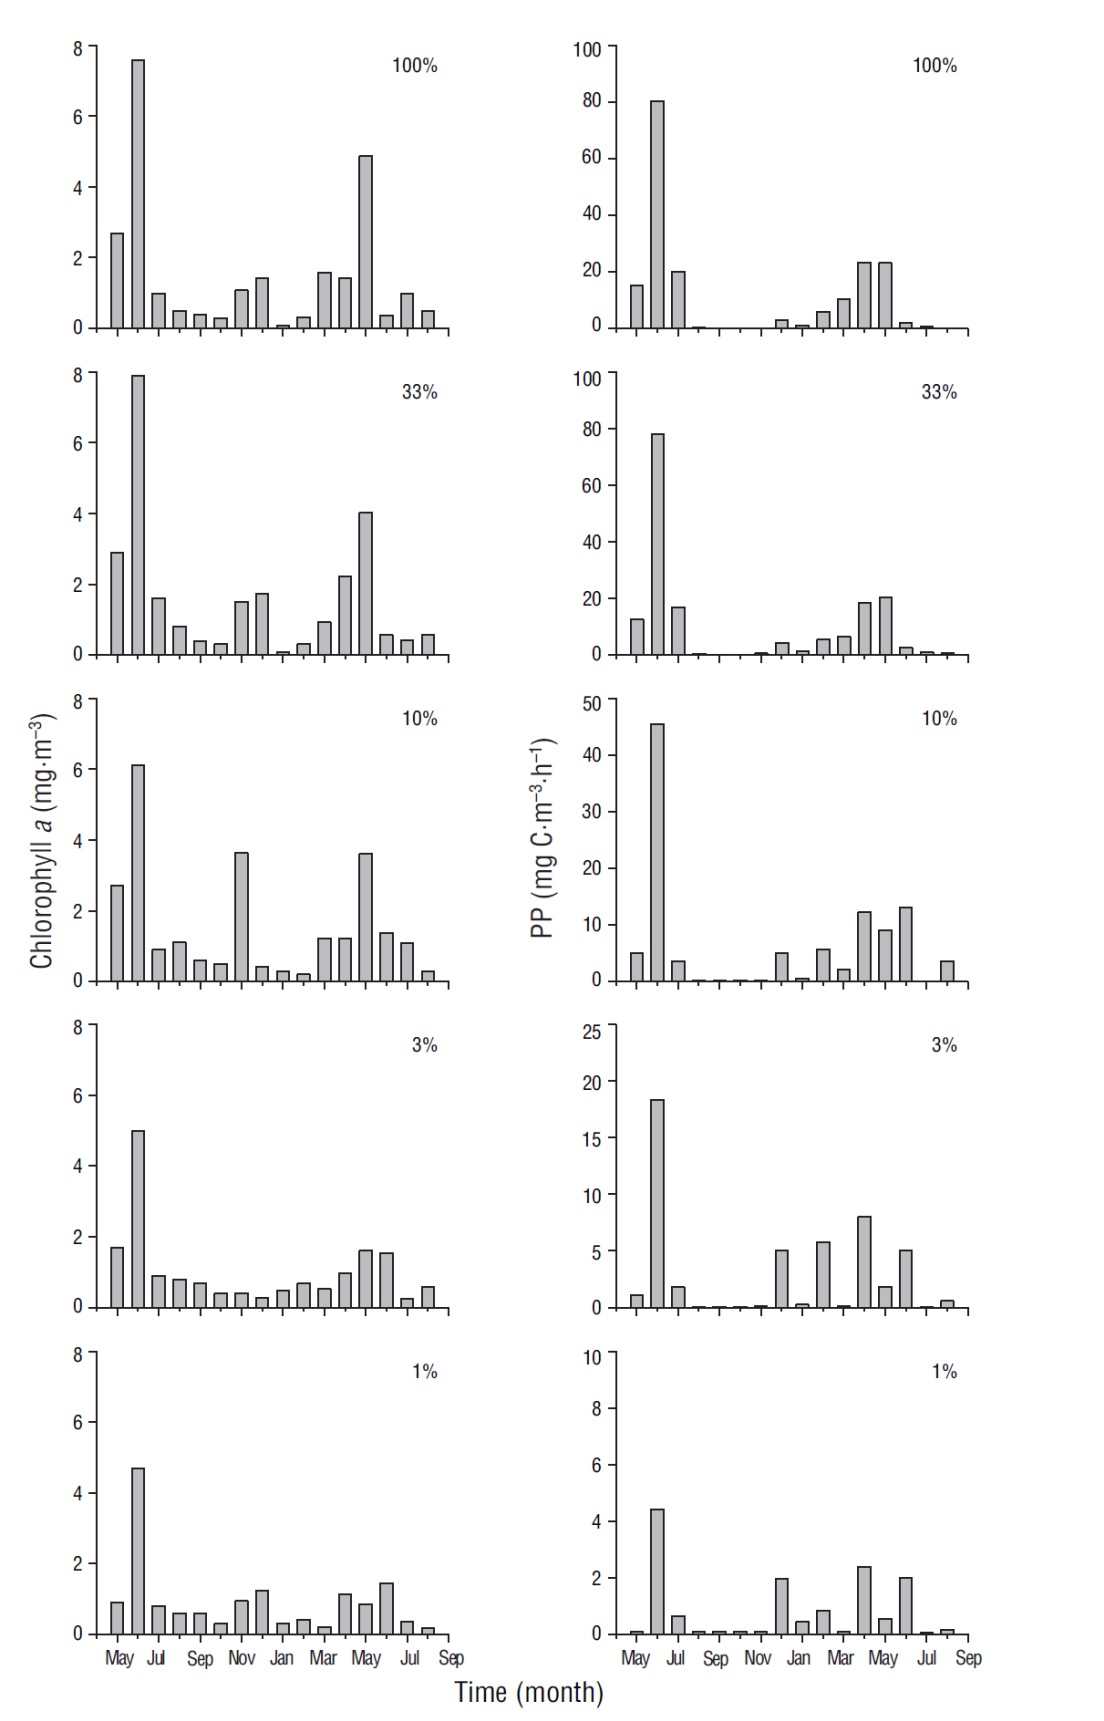
Figure 4 Variation of chlorophyll a (mg·m-3) and primary production (PP) rates (mg C·m-3·h-1) at 100%, 33%, 10%, 3%, and 1% light level at the sampling site.
Table 2 Surface chlorophyll a (Chla, mg·m-3), integrated chlorophyll a (Chlaint, mg·m-2), and primary production integrated in the euphotic zone (PPint, mg Cm-2·h-1) at the sampling site. **Extreme values not considered in the mean.
| March-July (cold) | August-February (warm) | ||||||
| Chla | Chlaint | PPint | Chla | Chlaint | PPint | ||
| 27 Apr 2013 | 3.8 | 158 | 79** | ||||
| 29 May 2013 | 2.7 | 100 | 193 | ||||
| 28 Jun 2013 | 7.6** | 231** | 553** | ||||
| 31 Jul 2013 | 1.0 | 55 | 228 | ||||
| 06 Sep 2013 | 0.5 | 41 | 7 | ||||
| 28 Sep 2013 | 0.4 | 38 | 5** | ||||
| 26 Oct 2013 | 0.3 | 25 | 8 | ||||
| 28 Nov 2013 | 1.1 | 75** | 10 | ||||
| 17 Dec 2013 | 1.4** | 68 | 286** | ||||
| 31 Jan 2014 | 0.1** | 16** | 24 | ||||
| 28 Feb 2014 | 0.3 | 25 | 163 | ||||
| 28 Mar 2014 | 1.6 | 34** | 98 | ||||
| 30 Apr 2014 | 1.4 | 74 | 259 | ||||
| 30 May 2014 | 4.9 | 85 | 173 | ||||
| 03 Jul 2014 | 0.4** | 63 | 227 | ||||
| 08 Aug 2014 | 1.0 | 39 | 22 | ||||
| 13 Sep 2014 | 0.5 | 26 | 65 | ||||
| Mean | 2.6 | 89 | 196 | 0.6 | 37 | 43 | |
Abundance of phytoplankton cells <20 µm, measured by flow cytometry, during the study period was highest in March-July, ranging from 0.1 × 10⁶ cells·L-1 (in July at 3% light level) to 66 × 106 cells·L-1 (in June at the surface) (Fig. 5). In August-February values tended to be lower, ranging from 0.1 × 10⁶ cells·L-1 (in September at 10% light level) to 8 × 10⁶ cells·L-1 in September (at the surface).
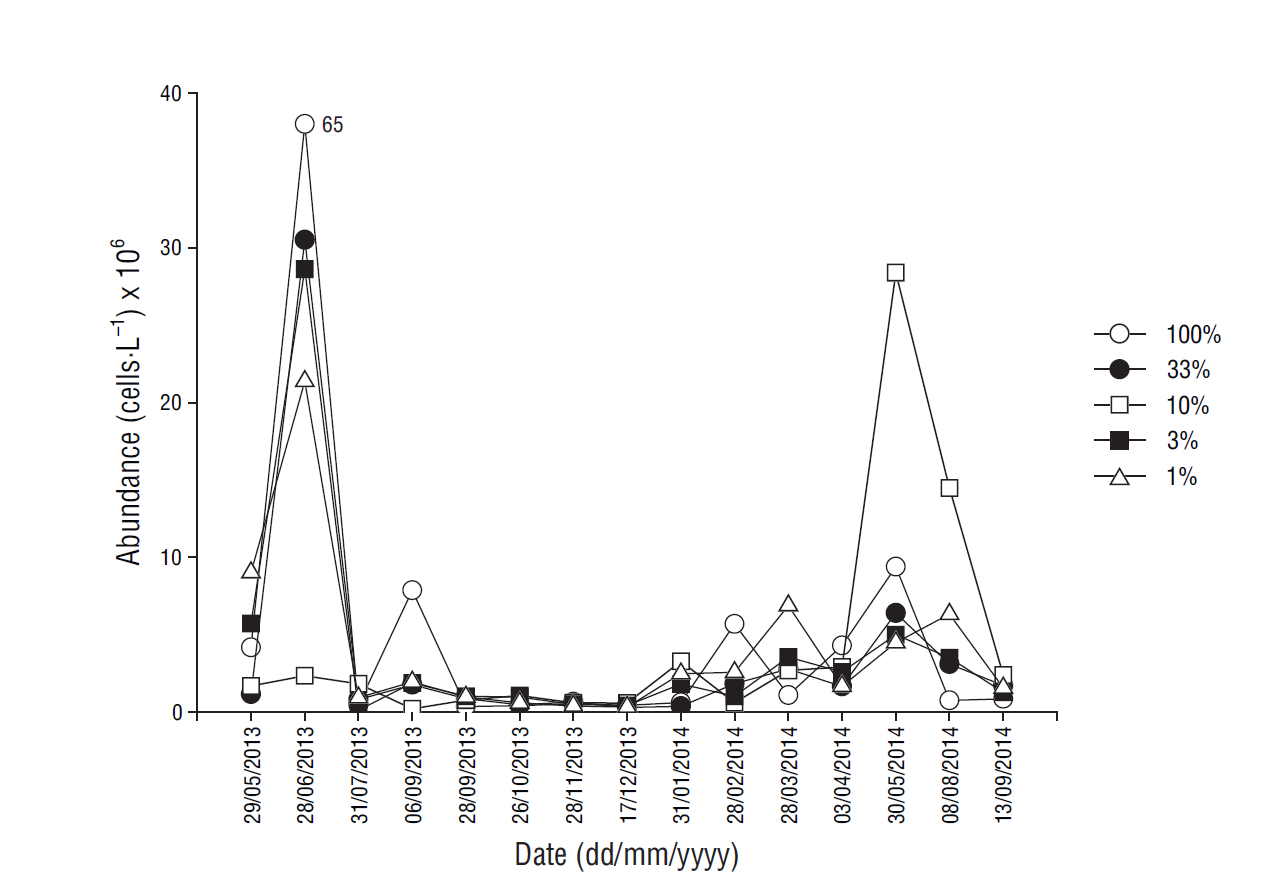
Figure 5 Distribution of phytoplankton abundance (cells·L-1) at each light level at the sampling site.
Cell abundance, measured by microscopy, for April, May, and June 2013 showed that, in general, nanoplankton was more abundant than microplankton, with values ranging from 3.5 × 10³ cells·L-1 (in April at the surface) to 1.7 × 10⁶ cells·L-1 (in June at the surface) (Table 3). Microplankton during the same period ranged in abundance from 200 cells·L-1 (in April at the surface) to 42.2 × 10³ cells·L-1 (in June at 3% light level) and was mainly dominated by diatoms and dinoflagellates. In general, diatoms were the most abundant species of microplankton, ranging from 120 cells·L-1 (in April at the surface) to 26.5 × 10³ cells·L-1 (in June at 3% light level). Dinoflagellates showed maximum contributions (>80%) to phytoplankton at 2 depths in June, with 15.7 × 10³ and 11.2 × 10³ cells·L-1 at 3% and 1% light levels, respectively (Table 3).
Table 3 Phytoplankton abundance from April to June 2013.
| Date | Light (%) |
Depth (m) |
Nanoplankton (cells·L-1) |
Microplankton (cells·L-1) |
Diatoms (cells·L-1) |
Dinoflagellates (cells·L-1) |
| 27 Apr 2013 | 100 | 0 | 3,528 | 200 | 120 | 80 |
| 27 Apr 2013 | 3 | 15 | 11,893 | 2,243 | 2,019 | 224 |
| 27 Apr 2013 | 1 | 20 | 38,597 | 1,795 | 1,496 | 299 |
| 29 May 2013 | 100 | 0 | 9,425 | 5,386 | 3,142 | 2,244 |
| 29 May 2013 | 33 | 7 | 99,183 | 28,723 | 25,133 | 3,590 |
| 29 May 2013 | 10 | 15 | 109,356 | 1,116 | 1,116 | 0 |
| 28 Jun 2013 | 100 | 0 | 1,714,520 | 13,775 | 5,213 | 8,562 |
| 28 Jun 2013 | 33 | 3 | 11,893 | 4,808 | 993 | 3,815 |
| 28 Jun 2013 | 10 | 6 | 17,055 | 13,358 | 9,279 | 4,079 |
| 28 Jun 2013 | 3 | 9 | 8,079 | 42,187 | 26,479 | 15,708 |
| 28 Jun 2013 | 1 | 12 | 4,488 | 26,928 | 15,708 | 11,220 |
Discussion
The monthly distribution of temperature, salinity, and density in the water column (80 m) for the period between May 2013 and August 2014 revealed at least 2 different oceanographic events. The first event was observed from March to June and it consisted in the presence of relatively cold and dense water that was distributed nearly homogeneously throughout the water column and was influenced mainly by water from the California Current (transitional water of subarctic origin). The second event was observed from August to February and it consisted in the presence of warm, less-dense water in the upper layers that was associated with water of tropical origin (Lynn and Simpson 1987, Zaitsev et al. 2014) (Fig. 6). Variation in nitrate, phosphate, and silicate concentrations at the study site showed that values were higher near the surface during the relatively colder months, when conditions were associated with intense upwelling (spring and early summer), and lower during the rest of the year, when water temperatures increased and upwelling events were weaker and less frequent (Durazo and Baumgartner 2002, Durazo 2009, Murillo-Murillo et al. 2013). The N:P and Si:P ratios in the water column were lower than the Redfield ratio (16N:1P) for oceanic waters but similar to ratios reported for coastal environments, where anthropogenic nutrient inputs are generally significant (Pilson 2013). The N:P ratio was lower in the March-July period than in August-February (6.7:1.0 and 10.3:1.0, respectively), indicating higher use of nitrogen from subsurface waters during upwelling processes. As a nutrient silicate differs from the inorganic compounds of nitrogen and phosphorus because it is not a universal requirement of organic matter (Redfield et al. 1963). However, the silicate cycle corresponds in many ways with the phosphorus cycle, as depletion and remineralization occur simultaneously. The ratios of change (15Si:1P) were similar to the N:P ratios (Redfield et al. 1963). In general, the proportion of silicate concentrations to phosphorus and nitrate concentrations in the ocean varies greatly depending on the proportion of diatoms to other phytoplankton groups that do not require silica. Dissolution of diatom silica is believed to follow a path different from the oxidation of organic matter (Redfield et al. 1963). In this study the Si:P ratio was lower in March-July than in August-February (10.3:1.0 and 15.7:1.0, respectively), and this is probably associated with diatom abundance during this season (Martínez-López and Verdugo-Díaz 2000).
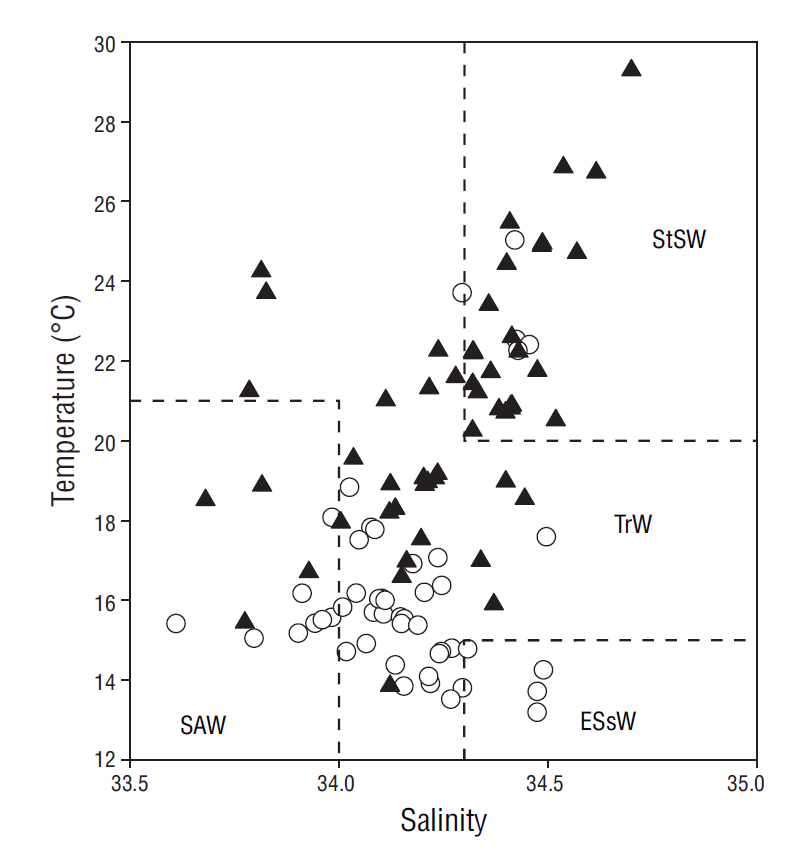
Figure 6 Temperature-salinity diagram drawn from data collected at the sampling depths (0-80 m). Empty circles correspond to data from the March-July period and filled triangles to data from the August-February period. Water masses were defined according to Durazo and Baumgartner (2002): SAW = Subartic Water; ESsW = Equatorial Subsurface Water; TrW = Transitional Water; and StSW = Subtropical Surface Water.
During the study period, phytoplankton biomass and PP varied with prevailing oceanographic conditions. The highest biomass and PP values were recorded in March-July (cold period) and were concomitant with the highest nutrient concentrations in the water column (Tables 1, 2). Average chlorophyll a concentrations of >1 mg·m-3 and PP values of ~128 mg Cm-2·h-1 could be considered distinctive characteristics of a coastal euphotic zone during this period (Gaxiola-Castro et al. 2010). Spring and summer are characterized by an increase in coastal upwelling events along the Baja California Peninsula, especially in March, April, and May (Zaytsev et al. 2003, Pérez-Brunius et al. 2007), and these upwelling events are also associated with the increase in the seasonal flow of the California Current (Durazo et al. 2010). Both upwelling and the increased seasonal flow of this current boost nutrient inputs to surface waters, fertilizing the zone near the coast and stimulating greater phytoplankton growth (Gaxiola-Castro et al. 2010). According to information from the Pacific Fisheries Environmental Laboratory (https://www.pfeg.noaa.gov/products/PFEL/modeled/indices/upwelling/NA/data_download.html), the highest biomass (231 mg·m-2) and integrated PP (553 mg Cm-2·h-1) values occurred in June 2013 at a site (24ºN and 113ºW) under intense upwelling conditions (upwelling indices of 147 and 205 m3·s-1 per 100 m of coastline for 29 and 30 June, respectively) and high nutrient concentrations (nitrate = 519 mmol·m-2, phosphate = 76 mmol·m-2, and silicate = 843 mmol·m-2). These values are comparable to the maximum values observed in Cabo Corrientes (447 mg Cm-2·h-1, López-Sandoval et al. 2009) and to values recorded in the Gulf of Ulloa, Baja California (Gaxiola-Castro et al. 2010). During the August-February period nutrient and chlorophyll a concentrations and PP in the water column were lower with respect to the March-July period (Tables 1, 2). Average integrated chlorophyll a was 37 mg·m-2 and is comparable to the minimum (25 mg·m-2) reported for the Mexican Investigations of the California Current (IMECOCAL) network in the autumn-winter period (Gaxiola-Castro et al. 2010). Valle-Rodríguez and Trasviña-Castro (2017) determined the presence of a poleward flowing current, with speeds of 0.2-0.3 m·s-1, near the coast of the Baja California Peninsula during the summer, and this current is probably responsible for the temperature maxima reported in this study. For the 1998-2007 period, the IMECOCAL program reported that in situ chlorophyll a concentrations in winter and autumn were lower in comparison with the high spring values (Gaxiola-Castro et al. 2010). Phytoplankton biomass was higher during the intense upwelling period (March-July) compared to lower biomass values recorded during weak upwelling events (August-February) (Fig. 7).
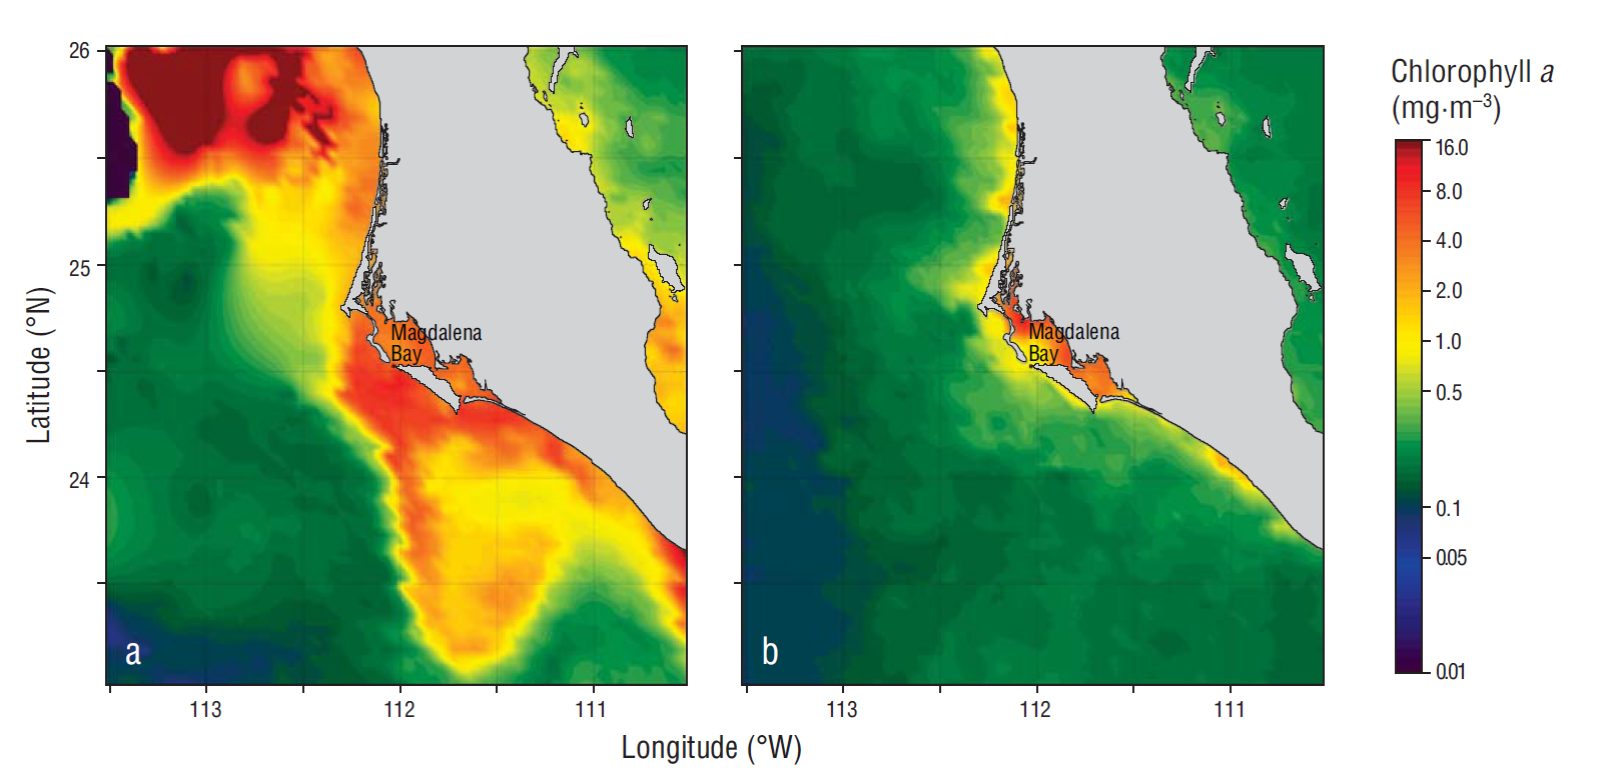
Figure 7 Chlorophyll a images for the Magdalena Bay region (Mexico), as derived from the Aqua-MODIS mean monthly composites (4 km resolution) from June (a) and September (b) 2013.
The relation between surface chlorophyll a and integrated chlorophyll a and between integrated chlorophyll a and integrated PP showed significant linear correlations during the study period. The equation (integrated chlorophyll a) = [(24.6 × surface chlorophyll a) + 26] will allow estimating the integrated chlorophyll a concentration in the euphotic zone using surface chlorophyll a data. The correlation between integrated chlorophyll a and integrated PP found in the present study was analogous to that reported for the IMECOCAL area for all 4 seasons of the year. The equation that allows estimating integrated PP from integrated chlorophyll a data is the following: (integrated PP) = [(1.8 × integrated chlorophyll a) + 16].
Phytoplankton abundance, estimated by flow cytometry and by microscopy (April, May, and June), was dominated by cells <20 µm in size (nanophytoplankton). Studies of the Magdalena-Almejas lagoon system during conditions following the 1982-1983 El Niño event showed that nanoplankton was more abundant in August and September 1984, when temperature was high (Gárate-Lizárraga and Siqueiros-Beltrones 1998). Studies of phytoplankton structure in the Magdalena Bay system, under “normal” conditions in 1988 and 1989, showed that nanoplankton contributed the largest portion (791,760 cells·L-1) of total phytoplankton abundance throughout the sampling period, especially at the beginning of 1989, and it was dominant mainly at the surface and at 10 m depth (Gárate-Lizárraga et al. 2001). In this study, nanophytoplankton abundance was highest -(1,719,284 cells·L-1 at the surface) on 28 June 2013. The nanoplankton fraction, which was represented by coccolithophores, comprised a significant portion (almost 90% of total cells) of phytoplankton abundance off Magdalena Bay during an El Niño event in April 1998, but chain-forming diatoms larger in size were highly abundant (up to 6.7 × 10⁵ cells·L-1) in December 1998 (Hernández-Becerril et al. 2007). The presence of coccolithophores was not evident in the samples analyzed during the present study possibly because of the sampling and analytical methods used.
Evidence indicates that the high picoplankton and cyanobacterium abundances, determined from coccoid counts and zeaxanthin concentrations, in upwelling areas off Baja California are associated with upwelling events and high nutrient concentrations (Díaz and Maske 2000, Linacre et al. 2010, Murillo-Murillo et al. 2013). The environmental characteristics of upwelling areas support the “rising tide” hypothesis, which suggests that nutrient increase improves the growth conditions of all phytoplankton sizes including picoplankton (Barber and Hiscock 2006). High abundance of phytoplankton <20 µm (nanoplankton and picoplankton) in upwelling areas such as Magdalena Bay suggests that this fraction makes an important contribution to biomass and PP, especially under mixing and weak stratification conditions (Murillo-Murillo et al. 2013). However, highest productivity has been observed in the March-July period, when upwelling events are most intense, and productivity declines have been observed as upwelling frequency and intensity decrease (Cervantes-Duarte et al. 2015). The high abundances of cells <20 µm recorded by flow cytometry and microscopy in April, May, and June 2013 indicate that this size could be as relevant as microphytoplankton sizes, as was reported by Martínez-López and Verdugo-Díaz (2000) for the same region.
This study showed that the fraction of phytoplankton cells <20 µm made a large contribution to total phytoplankton abundance. In addition, the phytoplankton community in waters off Magdalena Bay showed seasonal variability, similar to that observed in other coastal upwelling regions, with higher phytoplankton abundances and production rates in spring and summer and lower between autumn and winter.

