


 text new page (beta)
 English (pdf)
 Article in xml format
 Article references
 Send this article by e-mail
 Cited by SciELO
  Similars in
SciELO
Similars in
SciELO 
 Permalink
Introduction
Waves that are produced by very intense storms are one of the main mechanisms causing short-term morphological transformations in the coastal zone (Silva et al. 2014). Evidence of the short-term variations in beach morphology caused by the passage of hurricane Dean over Cancún, Quintana Roo (Mexico), in 2007 has already been highlighted by Martell-Dubois et al. (2012). A global assessment of the increasing trend in the risk of human losses was carried out in view of the hazards posed by the impact of hurricanes in the coastal zones (Peduzzi et al. 2012). Using the available historical documentation of the trajectories and characteristics of hurricanes that have affected the coasts of the 5 active regions of the world, Weinkle et al. (2012) found that hurricane damage in coastal zones had increased in recent years. These authors suggested that this increase could be associated with the accelerated increase of infrastructure development near the coastline.
Experts from the Hurricane Research Division of the National Oceanic and Atmospheric Administration (NOAA, USA) provided evidence of increasing hurricane activity in the Caribbean Sea associated with the warm phase of the multidecadal fluctuations in sea surface temperature (Landsea et al. 1999, Goldenberg et al. 2001). This evidence indicates that government officials, emergency managers, and potential victims should be aware of this danger and develop early warning systems.
Blanchon et al. (1997) reported evidence of the destructive effect of hurricane waves on coral reef ecosystems in the Caribbean region. In addition to the negative impacts on marine biodiversity, this destructive effect reduces the capacity of coral reefs to function as natural coastal defense structures (Mariño-Tapia et al. 2014).
Unfortunately, there are still few direct observations of sea state under hurricane conditions both in shallow and transition waters (Kennedy et al. 2010) and in oceanic waters (Oey et al. 2007). This has limited the development, adjustment, and validation of methods for the spectral analysis of sea states associated with these large storms. Wang and Hwang (2001) suggest that a realistic description of these sea states can be attained by the spectral separation of wind sea and swell, which is relevant for scientific and engineering applications.
Young (1998) analyzed a series of 229 scalar spectra obtained during the passage of hurricanes that affected the northeastern coast of Australia. This author found that the spectra measured within a distance up to 8 times the radius of maximum winds of the storm event were unimodal and similar to the spectra obtained under limited fetch conditions. Young (1998) reported that the parametric spectral forms described by the JONSWAP spectrum approximated the data well and attributed this similarity to the effect of nonlinear interactions.
On the other hand, after analyzing directional wave spectra recorded during the passage of hurricanes over the northern coast of Australia, Young (2006) reported that waves in the front quadrants of these storms were dominated by swell, which radiated out from intense wind regions located in the rear quadrants. The author observed no tendency for the spectra to become bimodal in either frequency or direction. Under the observing conditions described by Young (2006), wind duration and fetch could have been insufficient for the development and growth of wind sea. However, the author did find spectra with a smooth directional transition from low to high frequencies.
Aboobacker et al. (2011) analyzed wave data measured in shallow waters during the occurrence of typhoons on the western coast of India and found that the resulting spectra were dominated by SW swell. Nevertheless, Boukhanovsky and Guedes-Soares (2009) observed the presence of bimodal waves in deep-water records obtained off the Atlantic coast of Portugal, and to describe them they developed a model based on numerical optimization techniques using a random linear search algorithm.
Perrie and Resio (2009) found that nonlinear interactions stimulating swell development play an important role in the evolution of swell in oceanic regions far from the point of origin. But these nonlinear interactions are slower than local interactions taking place in the wave-generation area. These authors also found that interactions between wind sea components were greater than the interactions between wind sea and swell, which could explain the presence of bimodal waves. Perrie and Resio (2009) presented a bimodal wave spectrum (in frequency and direction) measured during the passage of Hurricane Wilma off the coast of Duck, North Carolina. More recently, Hu and Chen (2011) found bimodal spectra in 15% of the directional spectra analyzed from hurricane wave data measured in deep waters from the Gulf of Mexico and within a range 8 times the radius of maximum winds of the storm. These authors observed 3 types of bimodal directional spectra in the 2 front quadrants of the hurricane. The bimodal spectra found by Hu and Chen (2011) were (1) far from the hurricane, at a distance 6 to 8 times the radius of maximum winds; (2) bimodal in frequency with significant differences in direction; and (3) bimodal in frequency with same wave direction.
There seems to be incongruity in the results reported by Young (1998, 2006) with respect to the presence or absence of bimodal waves in areas affected by hurricanes. The objective of the present study is to present and analyze bimodal wave (sea and swell) data collected during the passage of hurricanes over the Caribbean coast of Mexico. For this, 183 directional spectra measured during hurricanes Wilma (October 2005), Dean (August 2007), and Rina (October 2011) were analyzed (Fig. 1).

Figure 1 Trajectories for hurricanes Wilma, Dean, and Rina. Location of the AWAC (Nortek) profiler and the ADCP (RDI).
Hurricane Wilma has been one of the most powerful meteorological phenomena affecting the Caribbean coast of Mexico in the past 70 years. The destructive effects of Wilma on the coastal infrastructure were so intense because of its slow and erratic movement, with gale-force winds recorded for over 50 consecutive hours off the coast of the Yucatan Peninsula. Some of the records reported by Silva-Casarín et al. (2009) include the most intense wind gust, with 210 km·h-1, ever reported by the automatic weather station in Cancún and a 24-h rainfall accumulation of 1,576 mm reported by the automatic weather station in Isla Mujeres, Quintana Roo. For Hurricane Wilma, which reached category 5 in the Saffir-Simpson scale, maximum sustained wind speeds of 176 km·h-1 and wind gusts of up to 293 km·h-1 were recorded (Franklin 2008).
Hurricane Dean (category 5) traveled rapidly (30 km·h-1) and, in a nearly straight path, reached maximum wind gusts of up to 270 km·h-1. By contrast, Hurricane Rina moved slowly at an average speed of 9 km·h-1 but grew quickly into a category 3 hurricane, reaching maximum wind gusts of up to 205 km·h-1. Though these 2 hurricanes had a less severe impact on the Caribbean coast of Mexico than Wilma, they are the most notable hurricanes in the region after the atypical season of 2005.
Materials and methods
Directional wave data were recorded with a Nortek Acoustic Wave and Current (AWAC) profiler, which was installed off the coast of Puerto Morelos (Fig. 1). The instrument was installed at 20.7 m depth; thus, the obtained data were direct wave measurements in transition waters under hurricane conditions (Silva-Casarín et al. 2009). This instrument measured sea surface displacement and orbital velocities near the surface. Directional spectra were obtained from the spatial arrangement of sea surface height measured by each of the 4 beams emitted by the instrument. Wave signals during the study period were measured at 1,024-s intervals every 2 h and at a 4-Hz sampling frequency (Escalante et al. 2009). Under these recording conditions, 49 records of directional waves were obtained during the passage of Hurricane Wilma between 00:00 on 19 October and 00:00 on 23 October 2005.
The Acoustic Doppler Current Profiler (ADCP, RD Instruments), located at 20.0 m depth, was another source of wave data (Fig. 1). This instrument has 3 different independent techniques for measuring the spectral distribution of waves derived from the time series of pressure, orbital velocity of particles, and sea surface displacement. Orbital velocities can be measured very close to the surface, where exponential dissipation of wave energy with depth does not reduce the signal, and they can thus be transformed into spectra of sea surface displacement (Bowden and White 1966). The use of orbital velocities to determine the spectrum is a reliable technique (Nagata 1964). Like the AWAC, ADCP can measure directional spectra.
During the recording period the ADCP was programed to obtain sets of 2,048 samples at 2 Hz and 1-h intervals. During the passage of Hurricane Dean, 73 wave records were obtained between 00:00 on 20 August and 00:00 on 23 August 2007. By programming the equipment to obtain sets of 2,048 samples at 2 Hz and 2-h intervals, 61 records of directional waves were obtained during the passage of Hurricane Rina between 00:00 on 24 October and 00:00 on 29 October 2011.
Wind field data and hurricane trajectories were obtained from 2 NOAA sources: (1) the Hurricane Research Division and (2) the National Hurricane center (Pasch et al. 2006; Franklin 2008; NOAA 2008, 2010, 2011; Blake 2012).
It was not always possible to clearly distinguish the simultaneous occurrence of wind sea and swell as 2 well-separated peaks in the wave spectrum. For hurricanes, this distinction is sometimes highly complex because developing wind sea, fully developed wind sea, wind sea transitioning into swell, and fully developed swell can all be found at the same observation site. To separate the wind sea and swell components in the unidimensional spectra, the identification algorithm described by Portilla et al. (2009) was used. The basis for this algorithm is that the energy at the peak frequency of swell cannot be greater than the energy value of the Pierson-Moskowitz spectrum for the same frequency. Therefore, if the ratio between the peak energy of the measured waves and the peak energy of the Pierson-Moskowitz spectrum for the same frequency is >1, then waves are considered wind sea, otherwise they are considered swell. Wave group celerity was calculated using the linear wave theory approach for intermediate or transition waters (Dean and Dalrymple 1991).
Results
Hurricane Wilma (October 2005)
To quantitatively analyze the temporal evolution of the spectra, the energy density associated with the swell and wind sea modes were calculated for each spectral record by applying the wave partitioning criterion mentioned by Portilla et al. (2009) (Fig. 2). In the beginning, within the first 12 h on 19 October, there was no swell, only wind sea with low energy levels. From 12:00 onwards swell energy increased until reaching the same wind-sea energy level at 16:00. Wind sea and swell maintained the same energy level until swell energy surpassed wind-sea energy at 00:00 on 20 October. Swell energy increased and decreased at certain intervals, yet it maintained higher levels than wind sea until 06:00 on 22 October. The absolute maximum energy associated with swell occurred at 18:00 on 21 October. At that time the eye of the hurricane was very close to passing over the wave observation site. On 21 October at 18:00 swell energy started to abruptly decrease in such a way that by 06:00 on 22 October it was lower than the energy level of wind sea, and by 00:00 on 23 October it had completely disappeared. The energy associated with wind sea also increased considerably as the hurricane moved closer to the observation site. Note that the absolute maximum for wind sea coincided in time with maximum swell energy. The energy associated with wind sea then decreased slowly. Towards the end, at 00:00 on 23 October a considerable amount of energy associated with wind sea was still persistent. This happened because the hurricane turned seaward once again (see path in Fig. 1), this time in a NE direction towards the Gulf of Mexico, and local winds at that time continued to be intense, providing favorable conditions for wind sea.

Figure 2 Temporal evolution of energy density associated with swell and wind sea from the spectral records. Circles indicate maximum proximity between swell energy and wind-sea energy.
During the passage of this hurricane the simultaneous occurrence of wind sea and swell at the observation site was recorded, almost throughout the entire duration of the phenomenon. Wind sea and swell showed similar energy levels on 5 occasions as this meteorological phenomenon approached, passed over, and moved away from the observation site (Fig. 2). The result for the analysis of the temporal evolution of the wind-sea and swell energy densities corroborated the presence of bimodality.
The results for the analysis of scalar spectra suggested extending the analysis to include the directional spectra. Together with the surfaces of directional wave spectra, the partial sums of the energy distributions were placed on the bottom surfaces as a function of frequency and direction (Fig. 3). In the beginning, at 00:00 on 19 October (Fig. 3a), only wind sea arriving from the E was present, with very low energy. Twelve hours later (Fig. 3b), swell became present and showed the same energy distribution as wind sea but with a slightly different direction, both coming from the second quadrant with respect to the N. At 00:00 on 20 October (Fig. 3c), swell energy increased considerably and became the dominant mode, with direction almost entirely from the ESE. Twelve hours later (Fig. 3d), conditions were similar but energy had increased. Wind sea grew conjointly with swell at 00:00 on 21 October (Fig. 3e). Two independent modes were identified for the direction of incidence, one corresponding to swell in the second quadrant and the other to wind sea in the first quadrant. Swell continued coming from the ESE, whereas wind sea had an ENE direction. An identical situation was observed during the 12 h that followed but with higher energy (Fig. 3f). The analysis of directional spectra confirmed the existence of the spectral bimodality of waves, as wind sea and swell coming from different directions coexisted simultaneously.
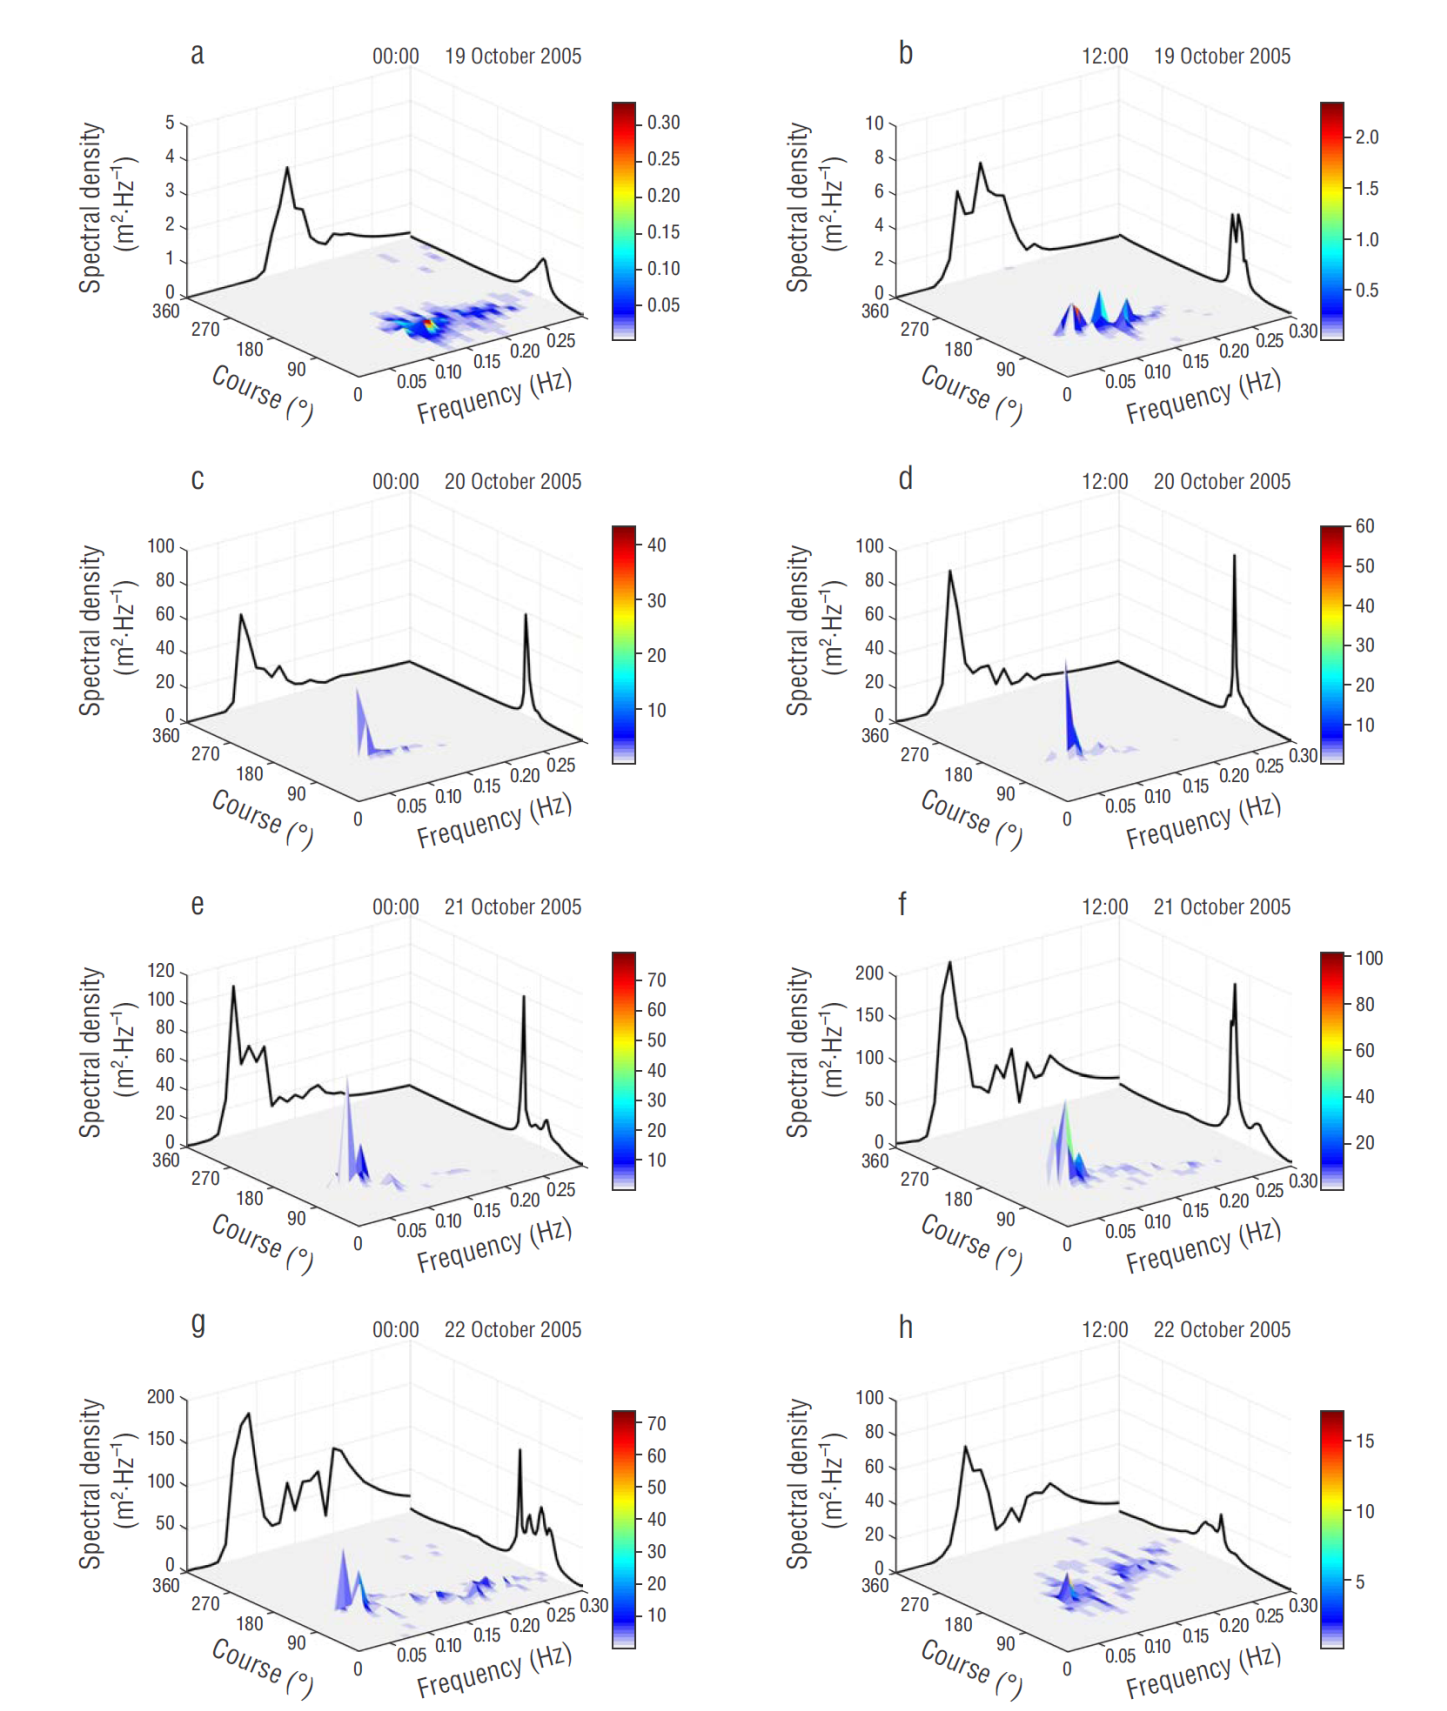
By 00:00 on 22 October (Fig. 3g) swell energy slightly decreased, peak frequency increased, and the direction of maximum energy veered SE. Meanwhile, the growth of 3 modes of wind waves coming from different directions, between ESE and ENE, was observed. Twelve hours later (Fig. 3h) swell energy levels decreased, the peak of maximum energy changing to frequencies of ~0.1 Hz (periods of ~10 s), and the direction of wind sea was between SE and S. At that time the hurricane had already moved away in a NE direction towards the Gulf of Mexico but given the large spatial extension of this system, winds on its southern portion continued to locally affect waters at the observation site and to generate wind sea.
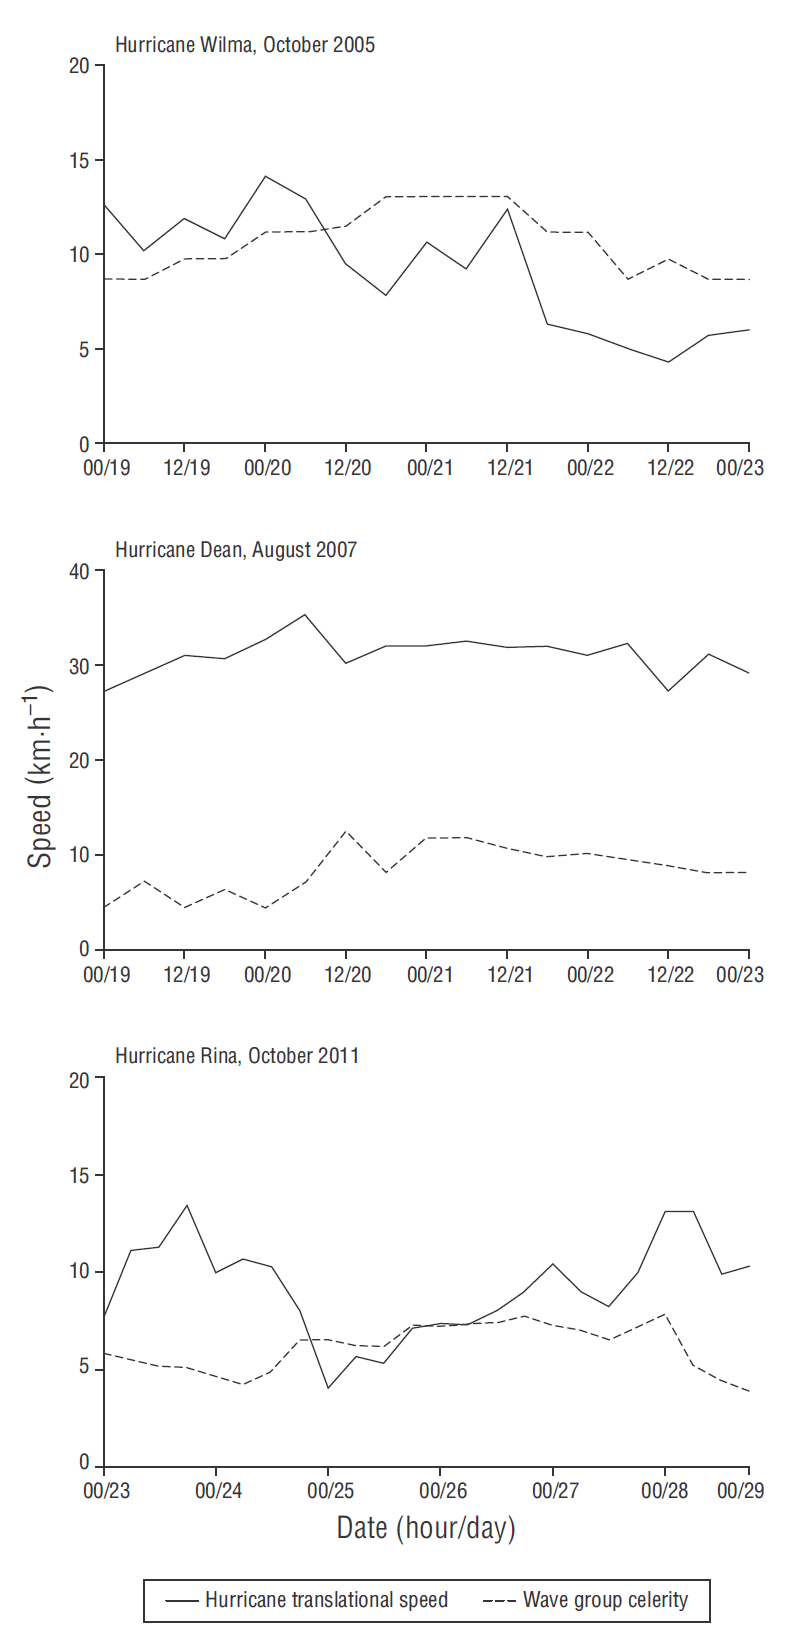
The comparison between the temporal evolution of the translational speed of the eye of the hurricane and the temporal evolution of wave group celerity enabled a description of the possible causes of bimodality in frequency and direction (Fig. 4). Wave group celerity turned out to be similar to the translational speed of the hurricane throughout most of the recording period, thus providing the time needed for wind-sea growth and development.
Hurricane Dean (August 2007)
To quantitatively analyze the temporal evolution of the spectral energy of waves associated with this hurricane, energy density associated with swell and wind sea was calculated for each spectral record, as was done for Hurricane Wilma (Fig. 2). Wind sea dominated the spectrum most of the time; swell exceeded wind sea only between 00:00 and 13:00 on 21 August. It was during this time that the eye of the hurricane was closest to the observation site. Before and after this period swell energy was almost insignificant when compared with energy associated with wind sea.
The analysis of 6 directional spectra corresponding to Hurricane Dean between 20 and 22 August 2007, allowed the detection of spectral bimodality (Fig. 5). On 20 August at 10:00 (Fig. 5a) the presence of wind sea and swell, both from the ESE, was observed with similar and spectrally distinguishable peak heights. Later on at 00:00 on 21 August (Fig. 5b), the peak for swell increased, covering a dominant portion of the spectrum over wind sea, and the prevailing direction was SE. In this record wind sea and swell were still spectrally distinct. By that time the hurricane had reached category 5 in the Saffir-Simpson scale, with maximum sustained winds of 270 km·h-1. At 10:00 on 21 August (Fig. 5c) the eye of the hurricane made landfall and reached maximum proximity to the observation site, with wind sea considerably growing to a point where peak wave height matched swell height. Wave direction was still SE. By then wind sea and swell showed considerable overlap. At 14:00 (Fig. 5d), the distribution of energy was similar in frequency and direction, but there was less energy. At 02:00 on 22 August (Fig. 5e), swell energy began to decay with respect to wind-sea energy, but both continued to overlap and wave direction was still SE. Finally, at 16:00 (Fig. 5f) there was a decrease in swell and the direction of the wind-wave peak changed to the E. Between 10:00 on 20 August (Fig. 5a) and 10:00 on 21 August (Fig. 5c) asymmetry in the directional energy distribution was notable. Even when the dominant peak was in the second quadrant, an important amount of energy from the first quadrant was recorded.

For this hurricane, bimodality was found in the frequency domain but not in direction. The comparison between the translational speed of the hurricane and wave group celerity indicated that the translational speed of hurricane Dean was greater at all times, up to 3 times greater throughout most of the hurricane path (see Fig. 4).
Hurricane Rina (October 2011)
The results for the temporal distributions of energy density for the wind sea and swell records during the passage of Hurricane Rina indicated the existence of bimodal waves (see Fig. 2). For this event the spectral energy density of wind sea surpassed that of swell during the recording time.
Hurricane Rina was short-lived. It formed on 23 October at 21:00 (GMT), and 120 h later, it had completely dissipated. This hurricane traveled a total distance of 1,317.1 km, with maximum translational speed of 13.45 km·h-1. The conditions in the upper atmosphere, which included a strong divergent wind field, and the high temperatures in the Caribbean Sea contributed to the rapid development of this tropical system, to such a degree that the storm had reached category 2 by 09:00 on 25 October .
As was done for the previously analyzed hurricanes, the directional spectra associated with this phenomenon allowed the joint evaluation of the spectral evolution of waves in the frequency and direction domains (Fig. 6). At 8:00 on 24 October (Fig. 6a) waves were unimodal and locally generated, radiating out mainly from the first quadrant in spite of the direction of the peak being E. By 20:00, on the same day (Fig. 6b), waves were already bimodal in frequency but unimodal in direction, with the spectral maximum from the E and almost equally distributed between the first and second quadrants. At 08:00 on 25 October (Fig. 6c), waves continued to be bimodal in frequency and slightly bimodal in direction, but in both cases a high degree of overlap was observed between both modes. Wind sea originated in the first quadrant, with the maximum in the ENE, and swell originated in the second quadrant, with the maximum in the ESE. The day after, on 26 October at 08:00 (Fig. 6d), the peaks for wind sea and swell had similar heights in the frequency domain, and both became separated and more prominent. At that time waves originated mainly in the second quadrant, with the maximum peak in the SE direction. On 27 October at 20:00 (Fig. 6e), during maximum proximity of the eye of the hurricane to the observation site, waves continued to be bimodal in frequency, but the peak height of wind sea considerably surpassed that of swell. The peak of maximum energy in the directional component came from the SE, though a second peak of wind sea coming from the E was also observed. The hurricane dissipated between the late hours of 27 October and the early hours of 28 October, and so did the waves; by 08:00 on 28 October (Fig. 6f) swell had dissipated and only wind sea, mostly from the E, was recorded.

The comparison between wave group celerity and the translational speed of hurricane Rina indicates that the translational speed of the hurricane was greater or similar to wave group celerity during most of the event ( see Fig. 4). This could have favored the dominance of local wind waves over the possible growth of swell.
Discussion
Sensors placed in transition waters from the Caribbean Sea recorded 183 directional wave spectra under the hydrodynamic conditions of 3 different hurricanes. The analysis of these spectra helped determine the intensity of incident energy and its distribution in frequency and direction. The records here indicate simultaneous incidence at the wave observation site and constitute the first reports of this phenomenon for the Caribbean portion.
In contrast with the absence of bimodality in frequency and direction during the passage of hurricanes over the northern coast of Australia (Young 1998, 2006), the scalar spectral analysis for the duration of Hurricane Wilma indicate the predominance of swell and the simultaneous and significant occurrence of wind sea. This could have been caused by the particular way waves were generated during the passage of this intense hurricane. The low translational speed of the hurricane at the observation site allowed wind sea and swell to grow simultaneously and with a significant amount of energy. Due to the large dimensions of hurricane Wilma, gale-force winds blowing from the front left quadrant of the system began to appear at 12:00 on 19 October, when the hurricane center was 582 km from the observation site. This condition, coupled with the low translational speed of this system, stimulated the growth of wind sea at the same time and in the same space that the nonlinear interactions that generated the swell were taking place. This behavior created the conditions for bimodality not only in frequency but also in direction. Contrary to what was described by Walsh et al. (2002) and Young (2006), this directional analysis confirms the existence of bimodal wave spectra, since wind sea and swell from different directions coexisted simultaneously. These results coincide with the bimodality requirements proposed by Perrie and Resio (2009).
For hurricane Dean the scalar spectral analysis showed that, for both wind sea and swell, energy increased when the hurricane was at maximum proximity to the observation site. Wind sea and swell coexisted in the same space during the time the hurricane was at its maximum proximity to the observation site. The required fetch and duration were present for, one, the generation of swell with small spectral amplitudes and, two, the generation of wind sea by gale-force winds associated with the rotation of the air mass around the low-pressure center. As in the case of Hurricane Wilma (Fig. 2), during Hurricane Dean there were 2 moments in which the energy associated with wind sea and swell was very similar, indicating wave spectral bimodality and thus fulfilling the requirements proposed by Perrie and Resio (2009).
The analysis of the directional wave spectra for Hurricane Dean showed that, unlike that observed for Wilma, waves generated by this system were mostly unimodal in direction. This could be due to the fact that Hurricane Dean moved very rapidly in a straight path from the E (in a direction almost perpendicular to the coasts of Mexico), whereas Wilma approached the observation site from the S and in a more erratic way. The high translational speed and linear movement of Hurricane Dean as it approached the observation site could have played a significant role in the generation of unimodal waves, with respect to direction.
Hurricane Rina, on the other hand, formed rapidly and dissipated in just 3 days. These particular conditions significantly influenced wave generation and propagation, and they are reflected in the resulting scalar spectral distributions. Swell developed intermittently and did not consolidate, nor did it dominate the spectrum (see Fig. 2). In contrast with the observations for Wilma and Dean, the ocean-atmosphere interactions associated with the local gale-force winds during the passage of Rina had a prevailing effect on the waves recorded at the observation site. This conditioned the presence of bimodal waves, in the frequency domain, during practically the entire life span of this phenomenon, as was the case for Wilma and Dean, though wind waves always dominated the spectrum. Like Wilma, yet unlike Dean, Rina approached the observation site from a direction near the S. The spectra indicate that even though Rina was mostly unimodal in direction, slight directional bimodality was observed at certain times; thus, this phenomenon occupied an intermediate position between hurricanes Wilma and Dean.
Most observations for the 3 events were done from a distance less than 8 times the radius of maximum winds of the events. In addition, bimodality was observed in the 2 front left quadrants of the hurricane center. The above statements fulfill the requirements proposed by Hu and Chen (2011) for the possible occurrence of bimodality.
The 3 events showed different characteristics with respect to their genesis and evolution. Another element to consider, as evidenced throughout the discussion, is the relation between the translational speed of the phenomenon (VT) and the wave group celerity (Cg) produced during its passage. This calls for the creation of a nondimensional V index, the ratio between the 2 velocities:
For the 3 events, the possible influence of the V index on the presence or absence of bimodality, in frequency or direction, turned out interesting. This index indicates that for values close to 1, there are favorable conditions for bimodality to occur both in frequency and in direction. For values in the range of 1.0-2.5 bimodality could temporarily occur in frequency and in direction. However, for index values >2.5 bimodality could only occur in frequency (Fig. 7).

Few events were evidently analyzed for a criterion or quantitative index to be definitive. The findings presented here are the result of the analysis of the spectral characteristics of 3 significant events. Nevertheless, the obtained results constitute a stepping stone for future research on the role of nonlinear interactions between wave components and their relation to the approaching direction and translational speed of the system. The main limitation for these future investigations is still, as suggested by Kennedy et al. (2010) , the lack of wave measurements in shallow and transition waters during intense hurricane conditions.

