


Services on Demand
Journal
Article
 English (pdf)
 Article in xml format
 Article references
 Send this article by e-mail
Indicators
-
 Cited by SciELO
 -
 Access statistics
Related links
-
 Similars in
SciELO
Similars in
SciELO
Share

 Permalink
Ciencias marinas
Print version ISSN 0185-3880
Cienc. mar vol.30 n.2 Ensenada Jun. 2004
Artículos
Sensitivity analysis of the multispecies virtual population analysis model parameterized for a system of trophically-linked species from the eastern Bering Sea
Análisis de sensibilidad del modelo de análisis poblacional virtual multiespecífico aplicado a un sistema de especies relacionadas tróficamente del Mar de Bering Oriental
Jesús Jurado-Molina1*, Patricia Livingston2 and Vincent F. Galluci1
1 School of Aquatic and Fishery Sciences University of Washington, Box 355020 Seattle, WA 98195, USA. *E-mail: jjurado@u.washington.edu
2 National Marine Fisheries Service Alaska Fisheries Science Center 7600 Sand Point Way NE Seattle, WA 98115, USA.
Recibido en diciembre de 2002;
aceptado en noviembre de 2003.
Abstract
A sensitivity analysis of a multispecies virtual population analysis (MSVPA) model parameterized for the Bering Sea was carried out using two methods for the analysis. In the first method, four variables related to the predation mortality M2 and population size of age-1 walleye pollock (Theragra chalcogramma) and Pacific cod (Gadus macrocephalus) were chosen as response variables. Results suggested that the response variables of walleye pollock were sensitive to the residual mortality M1 of walleye pollock, the stock size of arrowtooth flounder (Atheresthes stomias) and ration of both predator species. Pacific cod response variables were sensitive only to variables related to Pacific cod. These results reinforce the importance of cannibalism in the dynamics of walleye pollock and Pacific cod. Results from the individual perturbation parameter analysis showed that the changes produced by large positive perturbations in the "other food" parameter were small. The overall results suggest that the MSVPA model can be considered robust. These results help to recognize the potential use of MSVPA as a tool to assist in broadening the management of the fishery resources from the Bering Sea within a multispecies perspective.
Key words: sensitivity analysis, MSVPA, predation mortality, walleye pollock, Bering Sea.
Resumen
Se llevó a cabo un análisis de sensibilidad para el modelo de análisis de población virtual multiespecifico (MSVPA, por sus siglas en inglés) aplicado al Mar de Bering con dos métodos distintos. Con el primer método, se consideraron variables de respuesta a cuatro variables relacionadas con la mortalidad por depredación M2 y el tamaño de la población de un año de edad de abadejo de Alaska (Theragra chalcogramma) y bacalao del Pacífico (Gadus macrocephalus). Los resultados sugirieron que las variables de respuesta del abadejo de Alaska fueron sensibles a la mortalidad residual M1 del propio abadejo, a la magnitud del stock de Atheresthes stomias y a la ración de ambas especies. Las variables de respuesta del bacalao del Pacífico fueron sensibles únicamente a variables relacionadas con la misma especie. Estos resultados refuerzan la importancia del canibalismo en la dinámica tanto del abadejo de Alaska como del bacalao del Pacífico. Los resultados del análisis de perturbación mostraron que los cambios causados por las perturbaciones positivas grandes en el parámetro "otras presas" ("other food" en inglés) fueron pequeños. Los resultados de ambos análisis de sensibilidad sugieren que el modelo MSVPA puede ser considerado robusto. Este resultado ayuda a reconocer el uso potencial del modelo MSVPA como una herramienta útil para incluir el manejo de los recursos pesqueros del Mar de Bering dentro de una perspectiva multiespecífica.
Palabras clave: análisis de sensibilidad, MSVPA, mortalidad por depredación, abadejo de Alaska, Mar de Bering.
Introduction
Fisheries management has been based on single-species models; however, there is an increasing tendency to recognize that the dynamics of a fishery could be determined by external factors such as the environment and interactions with other species. Thus, a broader approach to management that provides information about the potential consequences of fishing on the ecosystem is necessary. In particular, multispecies models are useful to measure the indirect effects related to changes in the flow of energy through the ecosystem (Hollowed et al., 2000). Several multispecies models have been developed in the last two decades with different emphasis, including biological, technological or economical interactions. Numerous models have incorporated trophic interactions. In particular, in the North Pacific, Livingston and Methot (1998) incorporated the effect of predation by three species into an age-structured model for walleye pollock (Theragra chalcogramma) in the Bering Sea. This methodology made possible the estimation of predation mortality of walleye pollock and suggested that cannibalism may be an important factor in determining recruitment into fishery. Hollowed et al. (2000) included the effect of predation by the arrowtooth flounder (Atheresthes stomias), Pacific halibut (Hippoglossus stenolepis) and Steller sea lion (Eumetopias jubatus) in a separable catch-at-age stock assessment model for walleye pollock in the Gulf of Alaska. Predation by these predators was defined as an additional type of fishery. The approach taken in these two models did not consider the feedback between predators and prey, which may be important. Two models that consider this type of feedback have also been developed for the eastern Bering Sea (Livingston and Jurado-Molina, 2000; Aydin et al., 2002).
A multispecies virtual population analysis (MSVPA) model and a multispecies forecast (MSFOR) model were developed for the eastern Bering Sea (Livingston and Jurado-Molina, 2000; Jurado-Molina and Livingston, 2002a). These models were developed by the Multispecies Working Group of the International Council for the Exploration of the Seas (ICES) based on the assumption of multispecies interactions and predator-prey preferences proposed by Anderson and Ursin (1977). MSVPA is an extension of the virtual population analysis (VPA) model (Gulland, 1965) that estimates population parameters and predation mortality based on catch-at-age, predator ration and predator diet information. A more detailed description of the equations and the assumptions from MSVPA can be found in Sparre (1991) and Magnusson (1995).
The MSFOR is the predictive counterpart of the MSVPA and uses the exponential equation to forecast the population dynamics:

where F represents the fishing mortality, M1 the residual mortality (due to ageing, starvation, etc.) and M2 the predation mortality. This last parameter is estimated with the following equation:
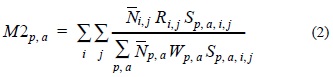
where  i,j represents the average stock size of the predator i of age j. Ri,j is the annual ration of the predator and Sp,a,i,j is the suitability coefficient for each predator-prey combination. These parameters reflect the diet composition of the predators relative to the food available (Sparre, 1991). The denominator represents the total suitable biomass available to the predator. In the denominator, p,a represents the average stock size of prey p at age a and Wp, a represents its weight at age. Recruitment of age-0 individuals in the model is assumed log-normal distributed. Some outputs of the MSVPA are inputs to the MSFOR, such as the suitability coefficients, initial population estimates and recruitment parameter estimates, therefore MSFOR requires a previous run of the MSVPA. MSFOR has been used in the consideration of some issues in fisheries management in the eastern Bering Sea (Jurado-Molina and Livingston, 2002a, b).
Due to the tendency of complex models to magnify input errors, it is necessary to carry out a sensitivity analysis focusing on those parameters with suspected uncertainty. Sensitivity analysis is a convenient methodology for model validation and the identification of parameters requiring further refinement. It also provides information on those components of the model important in determining the behavior of the response variables and the overall robustness of the model. Those input parameters are not expected to have a large impact on the output of the model. In particular, recruitment, suitabilities, stock size, fishing mortality and predation mortality are the outputs of concern in the MSVPA (Anonymous, 1991) and MSFOR.
Methods
We used the system defined in a previous work by Livingston and Jurado-Molina (2000). The species included in the MSVPA were walleye pollock (Theragra chalcogramma), Pacific cod (Gadus macrocephalus), Greenland turbot (Reinhardtius hippoglossoides), yellowfin sole (Pleuronectes asper), rock sole (Lepidopsetta bilineata) and Pacific herring (Clupea pallassi). The arrowtooth flounder (Atheresthes stomias) and northern fur seal (Callorhinus ursinus) were considered external predators because their stock sizes are provided externally from other sources (Sparre, 1991).
We took two different approaches to test the sensitivity of the model. The first analysis included a fractional factorial design for 16 variables with two levels of perturbation (±10%), as seen in table 1. The second method was the individual parameter perturbation for the "other food" parameter.
The number of runs required by a full 2k factorial design (k predictor variables) increases geometrically. However, in a full factorial design there tends to be redundancy in terms of an excess number of the interactions that can be estimated and sometimes in an excess number of variables that are studied. Fractional factorial design exploits that redundancy to reduce the number of runs in the analysis (Box et al., 1978).
The MSVPA model has potentially hundreds of response variables to analyze. However, only four response variables were chosen: average population for age-1 individuals and average M2 of age-1 individuals of two species, walleye pollock and Pacific cod. These response variables were selected due to the importance of walleye pollock as dominant species in the Bering Sea in terms of annual catch and total groundfish biomass (Bakkala, 1993). These species also play an important role as predator-prey in the eastern Bering Sea (Livingston, 1993). Several input parameters could have been used as predictor variables in the sensitivity analysis. However, some were chosen for the analysis due to their importance in the predation interactions and the dynamics of the species selected. The predictor variables were: annual ration of the predator, residual natural mortality M1, terminal fishing mortality Fterm of each species and stock size of the "other predators". Sixteen input parameters were selected as predictor variables (table 1). These predictor variables were assigned randomly to a set of auxiliary variables Xi to avoid pseudo-replication due to lack of randomness (table 1).
Due to the difficulty of carrying out a complete factorial design, which includes all possible combinations of all predictor variables, a fractional factorial design of resolution IV was developed by "folding over" a resolution III design (table 1). To complete the design of resolution IV, we folded over the resolution III design in such a way that the remaining 16 runs were obtained by switching the signs in the first set of 16 runs shown in table 1. This design was used twice, once for positive perturbations and another for negative perturbations for a total of 64 deterministic runs of the MSFOR model. A simple way to analyze the sensitivity of the model is the coefficient of variation (σ2/µ) of the response variable. This statistic indicates the overall sensitivity of the response variables to the complete set of perturbations implemented in the experimental design (Finn et al., 1986). The results from the sensitivity analysis were analyzed using response surfaces that included only the main effects (equation 3).

where y represents the response variable, xi the predictor variables, β0 the intercept and βi the slope. It is assumed that the error e is normally distributed. The slopes are the absolute sensitivity coefficient measuring the absolute change due to a unit change in the predictor variable. A simpler interpretation of the effects produced by perturbations is achieved with the relative sensitivity coefficients defined with the following equation:

where Δxi represents the 10% perturbation in the parameter and Pi the slope of the predictor variable. These coefficients measure the effects on the response variable produced by a 10% perturbation in each predictor variable. Following the methodology from the ICES Multispecies Group (Anonymous, 1991), a response variable was considered not sensitive to a 10% perturbation if the effect produced was smaller than 3%.
The second method used to test the sensitivity of the MSVPA was an individual perturbation parameter (IPP) analysis for the "other food" parameter. This parameter accounts for the food observed in the predator's stomach, which does not originate from MSVPA prey species. We tested only the assumption that is currently used in the assessments of the ICES Multispecies Group, which considers the "other food" parameter constant over time (Sparre, 1991). Based on predator consumption and estimates of total population of prey species, we estimated a value of 66,300,000 tons for this parameter.
In the IPP analysis, the following perturbations were used: ±75%, ±50%, ±10%, 20%, 100%, 200% and 300%. Negative perturbations, smaller than -75%, were not used because the "other food" parameter and the total biomass become negative. The relative percent change (equation 5) of the average M2 of age-1 fish, and the average population size of age-1 fish of all species were selected as response variables. We denoted the response variables with no perturbation as N0 and M20.
Relative percent

change in predation mortality
Results
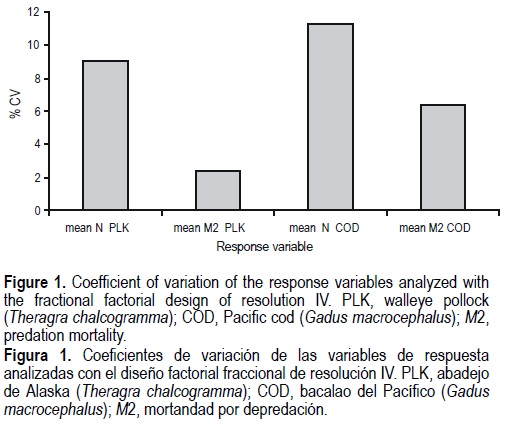
In general, the coefficients of variation of the response variables were small (fig. 1). The highest value corresponded to the average population of age-1 Pacific cod (11.22%) and the lowest to the average predation mortality of age-1 walleye pollock (2.37%).
All the response surfaces explained more than 90% of the variability observed. The response surface of all response variables had several significant slopes (absolute sensitivity coefficient) as shown for the average population size of age-1 walleye pollock in table 2. However, in general, the relative sensitivity coefficients suggest that the response variables in the MSVPA were not sensitive to most of the predictor variables (effects < 3%). Only one effect was greater than 10% (table 3). The average population of age-1 walleye pollock was sensitive to walleye pollock M1. A 10% perturbation in M1 produced a 6.4% increase in that response variable (table 3). The same variable was slightly sensitive to the ration of arrow-tooth flounder (3.8%), the stock size of arrowtooth flounder (3.7%) and the Fterm of walleye pollock (-3.6%). The average M2 of age-1 walleye pollock was only sensitive to its M1 (table 3). The average population of age-1 Pacific cod was sensitive to its own M1 and Fterm. The largest effect (15.3%) found in the analysis corresponded to M1 of Pacific cod (table 3). Finally, the average M2 of Pacific cod was not sensitive to most of the predictor variables with the exception of its M1 and its ration (table 3).

The results from the IPP analysis for the "other food" corresponding to the average population of age-1 walleye pollock, are shown in figure 2. All perturbations produced values of the response variable in the same order of magnitude as the base run value N0 (fig. 2a). The average population size of age-1 walleye pollock decreased when the magnitude of the perturbation was increased with the asymptotic relationship in the extremes (fig. 2a). Therefore, large negative perturbations produced more pronounced changes than those produced by positive perturbations (fig. 2a, b). Similarly, the smallest relative percent change of the response variable (fig. 2b) corresponded to higher positive perturbations ranging from -6.72% (-75% perturbation) to 4.51% (300% perturbation).

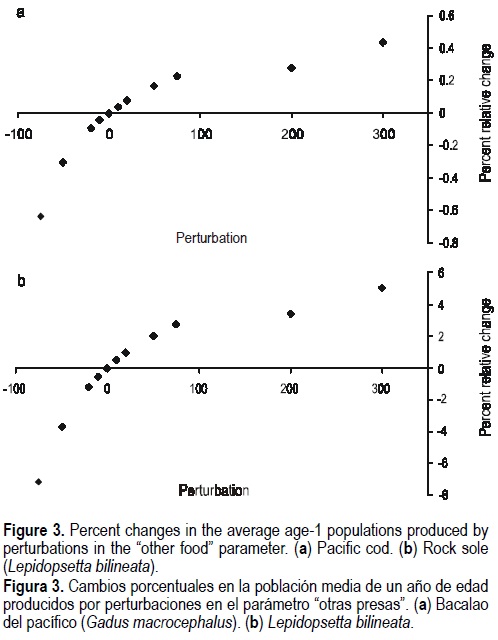
The response variable of the rest of the species showed similar trends. However, the magnitude of the changes was different for some cases. The smallest relative percent changes in the response variables corresponded to Pacific cod (fig. 3a). Relative percent changes for Greenland turbot and rock sole were smaller than 10% (fig. 3b). For yellowfin sole, the perturbations produced relative percent changes smaller than 3%. For the Pacific herring the relative percent changes were also smaller.
In general, the relative percent changes in the predation mortality of age-1 fish were larger than those found for the average population of age-1 fish. Again the response variables decreased when perturbations were increased and the relative percent change decreased when the perturbations increased. For walleye pollock, the relative changes were small, ranging from -3.3% (for a -75% perturbation) to 2% (for a 300% perturbation). Pacific cod again presented the smallest relative percent changes in absolute value (<0.7%). For the Greenland turbot, the relative percent changes ranged from -46% to 8.8%. For the rock sole and Pacific herring, the relative percent changes were smaller than 15% for positive perturbations.
Discussion
The sensitivity analysis and response surface methods are useful to determine how the response variables are affected by perturbations on a set of parameters over specific regions of interest (Box et al., 1978; Schnute and McKinnell, 1984). They allow the identification of the relative importance of the changes produced, and provide feedback for the potential improvement of the model, identifying those parameters with potential problems. The response variables were chosen based on the importance of the walleye pollock and Pacific cod in the food web from the Bering Sea. Those response variables are also important for the population dynamics of walleye pollock, the dominant species in the Bering Sea.
Several approaches were taken to explore the sensitivity of the MSVPA model. A direct exploration of the coefficient of variation of the response variables indicated that their overall sensitivity is low. In the response surface we did not include two-way interactions in the model because the main effects explained most of the variability observed (more than 90% in all cases). Although some predictor variables had significant absolute sensitivity coefficients, the corresponding relative sensitivity coefficients showed that the response variable was not sensitive to that particular predictor variable. The relative sensitivity coefficients provide a clearer image of the effects produced by perturbations than the absolute sensitivity coefficients.
When the relative sensitivity coefficients were analyzed, we found that the response variables were not sensitive to most of the predictor variables of the predators. However, the response variables associated with walleye pollock were sensitive to some predictor variables from walleye pollock and arrowtooth flounder. The sensitivity of the response variables from the MSVPA model to some parameters can be partially explained by the trophic interactions observed in the population dynamics of the walleye pollock and Pacific cod. Some results suggested that the average population of age-1 walleye pollock was sensitive to the ration of arrowtooth flounder. This result agrees with a previous work where the ration of arrow-tooth flounder was important in determining the predation mortality and average population of age-1 walleye pollock as shown by the large estimates of biomass consumption of walleye pollock by arrowtooth flounder (Livingston and Jurado-Molina, 2000). Earlier trophic analyses did not include the consumption of age-1 walleye pollock by arrowtooth flounder in the estimation of the predation mortality of age-1 walleye pollock (Livingston, 1993; Livingston and Methot, 1998). However, the present and previous results (Livingston and Jurado-Molina, 2000) suggest that arrowtooth flounder should be included as one of the main predators of age-1 pollock. It is important to mention that the annual ration of arrowtooth flounder is determined based on estimates of growth increments and growth conversion efficiency; therefore, there is less concern regarding the uncertainty of this parameter. Other predators consuming important amounts of age-1 walleye pollock were the northern fur seal and Pacific cod (Livingston and Jurado-Molina, 2000). However, the response variables of walleye pollock were not particularly sensitive to the parameters of these predators. At this point, it is not easy to explain this discrepancy. The average population of age-1 walleye pollock was also sensitive to the stock size of arrowtooth flounder because this parameter is important in the estimation process of the predation mortality and therefore in the prey stock size (equation 2). Regarding the uncertainty of the estimates of population of arrowtooth flounder, we used those obtained from the single species groundfish stock assessment that could be considered the best estimate available (NPFMC, 1999).
The average population of age-1 walleye pollock was also sensitive to the Feerm of walleye pollock. This parameter is important in the determination of the estimations of stock size in the MSVPA; however, there is uncertainty regarding this parameter, and to assess it, it is necessary to use an estimation approach using a likelihood profile or Bayesian analysis, both technologies not available in a multispecies context. Both walleye pollock response variables were sensitive to its own M1. This parameter plays a role similar to the one played by the natural mortality M in single-species models that are sensible to this parameter because it influences the stock size estimations. Therefore, the problems associated with M in the single-species models are also found for M1 in the MSVPA, among them, the uncertainty of its value and its indirect influence in the estimation of the predation mortality (equation 2). The results concerning walleye pollock suggest the importance of cannibalism in the dynamics of this species, and also that, in a multispecies context, the actions taken on arrowtooth flounder could have some effects on the dynamics of the walleye pollock. Therefore, it is important to take into account these two components when the walleye pollock fishery is managed.
Results for Pacific cod indicated that the response variables were sensitive to variables mostly related to itself, suggesting the importance of cannibalism in the population dynamics of this species. However, they were also sensitive to the annual ration of walleye pollock implying that predation by walleye pollock is also an important factor.
The results from the IPP analysis suggested that the changes in the average stock size and average predation mortality of individuals of each species originated by large perturbations in the "other food" parameter were small. In some cases, even the largest perturbations produced changes smaller than 1%. It is important to point out that large values of "other food" are more likely than small values because in the estimation of this parameter we did not include all potential prey. Therefore, the small changes recorded for large positive perturbations suggest the robustness of the MSVPA model to changes in the "other food" parameter.
Results from this work indicate the importance of cannibalism and predation in the population dynamics of the walleye pollock and Pacific cod. They also suggest that the MSVPA model can be considered robust and agree with results from previous analysis (Anonymous, 1986; Finn et al., 1986; Anonymous, 1991) of the MSVPA and MSFOR models parameterized for the North Sea. These results are an important step in the validation of the MSVPA and MSFOR models, and helped in the identification of the parameters requiring further refinement, including the improvement of estimates of annual ration of predators and residual mortality. The uncertainty of the residual mortality can be addressed using statistical methdods (maximum likelihood and Bayesian methods), so it is necessary to develop multispecies models within this framework.
This model validation is necessary to incorporate multispecies models in ecosystem-based fishery management that will help to improve the sustainability of fishery resources in the eastern Bering Sea. However, it is necessary to further research and develop statistical multispecies models able to assess the uncertainty of parameters producing the largest effects in the MSVPA model.
Acknowledgements
This publication was partially funded by the Joint Institute for the Study of the Atmosphere and Ocean (JISAO), under the National Oceanic and Atmospheric Administration cooperative agreement number NA67RJ01555, contribution 855. We thank the staff of the Alaska Fisheries Science Center Stomach Lab for their work in the analysis of an immense amount of stomachs that provided the data for this research.
References
Anderson, K.P. and Ursin, E. (1977). A multispecies extension to the Beverton and Holt theory of fishing; with accounts of phosphorus, circulation and primary production. Meddr Danm. Fisk.-og Havunders. N.S., 7: 319-435. [ Links ]
Anon. (1986). Report of Multispecies Assessment Working Group. Copenhagen, 7-16 June 1989. ICES CM 1985/Assess: 9. [ Links ]
Anon. (1991). Report of Multispecies Assessment Working Group. Copenhagen, 7-16 June 1989. ICES CM 1991/Assess: 7. [ Links ]
Aydin, K.Y., Lapko, V.V., Radchenko, V.I. and Livingston, P.A. (2002). A comparison of the eastern and western Bering Sea shelf/ slope ecosystems through the use of mass-balance food web models. US Dept. Commer., NOAA Tech. Memo. NMFS-AFSC-130, 78 pp. [ Links ]
Bakkala, R.G. (1993). Structure and historical changes in the groundfish complex of the eastern Bering Sea. NOAA Tech. Rep. NMFS 114. [ Links ]
Box, G.E.P., Hunter, W.G. and Hunter, J.S. (1978). Statistics for Experimenters: An Introduction to Design, Data Analysis and Model Building. John Wiley, New York. [ Links ]
Finn, J.T., Murawski, S.A. and Idoine, J.S. (1986). Response surface sensitivity of the North Sea Multispecies Virtual Population Analysis (MSVPA). ICES. Working documents M9, ad hoc Multispecies Assessment Group. Nov. ICES Copenhagen, Denmark. [ Links ]
Gulland, J.A. (1965). Estimation of mortality rates. Annex to Arctic Fisheries Workshop Group Report. Int. Counc. Explor. Sea CM 1965, Doc. 3, Mimeo. Copenhagen. [ Links ]
Hollowed, A.B., Bax, N., Beamish, R., Collie, J., Fogarty, M., Livingston, P., Pope, J. and Rice, J.C. (2000). Are multispecies models an improvement on single-species models for measuring fishing impacts on marine ecosystems? ICES J. Mar. Sci., 57: 707-719. [ Links ]
Jurado-Molina, J. and Livingston, P.A. (2002a). Mulispecies perspectives on the Bering Sea groundfish fisheries management regime. N. Am. J. Fish. Manage., 22: 1164-1175. [ Links ]
Livingston, P.A. and Jurado-Molina, J. (2000). A multispecies virtual population analysis for the eastern Bering Sea. ICES J. Mar. Sci., 57: 294-299. [ Links ]
Magnusson, K. (1995). An overview of the multispecies VPA - theory and applications. Rev. Fish Biol. Fish., 5: 195-212. [ Links ]
NPFMC (1999). Stock assessment and fishery evaluation report for the groundfish resources of the Bering Sea/Aleutian Islands regions. North Pacific Fishery Management Council, 605 West 4th Ave., Suite 306, Anchorage, AK 99501. [ Links ]
Schnute, J. and McKinnell, S. (1984). A biologically meaningful approach to response surface analysis. Can. J. Fish. Aquat. Sci., 41: 936-953. [ Links ]
Sparre, P. (1991). Introduction to multispecies virtual population analysis. ICES Mar. Sci. Symp., 193: 12-21 G46. [ Links ]

