


 text new page (beta)
 English (pdf)
 Article in xml format
 Article references
 Send this article by e-mail
 Cited by SciELO
  Similars in
SciELO
Similars in
SciELO 
 Permalink
Introduction
Recent years have seen an increase in the prevalence of overweight and obesity. According to the World Health Organization (WHO), since 1975, the prevalence of obesity has tripled worldwide and, in 2016, 39% of adults aged 18 and over were overweight, and 13% obese (World Health Organization [WHO], 2020b). This malnutrition problem is serious, since, according to the WHO, it is a significant risk factor for the development of non-communicable diseases, such as diabetes and cardiovascular problems (WHO, 2020b). In addition, reports and studies suggest that obesity could contribute to the onset of mental health diseases, such as depression or the presence of depressive symptoms (DS; Hryhorczuk, Sharma, & Fulton, 2013; Jantaratnotai, Mosikanon, Lee, & McIntyre, 2017).
According to the WHO, in 2018, depression affected approximately 300 million people and is the main cause of disability (WHO, 2020a). Possible causes of this mood disorder include genetic factors, psychological stress, alteration of the concentration of neurotransmitters involved in mood, and excess inflammation in the body (Hasler, 2010). The latter could be one of the reasons why excess weight and body fat could lead to the development of depressive disorder, since adipose tissue is known to perform an endocrine function (Galic, Oakhill, & Steinberg, 2010) as well as producing proinflammatory substances (Shoelson, Herrero, & Naaz, 2007).
In recent years, Peru has seen an increase in the prevalence of overweight and obesity. According to the report on Communicable and Non-Communicable Diseases published by the National Institute of Statistics and Informatics (INEI), from 2014 to 2017, the prevalence of overweight rose nationwide from 36.1% to 36.9%, while the prevalence of obesity fluctuated between 18.5% and 21.0% in people aged 15 and over (Insituto Nacional de Estadística e Informática, 2018). As for depression, there are only a few studies on its prevalence at the national level, and those that do exist were conducted years ago. For example, in 2012, the Epidemiological Study of Mental Health conducted in Lima and Callao and prepared by the National Institute of Mental Health of Peru reported that 6.2% of the adult population suffered annually from depressive disorders (Instituto Nacional de Salud Mental, 2013). In addition, two other earlier studies conducted in the rainforest and rural highlands region indicate a prevalence of grief, sadness or depression of 4.2% (Instituto Nacional de Salud Mental, 2012) and 3.4% (Instituto Nacional de Salud Mental, 2009), respectively.
According to a meta-analysis conducted on adult population in 2020, there is an association between high BMI and atypical depression (Silva, Coutinho, Ferriani, & Viana, 2020). However, the directionality and its intersection with other associated factors have been called into question. For example, some authors mention that this association increases with age (Emery, Finkel, Gatz, & Dahl Aslan, 2019) while others maintain that there is a lower frequency of depressive symptoms associated with obesity (Liao et al., 2020). For this reason, given the increase in the prevalence of overweight and obesity in the Peruvian population, and the association between this nutritional problem and depression, the following study was conducted to evaluate the relationship between nutritional status and DS using the National Demographic and Family Health Survey (ENDES).
Method
Design of the study
A secondary data analysis was performed on the National Demographic and Family Health Survey (ENDES), conducted in Peru in 2015 (Insituto Nacional de Estadística e Informática, 2016). The survey corresponds to a cross-sectional, analytical, stratified, independent and self-weighted study, with two-stage sampling by conglomerate, designed to obtain information on demographic changes and maternal and child health.
Among the inclusion and exclusion criteria, the same inclusion criteria as those of the ENDES-2015 were considered, such as records of habitual residents and those who, despite not being residents, had slept in the dwelling the night before the day of the interview; records of men and women over 18 but under 60 years of age who answered the health questionnaire and as an exclusion; records of participants with body mass index (BMI) values of less than 18.50 or greater than 100; and, finally, records with missing data for our variables of interest were eliminated.
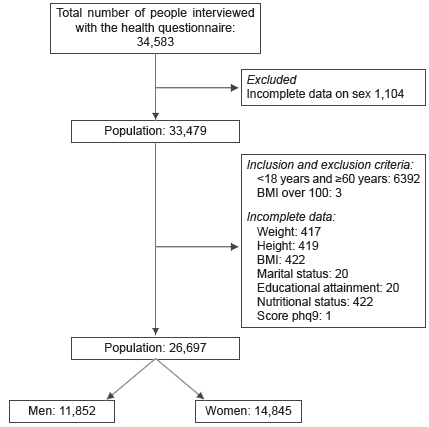
The ENDES sample comprises 35,900 dwellings and surveyed 34,583 people in the health questionnaire. For this study, data on people who had recorded the sex variable (n = 33,479) were used. Next, data from people who failed to meet our inclusion criteria (n = 6,392) were excluded, and those with incomplete information on our variables of interest and covariates were discarded. Then, people with a BMI over 100 (n = 3) and under 18.50 (n = 234) were excluded. Lastly, a final sample of 26,463 subjects was obtained, 11,766 of which were men and 14,697 women (Figure 1).
Calculation of statistical power
A total of 26,463 records of adults met our eligibility criteria. According to previous studies, subjects with adequate or normal weight (n = 10,319) have a 6.8% prevalence of depression, while subjects with excess weight (n = 16,144) have a prevalence of 5.9%, obtaining a power of over 80% for our analysis.
Variable definition
Result variable
The presence or absence of depressive symptoms was defined by the data obtained from the Mental Health questions that formed part of the ENDES health questionnaire. These questions are based on the PHQ-9 questionnaire (Patient Health Questionnaire; Kroenke, Spitzer, & Williams, 2001), comprising nine questions that assess the presence of depressive symptoms in a person during the past fortnight. Each of these questions has four options: never, some days, more than half the days, and nearly every day, which receive a score ranging from 0 to 3. Depending on which answers are marked, it is possible to classify a depressive disorder and determine its degree of severity according to the total score obtained, which varies from 0 to 27. This questionnaire has been validated in Spanish in Chile (Baader et al., 2012). In our study, to classify the participants with the presence of depressive symptoms, the severity criteria of Kroenke et al. (2001): “none” (<5 points), “mild” (5-9 “moderate” (10-14 “moderately severe” (15-19 and “severe” (20-27 points) were used. answers subsequently dichotomized into “with depressive symptoms” “without based on a score greater than or equal to 10 points, because this indicates that person is already considered have symptoms should receive medical treatment counseling (Kroenke & Spitzer, 2002).
Variable exposure
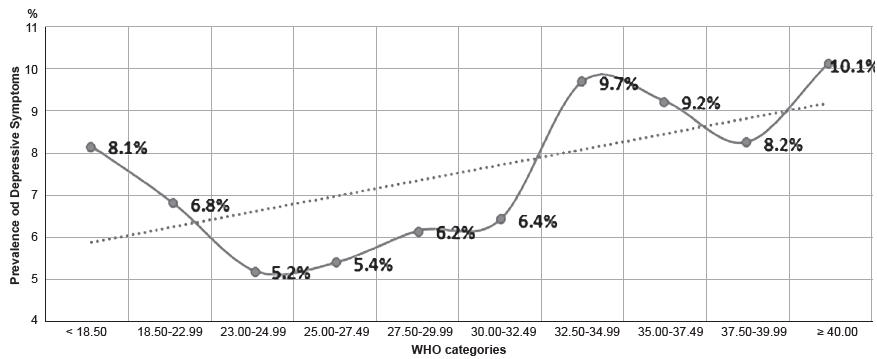
Nutritional status was defined through the body mass index (BMI), calculated by dividing the weight (kg) by the squared height (m) of subjects and categorized in three ways: 1. following the cut-off points recommended by the WHO (normal weight, overweight, and obesity; WHO, 2020c); 2. following other cut-off points suggested by the WHO (WHO, 2020c; WHO Expert Consultation, 2004): 18.50-22.99 (low normal weight); 23.00-24.99 (high normal weight); 25.00-27.49 (low overweight); 27.50-29.99 (high overweight); 30.00-32.49 (low obesity 1); 32.50-34.99 (high obesity 1); 35.00-37.49 (low obesity 2); 37.50-39.99 (high obesity 2); ≥ 40 (obesity 3). 3. As a variable with four categories: Normal or adequate weight: BMI from 18.50 to 24.99, overweight: BMI from 25.00 to 29.99, 1A obesity: BMI from 30.00 to 32.49 and 1B obesity: BMI ≥ 32.50. This last classification was established considering the distribution of the prevalence of depressive symptoms throughout each range proposed in the second way of classifying our variable (Figure 2) and was used in the proposed regression model. Finally, subjects with low weight were excluded from the final analysis (Figure 1), due to the small number of subjects in that category and because our objective was to evaluate the association between malnutrition due to excess and the presence of DS. The names assigned to the ranges in the second and third ways of classifying BMI were used at the discretion of the researchers, taking the names proposed by the WHO as a reference.
Other variables of interest
The following covariates of interest were also included as potential confounding variables: age in years (quantitative), sex (male or female), natural region (metropolitan Lima, rest of the coast, mountains, and rainforest), socioeconomic level (wealth quintiles), area of residence (urban or rural), educational attainment (no education/initial, primary, secondary, higher) and marital status, dichotomized into “unpartnered” (single, widowed, divorced, or not living together) and “partnered” (married or living together).
Procedure
As reported in ENDES, data were collected through the direct interview method, used by trained personnel to collect all the information. Data were drawn from the health questionnaire, conducted on people aged 15 and over in each household. The mental health data and anthropometric measurements were extracted from the latter, while details of the measurement of the variables are reported in the technical file (Instituto Nacional de Estadística e Informática, 2018). Likewise, it should be noted that to ensure data quality, field operation supervision was conducted, maintaining a constant relationship between the supervisor, interviewer, and anthropometrist, using various evaluation formats to obtain quality indicators.
Statistical analysis
Data were processed using Stata 15 (Stata Corp. College Station, Houston TX). Quantitative variables were analyzed in means and standard deviation, and categorical variables in absolute and relative frequencies. For the bivariate and multivariate analysis, an analysis stratified by sex was considered, since for theoretical reasons, depression behaves differently between men and women (de Wit, Luppino, van Straten, Penninx, Zitman, & Cuijpers, 2010; McIntyre, Konarski, Wilkins, Soczynska, & Kennedy, 2006), meaning that it is an effect modifier variable. However, both analyses were only performed with BMI classification into four categories, as defined in the previous section, with the Normal Weight category being the reference or control group. In the case of categorical variables, the Pearson Chi-square test was used, while the Student’s t-test was employed to compare means, after verifying the normal distribution using the Shapiro-Wilk test. Crude (cPR) and adjusted (aPR) prevalence ratios were estimated using generalized linear models (GLM), with Poisson family and log link function. All analyses were adjusted for the sampling design (svy) and a confidence level of 5% with a p value <.05 was considered significant.
Results
A total of 26,463 records were analyzed, in which a 51% frequency of women was found. The average age was 35.9 years (SD = 11.3) in both sexes. In regard to socioeconomic status, approximately 46% of those evaluated were in the first two quintiles, whereas in terms of area of residence, most lived in urban areas (67.2%). Approximately 50% of the population had finished high school and nearly 28% reported having completed higher education. Regarding NS, it was found that approximately 60% (95% CI = [59.4, 61.4]) of the subjects were overweight or obese. Finally, as for DS as a quantitative variable, it presented an average score of 2.6 (SD = 4.1), and as a dichotomous variable, 6.3% (95% CI = [5.9, 6.8]) of subjects presented depressive symptoms. The remaining sociodemographic characteristics are reported in Table 1.
Table 1 Sociodemographic Characteristics of Study Population(N = 26 697)
| Characteristics | n | % |
|---|---|---|
| Age (years) Mean, SD | 34.9 | 10.6 |
| Sex | ||
| Male | 11 852 | 48.9 |
| Female | 14 845 | 51.1 |
| Region | ||
| Metropolitan Lima | 3 046 | 25.8 |
| Rest of Coast | 7 990 | 26.2 |
| Mountain Range | 9 056 | 31.8 |
| Rainforest | 6 605 | 16.2 |
| Socioeconomic level | ||
| Bottom quintile | 7 012 | 24.4 |
| Second quintile | 6 942 | 21.9 |
| Middle quintile | 5 372 | 19.4 |
| Fourth quintile | 4 176 | 18.1 |
| Top quintile | 3 195 | 16.1 |
| Area of residence | ||
| Urban | 17 966 | 67.2 |
| Rural | 8 731 | 32.8 |
| Marital status | ||
| Unpartnered | 6 841 | 29.3 |
| Partnered | 19 856 | 70.7 |
| Educational attainment | ||
| No education / Initial | 651 | 2.6 |
| Primary | 6 354 | 23.6 |
| Secondary | 12 142 | 45.6 |
| Higher | 7 550 | 28.2 |
| Nutritional Status | ||
| Low weight | 234 | .9 |
| Normal weight | 10 319 | 39.2 |
| Overweight | 10 775 | 39.8 |
| Obesity | 5 369 | 20.1 |
| Nutritional status by BMI cutoff points recommended for WHO reports | ||
| < 18.50 (Low weight) | 234 | .9 |
| 18.50 – 22.99 (Low normal weight) | 5 412 | 20.9 |
| 23.00 – 24.99 (High normal weight) | 4 907 | 18.3 |
| 25.00 – 27.49 (Low overweight) | 5 995 | 22.2 |
| 27.50 – 29.99 (High overweight) | 4 780 | 17.6 |
| 30.00 – 32.49 (Low obesity 1) | 2 755 | 10.2 |
| 32.50 – 34.99 (High obesity 1) | 1 427 | 5.6 |
| 35 – 37.49 (Low obesity 2) | 644 | 2.3 |
| 37.50 – 39.99 (High obesity 2) | 312 | 1.2 |
| ≥ 40 (Obesity 3) | 231 | .8 |
| Depressive Symptom Score PHQ-9 | ||
| Mean, DS | 2.7 | 3.9 |
| Depressive Symptoms by state | ||
| None (< 5) | 20 727 | 78.3 |
| Mild (5 - 9) | 4 278 | 15.4 |
| Moderate (10 - 14) | 1 113 | 4.1 |
| Moderately severe (15 - 19) | 407 | 1.5 |
| Severe (20 - 27) | 172 | .7 |
| Depressive Symptoms (PHQ-9 ≥ 10 points) | ||
| No | 25 005 | 93.7 |
| Yes | 1 692 | 6.3 |
Table 2 shows a bivariate analysis of our covariates of interest versus SD stratified by sex. This analysis showed that women presented a higher percentage of DS than men (8.6% vs. 3.8%, p<.001). Likewise, women presented a higher prevalence of DS in all the covariates of interest, except for age, where the average was similar in both sexes.
Table 2 Sociodemographic characteristics of population by depressive symptoms and sex
|
Total
(N = 26,463) |
Depressive symptoms | |||||||||
|---|---|---|---|---|---|---|---|---|---|---|
|
With depressive
symptoms in men (N = 445; 3.8%) |
With depressive
symptoms in women (N = 1227; 8.6%) |
|||||||||
| Characteristics | N | % | n | % | p value | n | % | p value | ||
| Age (years) Mean, SD | 37.9 | 11.4 | 38.1 | 11.7 | .013 | 37.9 | 11.3 | < .001 | ||
| Region | ||||||||||
| Metropolitan Lima | 3 026 | 25.9 | 43 | 3.5 | .003 | 140 | 8.6 | .002 | ||
| Rest of Coast | 7 927 | 26.2 | 104 | 2.8 | 319 | 7.1 | ||||
| Mountain range | 8 990 | 31.9 | 194 | 5.2 | 518 | 10.6 | ||||
| Rainforest | 6 520 | 16.1 | 104 | 3.4 | 250 | 7.2 | ||||
| Socioeconomic level | ||||||||||
| Bottom quintile | 6 941 | 24.4 | 164 | 5.3 | < .001 | 311 | 8.3 | < .001 | ||
| Second quintile | 6 889 | 21.9 | 111 | 3.9 | 348 | 9.4 | ||||
| Middle quintile | 5 325 | 19.4 | 86 | 4.7 | 284 | 11.2 | ||||
| Fourth quintile | 4 137 | 18.1 | 47 | 2.5 | 178 | 7.7 | ||||
| Top quintile | 3 171 | 16.2 | 37 | 2.0 | 106 | 6.2 | ||||
| Area of residence | ||||||||||
| Urban | 17 810 | 67.2 | 272 | 3.7 | .284 | 845 | 8.7 | .838 | ||
| Rural | 8 653 | 32.8 | 173 | 4.2 | 382 | 8.5 | ||||
| Marital status | ||||||||||
| Unpartnered | 6 712 | 29.0 | 126 | 4.1 | .493 | 410 | 10.4 | < .001 | ||
| Partnered | 19 751 | 71.0 | 319 | 3.7 | 817 | 7.9 | ||||
| Educational Attainment | ||||||||||
| No education / Initial | 636 | 2.6 | 6 | 7.9 | < .001 | 76 | 17.5 | < .001 | ||
| Primary | 6 307 | 23.6 | 129 | 5.4 | 398 | 10.2 | ||||
| Secondary | 12 040 | 45.6 | 214 | 3.8 | 486 | 7.7 | ||||
| Higher | 7 480 | 28.2 | 96 | 2.7 | 267 | 7.2 | ||||
| BMI Classification in 03 categories after grouping together BMI ranges | ||||||||||
| Normal weight | 10 319 | 39.6 | 233 | 4.6 | .032 | 385 | 7.8 | .002 | ||
| Overweight | 10 775 | 40.2 | 146 | 3.2 | 497 | 8.2 | ||||
| 1A obesity | 2 755 | 10.3 | 38 | 2.6 | 143 | 9.0 | ||||
| 1B obesity | 2 614 | 9.9 | 28 | 4.4 | 202 | 12.0 | ||||
Regarding our BMI variable of interest, the 1A obesity category (BMI from 30 to 32.49) comprised 51% of subjects with obesity while the 1B obesity category (BMI ≥ 32.50) encompassed the remainder (49%). The categories that presented the highest prevalence of DS were normal weight (4.6%) and 1B obesity (4.4%) in men, and 1B obesity (12.0%) and 1A obesity (9.0%) in women. An evaluation of the association with DS found an association in both sexes.
In the multivariate model (Table 3), although men presented a significant association between DS and the overweight category, cPR = .69 (95% CI = [.50, .93]) and 1A obesity, cPR = .57 (95% CI = [.37, .89]), this did not remain significant in the adjusted model. Conversely, women presented a significant association between the 1B obesity category and DS, in both the crude cPR model = 1.54 (95% CI = [1.23, 1.94]) and the adjusted one, aPR = 1.30 (95% CI = [ 1.03, 1.63]).
Table 3 Association between BMI categories, by deciles grouped together and depressive symptoms in women
| Depressive symptoms * | |||||||
|---|---|---|---|---|---|---|---|
| Raw model | Adjusted model ** | ||||||
| Characteristics | (c) PR | CI 95% | p value | (a)PR | CI 95% | p value | |
| BMI classification into 04 categories after grouping together BMI ranges, in men | |||||||
| Normal weight (18.50-2499) | Ref. | Ref. | |||||
| Overweight (25.00-29.99) | .69 | .50-.93 | .016 | .75 | .55-1.03 | .072 | |
| 1A obesity (30.00-32.49) | .57 | .37-.89 | .013 | .66 | .42-1.05 | .077 | |
| 1B obesity (≥ 32.50) | .95 | .55-1.65 | .851 | 1.12 | .63-2.00 | .696 | |
| BMI classification into 04 categories after grouping together BMI ranges, in women | |||||||
| Normal weight (18.50-24.99) | Ref. | Ref. | |||||
| Overweight (25.00-29.99) | 1.05 | .88-1.26 | .590 | .98 | .81-1.18 | .795 | |
| 1A obesity (30.00-32.49) | 1.16 | .90-1.49 | .262 | 1.04 | .80-1.35 | .772 | |
| 1B obesity (≥ 32.50) | 1.54 | 1.23-1.94 | < .001 | 1.30 | 1.03-1.63 | .028 | |
*Depressive symptoms diagnosed according to the dichotomization based on a score greater than or equal to 10 points on the PHQ-9 questionnaire.
** Adjusted by age, sex, region, socioeconomic level, area of residence, marital status, and educational attainment variables.
Discussion and conclusion
In this research, it was previously observed that the highest prevalence of depressive symptoms occurs at the extreme of the BMI categories of the population studied (Figure 2), in other words, in people with a BMI greater than or equal to 32.50 (1B obesity), which differed slightly by sex. We also observed a J-shaped non-linear relationship (with a sigmoid curve), which has also been reported in previous studies (U-shaped; de Wit, van Straten, van Herten, Penninx, & Cuijpers, 2009; Noh, Kwon, Park, & Kim, 2015). Accordingly, it was decided to model the frequency of DS according to the nutritional status of the subjects, based on the BMI distribution, where the normal weight category was considered the control group.
We expected to find an association between malnutrition due to excess and DS in both sexes. However, in our research, it was observed that presenting a higher prevalence of DS was associated with the 1B obesity category, but only in women (aPR: 1.30). As a possible explanation, it has been suggested that excess adiposity in obesity could cause an alteration in the HPA axis (hypothalamus-pituitary gland-adrenal cortex), due to the excess production of proinflammatory substances by adipose tissue, which might increase glucocorticoid levels and alter the serotonin reuptake system (Hryhorczuk et al., 2013; Pérez-Padilla, Cervantes-Ramírez, Hijuelos-García, Pineda-Cortés, & Salgado-Burgos, 2017).
At the same time, although several studies indicate that a higher prevalence of depression or DS is usually reported in women (Bromet et al., 2011; Cavanagh, Wilson, Kavanagh, & Caputi, 2017), it remains to be seen why obese men do not present a similar or greater probability of displaying DS than obese women, even when both present a surplus of adipose tissue. This is probably due to the fact that obese women have higher serum concentrations of leptin than obese men (Kocot et al., 2017; Li, Gower, Shelton, & Wu, 2017). Leptin is an adipokine produced by adipose tissue with receptors in the hypothalamus, whose function is to suppress appetite, but it also plays a pro-inflammatory role (Aguilar-Valles, Inoue, Rummel, & Luheshi, 2015). Although it could have antidepressant effects (Guo, Huang, Garza, Chua, & Lu, 2013; Lu, 2007), high levels of it have been reported in obese patients and those with depression (Considine et al., 1996; Kocot et al., 2017) and the presence of leptin resistance has been proposed, possibly caused by an excess of inflammatory substances (Milaneschi, Simmons, van Rossum, & Penninx, 2019; Patist, Stapelberg, Du Toit, & Headrick, 2018). We therefore believe that higher levels of leptin and its dysfunction would encourage greater feelings of hunger in women and increase inflammation, which would therefore contribute to the progression of obesity and the development of DS.
Another possible factor involved in the association found in this study is the effect of obesity on female hormones, since it can alter their concentrations (Brewer & Balen, 2010), which could subsequently cause mood alterations and the development of DS (Cooney & Dokras, 2017; Halbreich & Kahn, 2001). For their part, obese men may have lower testosterone levels, which is associated with depressive disorder (Buvat, Maggi, Guay, & Torres, 2013). However, it has been suggested that other factors may reduce the likelihood of suffering from depression in this sex, such as the different activity of estrogens in the male brain and the structural differences in their hippocampus (Albert, 2015; Gillies & McArthur, 2010).
Likewise, depression or DS correspond to mood disorders and there is scientific evidence indicating the influence of the media on people’s self-perception of the appropriate physical appearance, which has repercussions on their self-esteem (Abbas & Karadavut, 2017; Frederick, Daniels, Bates, & Tylka, 2017). For males, the ideal stereotype tends to be a slender, muscular man; whereas a thin looking man is associated with weakness (Frederick et al., 2007; Mussap, 2008). The obese men in our sample may have had a lower likelihood of having DS because they may have associated their appearance with robustness and strength (Schwartz & Brownell, 2004). Conversely, in the case of women, having a slim appearance is considered the ideal image, since it is related to higher levels of beauty (Frederick, Forbes, & Berezovskaya, 2008). Therefore, as their weight increases, their degree of body dissatisfaction this occurs to a greater extent than it does in men (Ålgars et al., 2009), which may have contributed to the findings of this study.
Lastly, this study found that men with verweight and 1A obesity in the raw model were less likely to have DS, unlike those in the 1B obesity category. However, these associations disappeared when other variables were adjusted for. It should be noted that our sample of obese men was small, so additional studies with larger numbers of subjects are required to confirm our findings.
Comparison with other studies
A comparison of our findings with those in the literature found that overweight and obesity are usually reported to be associated with the presence of depression or depressive symptoms in one or both sexes but are more likely to be so in women. For example, a recently published study on Mexican adults found an association between obese women and a greater likelihood of developing DS, but not in males, which coincides with our finding (Zavala et al., 2018). Two other studies analyzed the relationship between BMI and depression, finding an association in both sexes and a U-shape, although their analyses were conducted with both adults and older adults (de Wit et al., 2009; Noh et al., 2015). Two meta-analyses also reported that women tend to be more depressed than men if they are overweight (de Wit et al., 2010; Luppino et al., 2010). However, different results have been found in the Asian population, where being underweight or having a lower BMI is associated with a greater presence of DS (Qian, Li, & Ren, 2017; Zhang et al., 2016), supporting the well-known “jolly fat” hypothesis (Zhang et al., 2016).
As for limitations regarding the BMI, the latter fails to take body composition into account, so it may not be accurately assessing the nutritional status of a person. However, this instrument is accessible and easy to administer in studies implemented at the population level (Hernández, Barrios, & Vázquez, 1994). Second, there may have been an information bias at the time of data collection due to errors during the formulation of questions or data recording, coupled with the fact that respondents may have misunderstood the questions (Gerstman, 2013). Third, there may have been a misclassification bias when deciding to subjectively group the obesity category, which could have led to an overestimation of the prevalence found (Gerstman, 2013). Fourth, the presence of double causality between depressive symptoms and BMI also exists, as has been reported in other studies (Faith et al., 2011; Mannan, Mamun, Doi, & Clavarino, 2016), but since this is a cross-sectional study, we could not determine which causal relationship occurred first. If we had been able to do so, we would have estimated it. Fifth, this research does not enable us to know the actual prevalence of depression in the country, since a clinical diagnosis must be made by a specialist and the use of diagnostic scales is required. However, the PHQ-9 is a widely used instrument for these studies and provides an approximation to the actual prevalence of the disease.
There is a strong association between nutritional status and depressive symptoms in Peruvian women, with obese women being more likely to present depressive symptoms. Still further studies are required, however, to confirm our results and achieve a better understanding of the problem in men.

