


Services on Demand
Journal
Article
 text in
  English (pdf)
 Article in xml format
 Article references
 Send this article by e-mail
Indicators
-
 Cited by SciELO
 -
 Access statistics
Related links
-
 Similars in
SciELO
Similars in
SciELO
Share

 Permalink
Revista mexicana de fitopatología
On-line version ISSN 2007-8080Print version ISSN 0185-3309
Rev. mex. fitopatol vol.39 n.3 Texcoco Sep. 2021 Epub Dec 13, 2021
https://doi.org/10.18781/r.mex.fit.2104-6
Scientific reviews
Web-based epidemiological surveillance systems and applications to coffee rust disease
1 Programa de Postgrado en Fitosanidad-Fitopatología Colegio de Postgraduados (CP) , Campus Montecillo, km 36.5 Carretera México-Texcoco. Montecillo, Estado de México, México, C.P. 56230.
2 Programa de Postgrado en Fitosanidad-Fitopatología, Laboratorio de Análisis de Riesgo Epidemiológico Fitosanitario (CP-LANREF). Colegio de Postgraduados (CP) , Campus Montecillo, km 36.5 Carretera México-Texcoco. Montecillo, Estado de México, México, C.P. 56230.
3 Programa de Postgrado en Fitosanidad-Fitopatología, Colegio de Postgraduados (CP) , Campus Montecillo, km 36.5 Carretera México-Texcoco. Montecillo, Estado de México, México, C.P. 56230.
4 DGSV-SENASICA km 37.5 Carretera Federal México-Pachuca, Calle Centenario, Tecámac, Estado de México, México, C.P. 55740.
The advancement of digital technology has made it possible to conceive automated Epidemiological Surveillance Systems (ESS) with aholistic-systemicapproach allowing effective operation, management, and processing of phytosanitary data for fast decision-making applied to regional prevention and pest management. This surveillance type focuses on plant health, overcoming the reductionist pest vision of the conventional normative surveillance. An ESS implies the precise definition of the regional framework, objectives, pest(s) in wide-sense, human/financial resources, regulatory context, support research planning, operational structure, and innovation models. These elements determine the precision, frequency, and type of sampling and monitoring and the selection of variables related to a novelepidemiological system. In contrast to the normative surveillance, a systemic ESS has descriptive and risk forecasting capabilities, including early warnings, based on spatial and temporal analyses. A web-based ESS assures a flexible-dynamic generation of reports and automated analysis. An ESS operated on web platforms, emphasizing open source software and tools, can be hosted on generic or dedicated servers for metadata storage configured with Linux / Apache technologies with 24/7 (h day-1) functional capabilities. Open source tools include MySQL / MariaDB and other systems as database managers; PHP / Node.js, and JavaScript, Ajax, HTML5 and CSS as web design base ‘back-end’ and ‘front-end’ programs, respectively. This review focuses on principles, conceptual attributes, general methodological approaches, and objectives of web-based ESS. An overview is presented with an ESS developed in Mexico for coffee plantations (Coffeaspp.), which allowed the surveillance of 19 pests, nine under quarantine status, through the generation, management, and analysis of 87.4 million climatic data and 15.7 million epidemiological records over 2013-2019.
Key words: Hemileia vastatrix; Coffea arabica; Early warning; Prevention
El avance de la tecnología digital ha permitido concebir Sistemas de Vigilancia Epidemiológicos (SVE) automatizados con un enfoque holístico-sistémico favoreciendo la planeación, operación, gestión y procesamiento de datos fitosanitarios de manera efectiva y oportuna para toma de decisiones en la prevención y manejo regional de plagas. Este tipo de sistemas se enfocan en la salud del cultivo superando la visión reduccionista de plaga en la vigilancia normativa convencional. Un SVE web implica la definición clara del marco regional, objetivos, plaga(s) en su amplia acepción, recursos humanos/financieros, contexto normativo, líneas de investigación de soporte, estructura operativa y modelos de innovación. Estos elementos determinan la precisión, frecuencia y tipo de muestreo y monitoreo, así como las variables de medición relativas a un novel sistema epidemiológico. A diferencia de la vigilancia normativa, un SVE web holístico-sistémico tiene capacidad descriptiva y de pronóstico de riesgos, incluyendo alertas tempranas a partir de análisis espaciales y temporales. La interfaz web SVE asegura la generación flexible y dinámica de reportes y/o análisis automatizados. Un SVE operado en plataformas web, con énfasis en lenguajes de programación y herramientas de uso libre puede ser alojado en servidores genéricos o dedicados para almacenamiento de metadatos configurados con tecnologías Linux/Apache y funcionalidad 24/7 (h día-1). Programas de uso libre incluyen MySQL/MariaDB y otros como gestores de bases de datos; PHP / Node.js, y JavaScript, Ajax, HTML5 y CSS, como tecnologías web de maquetado base ‘back-end’ y ‘front-end’, respectivamente. Esta revisión se enfoca en principios, atributos conceptuales, enfoques metodológicos generales y objetivos de SVE base web. Aplicaciones generales se ilustran con un SVE desarrollado en México para el cafeto (Coffea spp.), el cual permitió operar la vigilancia de 19 plagas, nueve con estatus cuarentenario, mediante la generación, gestión y análisis de 87.4 y 15.7 millones de registros climáticos y epidemiológicos, respectivamente, obtenidos entre 2013-2019.
Palabras clave: Hemileia vastatrix; Coffea arabica; Alerta temprana; Prevención
The concept and scope of epidemiological surveillance
Epidemiological surveillance (ES) embraces a phytosanitary concept referred to planned actions that aim to prevent and mitigate the effect of epidemics by restricting the entry, establishment, and/or population density increase of a pest(s) in an area of exclusion or endemicity, to avoid or reduce continued productive impacts that compromise the sustainability and resilience of a crop (Mora-Aguileraet al., 2014b). This definition has three implications: 1) ES’s ruling principles are protection and prevention, the latter constituted in turn by sequential strategies of exclusion and eradication. This implies that ES applies to both organisms of quarantine interest and those regionally prevalent of economic importance; 2) The purpose of ES is to monitor epidemic risks. Consequently, a novel epidemiological system is its compelling rational framework (Figure 1). It transcends the narrow concept of ‘Surveillance’, defined in the International Standards for Phytosanitary Measures 5 (ISPM 5), published by the International Plant Protection Convention (IPPC), bounded to FAO (https://www.ippc.int/es/). This is defined as: ‘An official process to collect and record information on the presence or absence of a pest through the use of surveys, monitoring or other procedures’, which implies a strategy limited to monitoring a pest-organism outside of its epidemic context; 3). ES can incorporate any biotic and/or abiotic attribute (e.g., nutrition and air pollutants) relevant to the health of a plant population, that is, the crop (Mora-Aguileraet al., 2016a). Additionally, the pest in its broad sense (pathogens, insects, weeds, etc.) is the population biological unit of interest (Mora-Aguileraet al., 2017; Mora-Aguileraet al., 2014d), freeing itself from the infection principle typical of classical epidemiology and still deep-rooted on conventional surveillance (Carbajal-Yepezet al., 2019; Parnellet al., 2017). Eventually, ES transcends the population to incorporate the community as a comprehensive analytical, biological base (Mora-Aguileraet al., 2017; Mora-Aguileraet al., 2014d). This approach represents a paradigm shift in classical epidemiology. Other meanings of ES, in general, restrict the biological scope to a taxonomically related pest(s) (Kaundalet al., 2006). The rational epidemiological framework is not explicit, it is omitted in the strategy (Firanj Sremacet al., 2018), or its scope is limited to reporting the presence and absence of a pest (ES type 1) or stratified by levels of detection (ES type 2) (Carbajal-Yepezet al., 2019; Parnellet al., 2017) (Table 1).
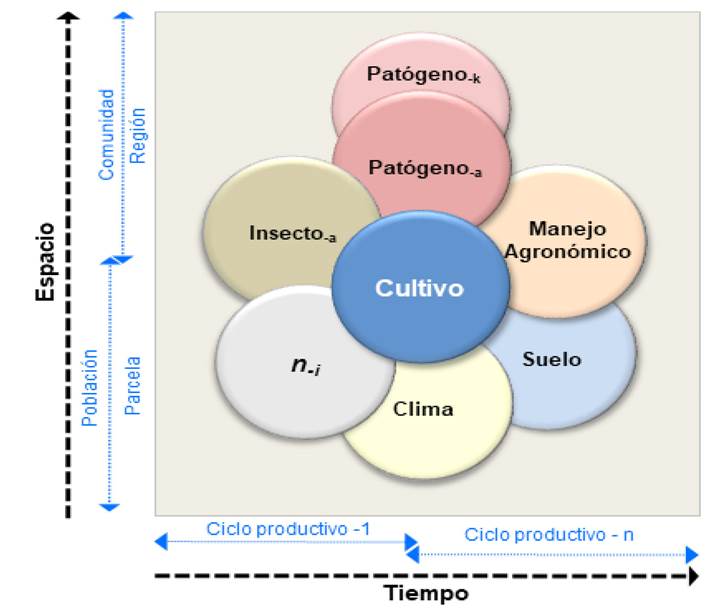
Figure 1 Novel epidemiology system in which the plant subordinates the remaining subsystems at different time and space scales. The proposed system is flexible to include n-subsystems (e.g., vector) and allows the holistic-systemic appli cation of the pest management prevention and protection principles. This system replaces the restricted epide miological triangle and tetrahedron. The epidemiology system is intrinsically systemic and its implementation lead towards a holistic approach with the dynamic and interactive inclusion of n-pests (pathogens, insects, mites, etc.) assessed in their macro and micro-environment niche (Figure 4 and 6), transiting from the population of classical epidemiology to the community.
Recent experiences have shown that ES type 3, to which the proposed definition adheres, involves a complex and dynamic implementation of technical-scientific, operational, and digital innovation strategies (Kaundalet al., 2006). Under this approach, its systemic application at time and space scales that guarantee the solution of a phytosanitary problem lead to the development ofEpidemiological Surveillance Systems(ESS), which often are referred to asEpidemiological Surveillance Programsin the context of public policies. The system approach is natural because its conception and operation are based on theepidemiological systemin its modern, flexible structure and dynamicn i -subsystems, the plant population as an integrativesubsystem,and time-region asinput(e.g., pest(s), varieties) andoutputscontrolling dimensions (e.g., inoculum load, crop production) (Figure 1).
Table 1 Types of phytosanitary epidemiological surveillance (EV) proposed according to their objective, methodological approach and emphasized phytosanitary principle, exemplified with some EV Programs.
| Tipo VE | Objetivo / Metodología | Principio Fitosanitario | zEjemplos de Programas de VE operados en un entorno web |
|---|---|---|---|
| Tipo 1 | Estatus de plaga: Área libre | Exclusión | DGSV/CNRF, https://prod.senasica.gob.mx/SIRVEF |
| Área de Baja prevalencia | EPPO, https://gd.eppo.int/ | ||
| / Análisis cualitativo con adherencia a NIMF 6 y 8 | NAPPO, https://www.pestalerts.org | ||
| OIRSA, https://geoportal.oirsa.org/ | |||
| Tipo 2 | Delimitación y contención regional | Exclusión | DGSV/CNRF/SIRVEF |
| https://prod.senasica.gob.mx/SIRVEF | |||
| / Análisis cuantitativo descriptivo | Erradicación | SIMDIA | |
| http://www.siafeson.com/simdia | |||
| Tipo 3 | Estatus de plaga, Delimitación regional, Riesgos epidémicos, Alertas y criterios de accionabilidad Dispositivos de emergencia Campaña fitosanitaria | Exclusión | ANACAFE |
| https://www.anacafe.org/Servicios/Cedicafe | |||
| Erradicación | FUNDECITRUS | ||
| https://www.fundecitrus.com.br/alerta-fitossanitario | |||
| Protección | Fundación ABC | ||
| https://fundacaoabc.org/ | |||
| / Análisis cuantitativo descriptivo e inferencial | PVEF-Cafeto | ||
| https://www.lanref.royacafe.org.mx | |||
| SIVEA-Agave | |||
| https://www.sivea.org.mx |
zLinks of some ES Programs cannot be fully functional or allow public access according to institutional operative policies.
ESS has variable spatial scalability. However, its phytosanitary purpose is optimized at a regional level (Coria-Contreraset al., 2019; Flores-Sánchezet al., 2017; Acevedo-Sánchez and Mora-Aguilera, 2016; Mora Aguileraet al., 2014e). A region, in this context, is an area made up of a set ofn-productive units among which functional relationships of interdependence are established, direct or indirect, through routinely everyday use of agro-environmental, economic and human resources, as well as specific services, infrastructure, and policies (Coria-Contreraset al., 2019; Mora-Aguileraet al., 2016b; Coria-Contreraset al., 2015a, b; Mendoza-Ramoset al., 2015a).
Evidence from some successful regional phytosanitary programs has shown that crop-focused management can help develop strategies for sustainability and productive resilience (Mora-Aguileraet al.,2014d), which are not biologically, environmentally, and technically feasible at the unit production level (field plot) or independent fields. In general, the field-plot vision of surveillance and other planned phytosanitary management practices, e.g., fungicides scheduled, is the reason for undesirable effects on productive assets: plant genetic erosion, loss of varietal resistance, development of resistance to limited mechanisms of action of pesticides, food safety problems, contamination of water and soil resources, etc. (Mora-Aguileraet al.,2014c).
Surveillance in classical epidemiology
In classical epidemiology, sensu Vanderplank, surveillance has its antecedents inforecasting modelsandearly warningsapplied at the level of farm production units to support phytopathogen control strategies under theprotectionprinciple. Notoriously,preventionwas absent from these seminal analytical approaches. Comprehensive review articles allow the conceptual and applicative evolution of forecasting models to be outlined. For example, Krause and collaborators (1975) highlighted the mechanistic importance of pathogen biology by using variables associated with the pathogenic process, e.g., the incubation period (see the algorithms section, Figure 5). Coakley and collaborators (1985), and further Huber and Gillespie (1992), emphasized using microclimatic sensors to generate predictive climatic variables. De Wolf and Isard (2007) analyzed the advances of quantitative modeling and the perspectives of digital technology, concluding that:‘‘efforts appear to be greater than just a few decades ago, and include novel applications of Bayesian decision theory. Advances in information technology have stimulated innovations in model application’’.
Early warning, less popular thanforecasting, actually represented a conceptual variant rather than an analytical one. Its purpose was to generate a predictor as ‘‘early’’ as possible in an epidemic progression induced by a specific phytopathogen. This predictor(s), generally climatic, is used as a criterion of actionability for control strategies with protective purposes. At present, anearly warninghas been mistakenly conceived as a synonym for ES, calling themEarly Warning Systems,among others terms. Its greatest restrictiveness is its non-systemic condition. However, its analytical structure and its strong emphasis on climate variables have favored its digitized implementation by companies that market automated climate equipment for field-plot use in specific crops (https://www.ambientweather.com/dadi6571.html). Given the eventual adoption by a broad productive sector, its scope may be regional. However, its particular application to the end-user limits a comprehensive phytosanitary regional integration.
Two classic forecasting systems, which inspired the adaptation or derivation of other systems, illustrate how web systems have made it possible to scale and automate surveillance models. In the 70’s, BLITECAST and FAST (from which TOMCAST later derived) were pioneering computerized forecasting systems, which generated actionability criteria based on empirical deterministic models combining decision matrices with temperature, precipitation, relative humidity, and leaf wetness to decide the first and subsequent applications of fungicides to controlPhytophthora infestansandAlternaria solani(Maddenet al.,1978; Krauseet al.,1975). These models were developed in FORTRAN IV operated on IBM 370/168 ‘‘mainframe’’ computers. The calculation of parameters with these models required the manual input of climatic data. The BLITECAST operation clearly shows the principle underlying a surveillance system and the aspects that current digital technology has allowed automating (highlighted with underlining):“When a grower desires a Blitecast, he telephones the Blitecast operator and reports his most recently recorded environmental data. The operator submits data to the computer via a typewriter terminal. The computer analyzes data within a fraction of a second and returns the forecast and spray recommendation to the operator, who relays it to the grower. The entire operation can be completed during a standard 3-minute telephone call. In this way, it is possible to provide, from a central office, Blitecast for 15 to 20 distant locations in one hour”(Krauseet al.,1975). Later, in the 90’s, the actionability criteria were generated from empiricalmodelsdirectly on personal computers using programs developed in Turbo-C or Turbo Pascal, among others, self-executable in the MS DOS® operating system, the predecessor of MS Windows®. Examples of these systems are DMCAST and PLASMO to controlPlasmopara viticola(Parket al., 1997; Rosaet al., 1993). Currently, these types of systems are commercially distributed as a complement to climatic equipment for individual field-plot use applicable to pests and diseases of grapes (Vitisspp.), almond (Prunus dulcis), apple (Malus domestica), pear (Pyrus communis), and peaches (Prunus persica) (https://www.ambientweather.com/dadi6571.html). This commercial vision has limited the original regional ESS approach and biased theepidemiological systemto theclimatecomponent as predictive variables, a pragmatically operational trend feasible at the field-plot level but limited to the sustainable plant health approach (Kimet al., 2020; Firanj Sremacet al., 2018).
During this century, advances in digital web and mobile telephony technology have promoted regional ES and strengthened classic predictive strategies (Coria-Contreraset al., 2019; Mora-Aguileraet al., 2015a). However, the adoption of systemic epidemiological approaches remains limited (Carbajal-Yepezet al., 2019; Parnellet al., 2017), privileging, for example, automatic and massive generation variables such as climatic ones (Kimet al.,2020; Firanj Sremacet al.,2018; Newlands, 2018), or relying heavily on classical theoretical modeling pathogen-oriented (Parnellet al., 2017). The evolution of knowledge and technological developments in ES has been limited mainly to fulfill the principles ofinfectionandprotectionat the field-plot level. In general, the biological and regionalholisticvision has been excluded, and thesystemicapplication of theepidemiological systemas a comprehensive rational framework has been absent or partially applied. We must overcome this restrictive scientific and technological approach based on a new paradigm where the spatial unit is scaled to the region (Mora-Aguileraet al., 2014e), and the plant’s health, in the broad sense, is the integrating axis of a newepidemiological systemas a rational basis forpreventionandprotection(Figure 1). The trend towards aholistic-systemicvision will be a big challenge for plant health in the future. Paradoxically, the problem does not seem to be the technological one, but the classical scientific views atomized by specialization. In contrast, the precision and extensive agriculture trend to satisfy food supplies and crops value chain (Carbajal-Yepezet al., 2019) will force comprehensive regional, national and global ESS.
Regulatory and operational framework
ESS at the regional level requires effective planning, operability, and eventually legal frameworks that phytosanitary institutions and organizational partners can ideally meet. The World Trade Organization (WTO), IPPC, National and Regional Plant Protection Organizations (NPPO and RPPO, respectively), and growers organized linked to NPPOs have established legal or regulatory frameworks to safeguard plant health and food safety in a regional environment, primarily for international trade purposes (Carbajal-Yepezet al., 2019). In this context,surveillance, without epistemological associativity with epidemiology and an apparent reference to the pest in its broad sense, was conceived with a normative approach unrelated to methodological developments of classical epidemiology. However, the emergence and mobility of the recurrent pest through alternative routes to commercial paths (Mendoza-Ramoset al., 2021; Carbajal-Yepezet al., 2019; Parnellet al., 2017; Mora-Aguileraet al., 2016a; Mora-Aguileraet al., 2015a; Mora-Aguileraet al.,2014a), has caused some of these instances to promote the scientific-technological development of ESS beyond the regulatory framework established, for example, in the ISPM 6Guidelines for Surveillance(https://www.ippc.int/es/). Such normative, whose purpose is to harmonize surveillance among countries adhering to the IPPC, effectively determines the status of a pest but is highly restrictive conceptually and methodologically to support robust quantitative systems, inferential and applied to phytosanitary decision-making in crop production (Table1).
In 2019, the new version of ISPM 6 calledsurveillancewas published. A restrictive epidemiological conceptual framework still prevails in this version, but analytical and methodological options are expanded according to quantitative epidemiology to reduce the risk of pest mobility due to international trade and other paths. However, the importance of protecting strategic crops from pre-existing pests in a country is also recognized (https://www.ippc.int/es/). The ISPMs are minimum guidelines for NPPOs that can be optimized conceptually and methodologically, with the corresponding scientific support. Thus, each country can develop official ES programs according to its phytosanitary needs and legal framework (Table 1). In addition, organized growers or companies can implement ES programs, generally type 2 or 3, which may have the technical and/or financial support of the NPPO.
An example is the Integral System of Protection and Epidemiological Surveillance of Agave (SIVEA in Spanish), associated to the Tequila Regulatory Council (TRC) with technical and financial official support (Table 1). In other cases, productive associations can develop and operate their ES programs according to their productive and commercial needs. Adherence to international regulations is not required while ensuring productivity and effective management of phytosanitary risks. The Guatemalan National Coffee Association (ANACAFE), the Citriculture Defense Foundation (FUNDECITRUS), and the ABC Foundation constituted for assistance in wheat, soybeans, and beans in Brazil, are examples of scientific non-governmental entities financed directly by growers, with limited or no official participation (Table 1).
Epidemiological surveillance programs and digital technology
Epidemiological surveillance at the regional scale can generate and use databases consisting of millions of metadata. Overcoming the analytical barrier of field-plot data was possible due to the advent of digital technology in the 90’s. Three technological events made it possible to break with field-plot surveillance and the use of local forecasting models: Development of the World Wide Web (WWW), which allows data to be consulted anywhere in the world through an internet service provider; the standardized SQL database language for storing large volumes of multidimensional structured data and its subsequent consultation 24/7 (h day-1) (e.g., Apache Derby) (Chiavegatto, 2015); and finally, the Android® mobile operating system, developed in open source programs, which enabled the integration of programs (Apps) to record variables measurementsin situ,transfer in real-time to WWW databases to automate epidemiological analyzes and reception of phytosanitary alerts (Guzmán-Hernándezet al., 2017). The digital revolution made the cross-sectional integration of plant health at the community level of crops (e.g., sour and sweet citrus species) and pests that interact in a region (e.g.,CLas, CTV,Diaphorina citri, Toxoptera citricidain citrus). As a result, at the scientific level, it was possible to operate complexity, as aholistic-systemicapproach, to epidemiological responses and, at the productive level, correctly conceive and assess sustainability and resilience indicators. Before the technological developments of the 90’s, the researcher had to exploit limited databases to the maximum through models programmed in Fortran or Pascal executed using punched cards in large IBM ormainframecomputers (Casacuberta, 2013). Alternatively, phytosanitary databases created by academia or international organizations (e.g., FAO) were massified by digital devices associated with dBase-type data managers but with no or limited direct application in modeling.
At present, ‘normative’surveillance(i.e., VE type 1 and 2), which provides official lists of regionally present pests, descriptive and categorical analyzes of pests using a web environment, has wide acceptance in NPPOs and regional phytosanitary protection organizations (RPPOs) such as NAPPO, OIRSA, and EPPO, yet with asymmetric advances (Table 1). These instances operate ES following regulatory and transparency guidelines established in the Agreements on Sanitary and Phytosanitary Measures of the World Trade Organization (WTO), further formalized and expanded in the IPPC. These qualitative ES web programs vary in flexibility, dynamism, user interaction, report generation, etc. Methodologically, they depend on pest diagnosis protocols and sampling and/or monitoring strategies (Carbajal-Yepezet al., 2019; Parnellet al., 2017). Consequently, they are feasible to be implemented with the technical expertise of RPPO or NPPO without supervised scientific execution. In contrast, the application and adoption of ES type 3 have been limited for the lack of rational models and conceptual, methodological, operational, and technological constraints. An effectiveholistic-systemictype 3 ESS is generated from the interdisciplinary conception of threeinterdependent models: A)Integrative innovation modelbetween research, institutional policies, and operational structures. This guarantees the adoption and applicability of inter-institutional management and organizational strategies; B)Scientific-technological model(Figure 2); and C)Integrative digital technologies model(Figure 3), which allow planning and applying relevant technologies to the scientific needs of the ESS (Mendoza-Ramoset al., 2021; López-Bautistaet al.,2020; Coria-Contreraset al., 2019; Acevedo-Sánchezet al.,2017; Mora-Aguileraet al., 2016b; Mora-Aguileraet al.,2014d). Another limitation to overcome is the tendency to use a rational, analytical framework generally restricted or limited to a subsystem ofthe epidemiology systemas a predictive context of changes in pest dynamics (Figure 1). For example, a trend in the last 20 years has been the emphasis on variables of the climate subsystem, such as temperature, wind, relative humidity, etc., favored by the availability of digital weather stations and public access to regional databases (e.g., CONAGUA in Mexico) and global (NOAA) (Magarey and Isard, 2017), for the development of regional phytosanitary risk alerts (Kimet al.,2020; Moschiniet al., 2004). This subsystem has shown viability in extensive crops with linear thermal gradients (Tsukaharaet al., 2008; Moschiniet al., 2004), but in general, its application is not feasible in heterogeneous agroecosystems due to the exclusion of other subsystems associated with rational biological processes of pests (Mora-Aguileraet al.,2016a, b; Mora-Aguileraet al., 2014d) (Figure 1). A systemic ESS is inherently holistic. It requires a robustepidemiological systemand integrative models as rational frame. Digital technology is clearly subordinate to ESS needs and objectives. It is not the ultimate goal (Figure 4).
The general structure of an Epidemiological Surveillance System type 3
A web-based ESS in theholistic-systemicapproach, a type 3 ES, corresponds to acomplex dynamic systemcharacterized by the interaction and interdependence of multiple concurrent processes, all derived from theepidemiology systemrational frame (Figure 2-4), which operate with the following assumptions: 1) Every phytosanitary phenomenon is multidimensional and has a highly dynamic multivariate variability in time and space. Its characterization and quantification are the basis of modeling, epidemic indicators, and algorithms development; 2) Require planned feedback, and optimization protocols, e.g., a molecular diagnosis can correct risk factors, or a new pest incursion implies reconfiguring prevalence algorithms and analyses interfaces; 3) It involves non-linear functional relationships between variables whose parameters are also relative in space-time. For example, the sporulation rate ofH.vastatrixversus leaf severity does not have a simple proportional relationship, and its estimated parameters are dependent on the coffee variety (Coffea arabica) or management factors (Mendoza-Ramoset al.,2015b); 4) It includes qualitative (e.g., agronomic management categories) and quantitative measurements (e.g., number of leaves with rust lesions), which diversify the analytical strategies; and 5) The human factor is a substantial part of the system. Directly, by providing quality of data records collected on the field and adopting preventive/protective actionability criteria; and indirectly, thought phytosanitary and agricultural policy planning. Due to the intrinsic complexity, an ESS requires aholistic-systemicapproach and, ideally, an interdisciplinary team involved in cyclical processes of analysis and synthesis, leading to the solution of the problem (Figure 1 and 2).
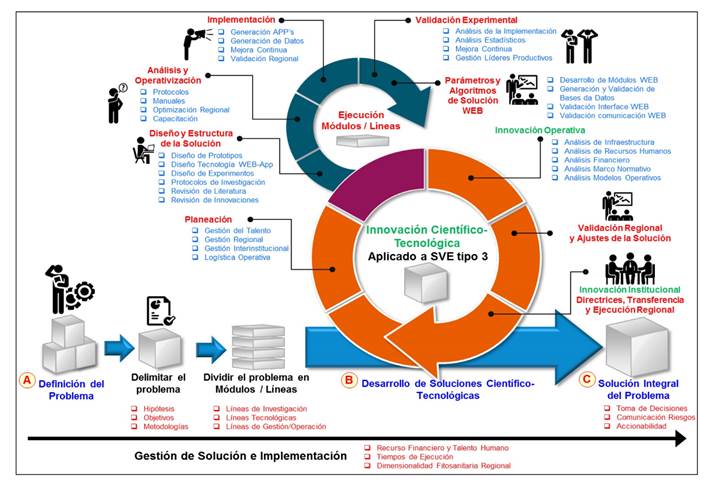
Figure 2 Scientific-technological model used in the conception, development, validation and implementation of a web-based Epidemiological Surveillance System (ESS) type 3. The model is based on three main elements: Definition of the problem (A); development of scientific-technological solutions (B); and comprehensive solution (C). The model ge nerates continuous technological innovations which prompt complementary institutional and operative innovations to guaranty ESS success. Source: CP-LANREF.
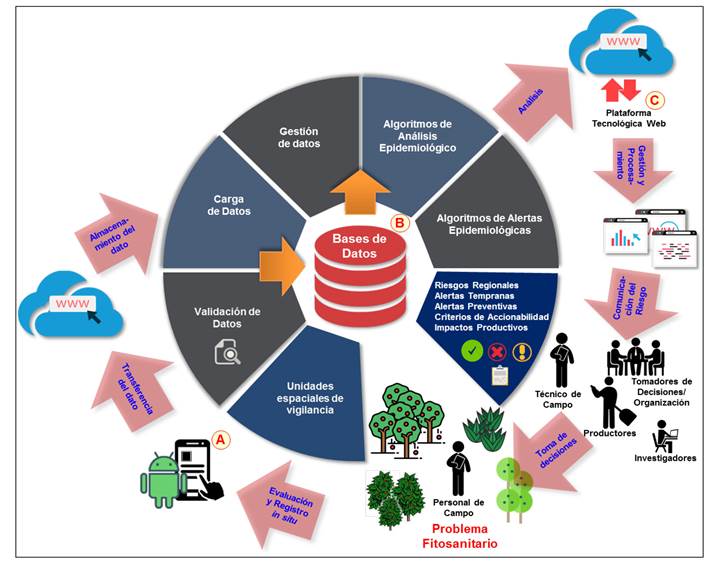
Figure 3 Integrative model of digital technology applicable to the development and processing of data in a web-based Epide miological Surveillance System type 3 through three integral elements: Design of open source mobile applications for evaluation and records of epidemiological n-variables in situ (A); structural design of relational n-databases (B); and development of a modular web-platform for metadata processing, analysis, and risk communication (C) (Figure 4). Source: CP-LANREF.
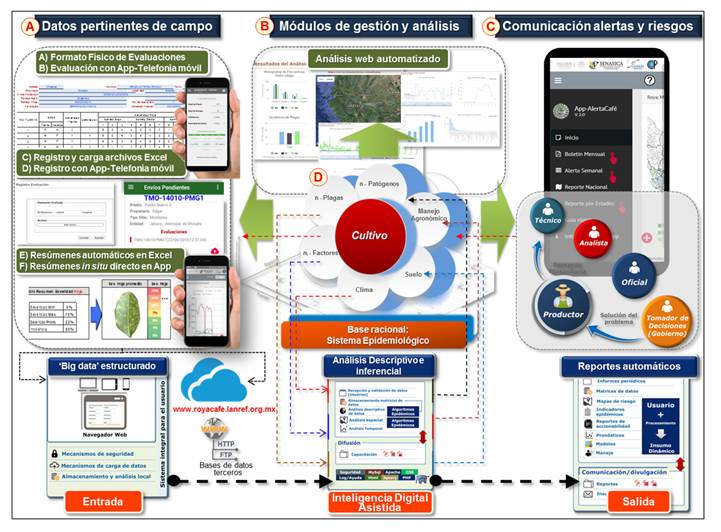
Figure 4 General sistemic model of a web-based Epidemiological Surveillance System type 3 implemented by trained hu man resources in the holistic-systemic conception of the prevention and protection principles applied to pest mana gement. It is supported by ad hoc mobile applications for pertinent field data collection (A) (Figure 3), its sending in real-time to a modular web system for big data management and automated dynamic analyses (B), and risk communication through descriptive graphics, epidemic indicators and epidemiological alerts applied to decision making in regional integrated phytosanitary management (C). The model has the novel epidemiological system as comprehensive approach (D) (Figure 1). Source: CP-LANREF.
Thisholistic-systemicapproach results in a digital technological model of innovation (Figure 3) (Kanget al.,2010), but articulated to a rational research framework to support the development of methods and algorithms in solving the phytosanitary problem (Coria-Contreraset al.,2019; Mora-Aguileraet al., 2014d; Kuanget al.,2012). The general structure of a web-based ESS has three perfectly differentiated components: 1) Generation of relevant field data through App-Web platform synchronization; 2) Modular system for advanced data management and analysis in the web platform and restricted analysis in the App; 3) Alerts and risks communication. These components have flow diagrams specific to the phytosanitary problem, so they have their digital programming structure and cannot be used arbitrarily (Figure 4) The development core can be a back-end programming language like PHP complemented with others front-end types like JavaScript. In this concept, aweb platformshould be understood as a web interface specifically designed and developed to graphically represent and/or intervene in a big phytosanitary database through specific user requirements upon an automatized menu provided to comprehend and solve a phytosanitary problem. However, the intended user-friendly web platform represents only the operational digital model, not the comprehensiveness of theholistic-systemicprocess associated with an ESS type 3 that an interdisciplinary team supervises and continuously improves (Figure 2 - 4).
Mobile applications - web platforms in the management of epidemiological data
Mobile telephony and the development of applications (Apps) to operate on these devices have revolutionized ES, being fundamental to ESS type 3, in the last ten years (Guzmán-Hernándezet al.,2017; Aanensenet al.,2009) (Figure 3 and 4). Apps with relevant architecture allow the recording and transferring data in real-time with telephone service providers and low-cost equipment. Android®, the popular open-source operating system, has favored the generation and innovation of Apps according to specific ESS needs. However, these developments must ensure adequate biological, epidemiological, and operational bases for functional purposes. An interdisciplinary team is essential to achieve this purpose. The usability growing trend of Apps in ES, and in general in phytosanitary programs, has exhibited application failures because its conception is delegated to the software developer.
Additionally, an App can be designed for particular purposes, e.g., to assess disease severity, sampling units calculation, georeferencing of suspicious pests and symptoms, and to the record of trapped individuals (Pethybridge and Nelson, 2018; Pethybridge and Nelson, 2015). This leads to the excessive fragmentation of a phytosanitary problem in multiple Apps, but handily for ES type 1 and 2. In contrast, a generic App, overloaded with modules and menu tools can be complex and impractical. On the other hand, the technical and conceptual feasibility to develop an App oriented to end-users, without web interactivity, oversimplified the EES technological needs. In reality, Apps for ESS type 3 support must be conceived for bidirectional flow of data referenced in space-time, structured linked to its phytosanitary web platform with multiple accredited users to register and receive standardized and synchronous information to and from the web environment (Figure 3 and 4) (Guzmán-Hernándezet al.,2017). These Apps have an epidemiological purpose and are conceptually and operationally complex (Drewet al., 2020; Guzmán-Hernándezet al.,2017). In other cases, such as Epicollect5 3.0.3, a pioneering generic application (Aanensenet al.,2009), they are linked to a web environment for data integration and visualization, but they do not incorporate algorithms for decision-making.
ESS type 3 Apps are essential to record periodic data in real-time from extensive evaluations of variables associated with theepidemiological systemin n-sites/regional production units preselected with quantitative inductivity criteria, ideally with statistical error estimates for technical auditability purposes (Acevedo-Sánchezet al.,2017; Parnellet al., 2017; Acevedo-Sánchez and Mora-Aguilera, 2016). Eventually, the structured collection of data storage hock to a web platform generates large volumes of data (i.e., structured big data), which are intervened by dynamic algorithms to generate descriptive graphic outputs, automated analysis, and development of actionability criteria for decisions making inherent to the ESS objective(s). A mobile application designed with an epidemiological approach also allows its implementation in ESS support research (Mendoza-Ramoset al.,2021; López-Bautistaet al., 2020; Coria- Contreraset al., 2019) and in risk communication by receiving alerts for decision-making. App Alerta Café v. 2.0, available in Play Store, was supported for three years with this purpose (CP-LANREF, 2017. Not published). CP-LANREF generated the applications App-VEFCafe v4.7 and App-SIVEA v4.1 for ESS of coffee (C. arabica) and agave crop (Agave tequilana), respectively, officially operated by the NPPO (SENASICA-DGSV) (Table 1). These applications allow the collection of a total of 79 and 71 scheduled metadata, totaling 103,242,764 and 35,664,551 database web records in eight and five years of implementation, respectively. Operational characteristics include geopositioning, user authentication, characterization of productive units, ID QR systems, pest damage assessment, pest density, plant phenology, etc. These guarantee standardization, timeliness, reliability, and regional representativeness of phytosanitary and productive data of the target crop. The Apps were developed for the Android® operating system (version 5 or higher for coffee and 6 - 8 for agave), articulated with web technologies and back-end programming languages (PHP, Nodejs, etc.) to generate web services for registering-sending data. They use relational databases with MySQL as the primary manager. Both Apps were extensively validated before ESS implementation, requiring adaptation for compatibility between mobile systems, automatic geographical verification of geopositioning, record retrieval, local historicity of data, etc.
These Apps are developed with a multifunctional, multivariate and multipest modular structure. App-SIVEA also allows the generation of epidemiological pre-alertsin situ. The metadata feed algorithms in the PVEF-Cafeto and SIVEA web platforms to generate preventive alerts of phytosanitary risks at a regional and sub-regional level for decision-making. The use of this type of Apps requires training, and they are for the exclusive use of accredited users. Other Apps for phytosanitary purposes can be generic and free to use. CP-LANREF App-Monitor v. 4.0 was designed to support non-extensive epidemiological diagnoses. It allows setting the scale to assess pest(s) damage and plant vigor, evaluate up to five pests of interest, and register the host plant species. The data generated is compatible with MS Excel format and can be exported from different tools such as e-mail, Bluetooth, and others. This App can also be downloaded from Play Store.
After exhaustive validation under real conditions, the digital technology and support research results should be transferred to end-user directly on the field to assure data quality and adoption of theholistic-systemicphilosophy explicit on the scientific-technological innovation. Such transference must include the implemented institutional and operative innovation models implying directives, protocols, functional roles, and programmed goals. Effective human talent management is fundamental for ESS type 3 success (Figure 2 and 3).
Algorithms applicability to metadata management and analyses
ESS type 3 requires integrating quantitative strategies to establish or support preventiveandprotectiveactionability criteria in pest management (Coria-Contreras et al., 2019; Acevedo-Sanchezet al., 2017; Acevedo-Sanchez and Mora-Aguilera., 2016; Mora Aguileraet al., 2015a,b; Mora-Aguileraet al., 2014e). ES types 1 and 2 often rely on normative qualitative decisions (i.e., present/absent pest). In web-based ESS, quantitative strategies must generate solutions or algorithms programmable to automate the management and analyses of big structured data in real-time. In this context, a computer program is lines of code in a language suitable for the web environment, such as PHP, that solves a specific problem of graphical visualization, generating automatic reports with descriptive analysis, and calculating actionability criteria define an algorithm (Figure 5A). An intuitive approach to generating algorithms has been usingempirical deterministicorstochastic modelsrecurrent in classical epidemiology. For example, to solve the question: What is the incidence of disease-yat time-t?, the following algorithm was generated using a stochastic or probabilistic model: = 20.92 + 0.28x 1 -0.20x 2 -0.005x 3 + 0.09x 4 + 0.02x 5 + 0.05x 6 . Wherex 1 -x 6 are climate variables measured with specialized equipment (Kuanget al.,2012). In this case and others, using measurements of variables associated with a real problem determines theempiricalnature of the model (Coria-Contreras et al., 2019; Coria-Contreras et al., 2015b), as opposed to atheoretical modelbased on preconceived assumptions (Parnellet al., 2017). Estimating parameters (e.g., 20.92, 0.28, etc.) with statistical assumptions establishes its stochastic character. With a systemic web ESS based on big structured data, in addition to this type ofnumerical algorithms, a set ofrelational algorithmsis required, that is, those that allow relating categories of metadata for big data management (Mora-Aguileraet al., 2014d).
Effective data management through user-defined multi-criteria options acquires powerful relevance in visualizing interrelationships amongepidemiological systemcomponents and understanding its effect on pest intensity changes in time and space. The transference of web-based ESS to end-users with different technical profiles has shown thatrelational algorithmsbetter understand functional interrelationships among variables and provide the epidemiological bases to comprehend actionability criteria (CP-LAREF. Unpublished). For example, graphically observing the numerical progression of young coffee leaves (Plant subsystem) concerning the number of leaves with lesions caused byH.vastatrix(Pathogen subsystem) allows us to understand the relationship between susceptible tissue and inoculum availability to trigger an infective process. The algorithms that enable this are predominantlyrelationaland are conditioned to the proper and planned selection of variables, frequency, and spatial distribution of measurements. ESS support research provides this kind of information (Mendoza-Ramoset al., 2021; López-Bautistaet al., 2020; Acevedo-Sánchez and Mora-Aguilera, 2016; Mora-Aguileraet al., 2016b; Mendoza-Ramoset al., 2015a, b). Logically, anumerical algorithmmust also be programmed to automate decision rules. However, its origin and conception were part of quantitative modeling (Coria-Contreraset al., 2019; Kuanget al., 2012).
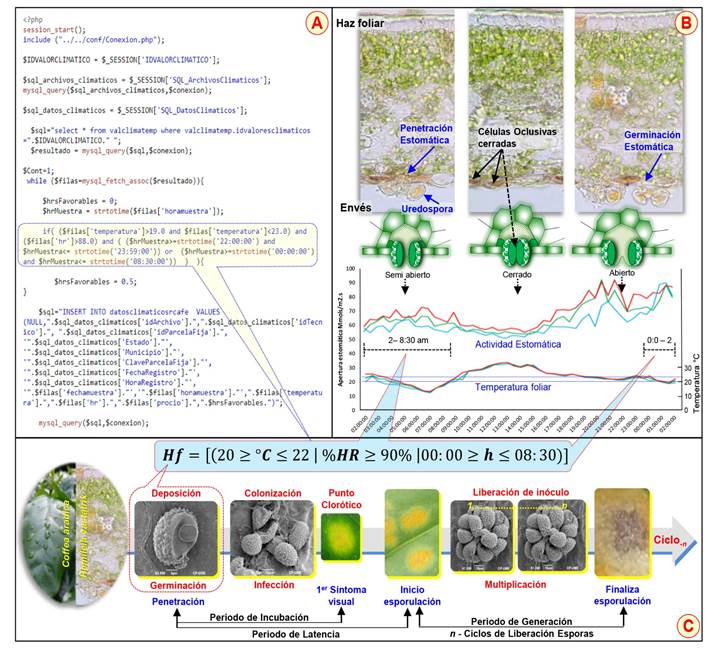
Figure 5 Web programming in PHP to calculate the number of favorable hours (FH), a dynamic numerical algorithm, for spore germination of H. vastatrix applicable in early warning of regional outbreaks of coffee rust. The framed sec tion refers to the programming code specific to the numeric function in the blue box (A). Stomata activity and leaf temperature in C. arabica var. Caturra used to define the range of hours (h) (0-8: 30) of open stoma to count hours of temperature (°C) and relative humidity (RH) suitable for germination (B). Pathogenesis cycle of H. vastatrix. The red dotted box indicates the phase selected for infection risk estimations (C).
These algorithms are critical in the automation of web-based ESS type 3 due to their direct link with the criterion(s) of actionability or epidemiological alerts. Note that field data, even more acute with real-time transfer with ESS Apps, are dynamic by their very nature. Nevertheless, this is not necessarily represented by thenumerical algorithm. These can bedynamic or staticin terms of their numerical structure or due to parameter calculation. Adynamicor ‘intelligent’numerical algorithmis mainly based onepidemic indicesthat are desirable due to their sensitivity to detect spatio-temporal changes without depending on absolute parameters, which is the case of astatic numerical algorithm. These, in general, has a local application and is temporally restricted (i.e.,βiof a model like the one previously described in the form= βo + β i x i + ε). In PVEF-Cafeto, 20 algorithms based onepidemic indicesandindicatorswere programmed. For example, the algorithm for calculating the number of hours favorable forH. vastatrixinfection was based on specific temperature (20-22 °C) and relative humidity (> 90%) exhibited between 0:00 and 8:30 a.m. (Santana-Peñaloza,et al.2015) (Figure 5). These conditions constitute functional biological ranges associated with spore germination and stomata penetration of the fungus (Figure 5B). Such “early” events of the pathogenesis are suitable for purpose of alerts regarding infection risks (Figure 5B, C). The mechanistic understanding of this process implied determining the pathogenesis cycle, complemented with lesion expansion / uredospore density, in different coffee varieties and thermal regimes (Figure 5C). Additionally, studies were carried out with scanning electron (JSM 6390) and light (40x Carl Zeiss) microscopy to determine the uresdospore aerodynamic morphology, its germination process and the stomata density in field plant material (Figure 5B). Thus, Figure 5B shows, in transverse foliar sections of C. arabica var. Bourbon, the stomata penetration of the germ tube of the fungus. The graph shows the effective stomata opening hours in var. Caturra (Handheld SC-1 Leaf Porometer) in young (blue line), mature (green) and old (red) leaves in order to specify the leaf-age most receptive to penetration / infection (CP-LANREF. Not Published). This type of research demonstrates the scientific foundation required to support an actionability algorithm. The holistic-systemic ESS cannot be intuitive and requires comprehensive research according to the region where it is intended. The automatic result of this algorithm is graphically displayed in the PVEF-Cafeto web interface in the next section.
PVEF-Cafeto did not include any algorithm developed with classical epidemiological models or general probabilistic models based on temporal incidence trends (Mora-Aguileraet al., 2016b; Mora-Aguileraet al., 2015a; Mora-Aguileraet al., 2014e). In contrast, in ESS agave (Table 1), subregional algorithms obtained from an exhaustive analysis of regional historical data using multiple regression models adjusted with SAS (Statistical Analyzes System) were programmed for the calculation of agave weevil infestations (Scyphophorus acupunctatus,Coleoptera: Curculionidae). The relational for this stochastic modeling was the steady temporal density peaks and local pest spreading (CP-LANREF. Not published). Thus, such an approach is not recommended for highly sensible pests to slight variations on theepidemiological system, as inH. vastatrix-C. arabica(Coria-Contreraset al., 2015b). However, if this approach is required, statistical adjustment of these models can be carried out directly in special web modules, which allows streamlining the temporal recalculation of these algorithms (Kuanget al.,2012). As in the coffee ESS, in agave,dynamic numerical algorithmswere also included.
Consequently, a web-based ESS is not restrictive in type and number of algorithms. Instead, depending on the systemic complexity of the phytosanitary problem (Figure 2). Another type of algorithms with great potential in web-based ESS, mainly with big structured data, is derived fromautomated machine learningwith two main trends: support vector machinesandartificial neural networks (Kaundalet al., 2006). However, the use of these algorithms has been limited and oriented mainly to disease diagnosis and severity assessments (Golhaniet al.,2018; Maet al., 2018).
In theholistic-systemicconception, a web-based ESS can be conceived as a complex system ofdynamic modeling programmingwhere time and space are included in the intrinsic calculations ofn-numericalandn-relationalalgorithms. It allows to understand and analyze interactions among variables and subsystems of theepidemiological systemin addition to automatic outputs of early risk alerts or forecasts for regional decision making (Figure 1, 4, and 5).
Epidemiological Surveillance System type 3 applied to coffee rust
Epidemic increase ofHemileia vastatrix. The causal agent of coffee rust, H. vastatrix, was detected in the 1980’s in Mexico. The fungus was established in coffee-growing areas at a sub-endemic level without economic consequences (SENASICA, 2016). However, between 2007 and 2012, the increase in epidemic intensity in Central America and southeastern Mexico alerted the productive coffee sector and NPPOs. In 2012, a regional epidemiological diagnosis evidenced the socioeconomic risk due to the distribution, incidence, and severity of the disease; predominant inventory ofCoffea arabica varieties susceptible to the fungus; and plantations aged over 20 years with limited agronomic management in an estimated 639,000 ha (SIAP, 2018; Acevedo-Sánchezet al.,2015). With these backgrounds, the Directorate General of Plant Health (DGSV in Spanish) and the Laboratory for Analysis of Phytosanitary Epidemiological Risk of COLPOS (CP-LANREF) conceived a type 3 web-based ESS which was called Program for the Epidemiological and Phytosanitary Surveillance of Coffee (PVEF-Cafeto, in Spanish). The Program was established in 2013 with a strategy of gradual coverage to all coffee growing areas (Mora-Aguileraet al., 2014d). The objectives of the PVEF-Cafeto were: A) Develop a web-based ESS that would allow precision and real-time information on the epidemic status of coffee rust, climatic inductivity, phenology dynamics, and productive management; B) Generate regional models for epidemic risk alerts and epidemiological indicators to designpreventiveandprotectiveaction strategies for decision-makers at the federal, state, and productive levels; and (C) Gradually incorporaten-pests of the coffee plant of quarantine and economic importance to support aholistic-systemicphytosanitary model with the plant (crop) as the integrating axis of a novel epidemiology system (Figure 1).
Characteristics of the PVEF-Cafeto. The PVEF-Cafeto is a web-based ESS type 3, designed to automate risk management, analysis, and communication processes in a web environment (Mora-Aguileraet al., 2015a, b; Coria-Contreraset al.,2015a; Mora-Aguileraet al., 2014d). The classic paradigm of monitoring specific pests was transformed into an integrative andholistic-systemicone based on a novelepidemiological systemwith the plant as the production and phytosanitary process (Figure 1 and 6). The ESS was conceived to mitigate the potential impact of coffee rust with predominantlypreventiveregional actions. The PVEF-Cafeto web architecture is multi-modular with public and private access interfaces (Figure 7 and 8).
Public and private web access. The public interface reveals the operational status of the surveillance in real-time (Figure 7A) and the epidemic status of rust through official reports and weekly phytosanitary alerts (Figure 7B). Similarly, protocols, methodological videos, and operational manuals can be freely consulted. This enables technical audits and the eventual harmonization of the ESS with other NPPOs (Figure 7C). The private interface allows accredited users to view automatic subregional maps and graphs with the highest epidemic risk in an period-i or configure queries generating specific spatial and/or temporal outputs.
Surveillance Instruments in private section: Maps. Figure 8 illustrates theSurveillance Instrumentsmodule, which automatically shows spatially thePhytosanitary Conditionof Veracruz, one of the most important Mexican coffee states, with municipal divisions colored by the level of damage caused by coffee rust on a scale of 0 - 70% (Classes) (Figure 8A). The lack of orange or red color indicates that there are no subregions that require mitigation actions in the current stage of the production cycle since the maximum average severity range was 4 - 15%. Areas that require and implement rust mitigation can be viewed in theRCAoption (Regional Control Areas). The correct box is a pest selector that changes the map accordingly (Figure 8A). Other custom options are shown in the top menu.
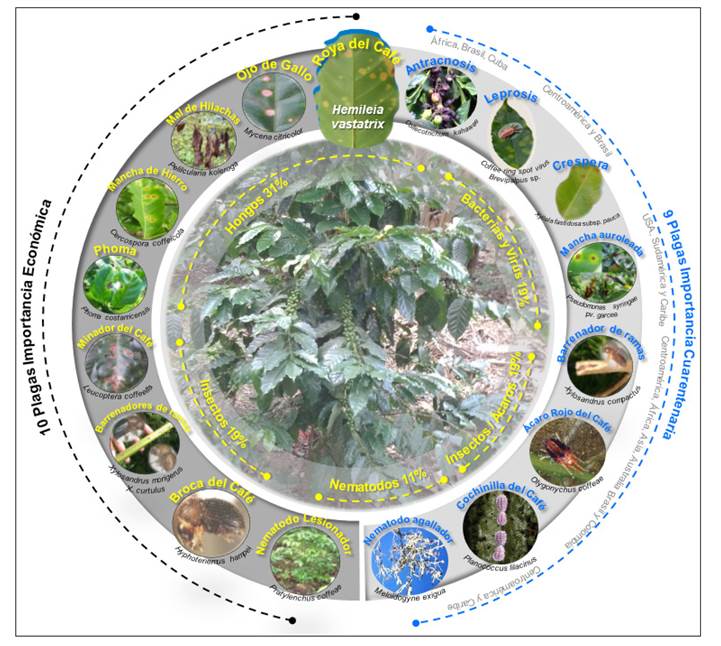
Figure 6 Plant - Pest subsystems associated with PVEF-Cafeto (Figure 7). The coffee Plant constitutes the axis of phytosani tary integration, and the center of the novel Epidemiological System proponed for ESS type 3 (Figure 1). Blue outer dotted line highlights pests of quarantine importance of interest to Mexico. The black dotted line highlights preva lent pests of economic importance. PVEF-Cafeto allows surveillance of epidemic intensity changes / incursion of pathogens, nematodes, insects and mites according to a holistic-systemic ESS approach applied to pest prevention and protection.
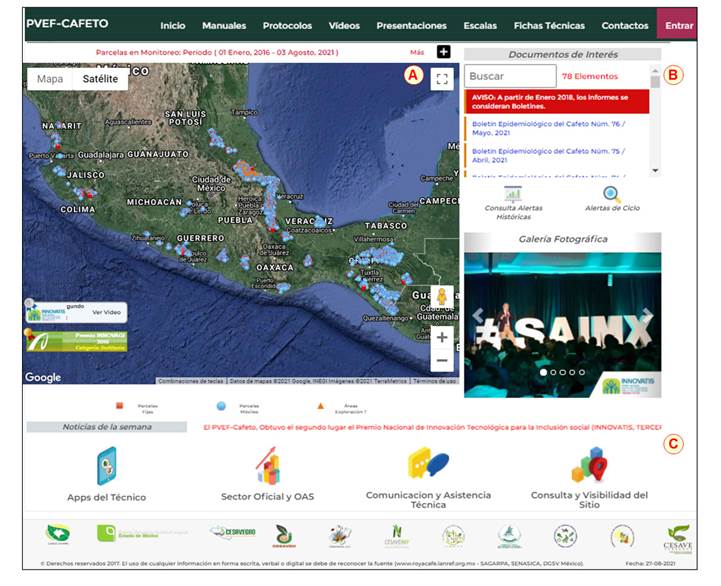
Figure 7 Web interface for viewing information of public interest from the Coffee Epidemiological Surveillance Program (PVEF-Cafeto). Section shows real-time synchronic sampling status (blue points) and monitoring (red points) of coffee pests (Figure 6). The user can customize the map with options of the menu ‘Mas +’ (A). Query section for risk communication releases: Epidemiological bulletins and phytosanitary alerts. Some informational elements of operational, methodological, and phytosanitary nature are indicated in lower dynamic boxes (B). Specialized sec tion for those responsible for sampling and monitoring in the field, ONPF’s officials, and accredited researchers (C).
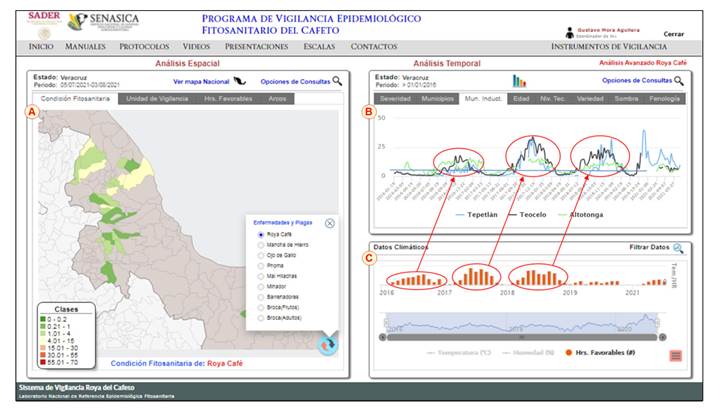
Figure 8 Web interface for private consultation of advanced modules for automated epidemiological analyses in PVEF-Cafeto. The Surveillance Instruments module is displayed. Spatial section with custom space-time, pest type, and damage scale query options to generate state or national risk-prevalence maps (A). Temporal section has options for analogous queries (B) and the Temporal section of climate monitoring for calculating inductivity algorithms (C), (Figure 5). Other general menu explanations on Figure 7.
Surveillance Instruments in private section: Temporal dynamics. In Figure 8B, the municipalities of Veracruz that are most inductive to coffee rust (Tepetlán, Teocelo, and Altotonga) at the current stage of the production cycle are automatically shown with temporal traceability to previous cycles (2016-2021). The red bars in the lower box represent at weekly/month interval thenumber of favorable hours(FH) forH.vastatrixinfection associated with the epidemic process of the most inductive municipality (Teocelo) (Figure 8C), automatically calculated with adynamic numerical algorithm(Figure 5). Below FH bars, actual continuous temperature and relative humidity (blue line) can also be exhibited upon selection. This climatic data is obtained from coffee field sensors strategically distributed in a subregion. Ellipses and superimposed red arrows represent the exploratory association of differential inductive epidemic effect of a sustained interval of FH between May and August, with an increase in rust severity in Teocelo between August and late December (maximum), in three coffee productive cycles. The time lag represents the effect of incubation and latency period (lag) on the fungus infection (Figure 5). Data and graphs can be exported to generate user customize reports.
Analytical algorithms. Descriptive analyses are automatically generated withrelational algorithmsand allow for online epidemiological diagnoses and advanced reports. Rust alerts, at weekly intervals, are intended to determine differentiated risks, at the municipality level, in the formation of regional foci; typify the epidemic process as anearlyorlatefocus, or asan activeepidemic (regional dispersion); and define the actionability criteria for mitigation withpreventiveorprotectiveproducts previously evaluated (Mendoza-Ramoset al., 2015b). Risk analyses, also automated, are generated withdynamic quantitative algorithms(Figure 5).
Continuous innovation. PVEF-Cafeto, an ESS type 3, had a dynamic and continuous scientific-technological innovation. Thus, as examples, algorithm adjustments were made for the gradual integration of 10 pests of economic importance and nine under quarantine to monitor a total of 19 pests (Figure 6). A regional monitoring module of varietal resistance toH. vastatrixwas integrated, and the module to calculate favorable hours of climatic inductivity was optimized to includen-pests, such as the coffee berry borerHypothenemus hampei(Coleoptera: Scolytinae). These pests can also be analyzed online with criteria analogous to rust. A PVEF-Cafeto multi-pest conferred integrality technological, optimized general resources, and was highly influential in the traceability of phytosanitary risks.
Implementation and operability. PVEF-Cafeto operated from 2013 to 2019 through duly trained technical personnel from the Plant Health State Committees (CESV in Spanish), contributing to the NPPO. It ended once the coffee rust problem was regionally mitigated in 11 coffee-producing states, but it keeps its historical databases on the webserver. It included a total of 240 municipalities selected with criteria of epidemic inductivity (Acevedo-Sánchezet al., 2016), which represented 85% of the country’s coffee-growing area. The management of regional foci of rust showed its effectiveness by gradually reducing the leaf severity and prevalence regarding the 2013 outbreak (Acevedo-Sánchezet al., 2015), reaching since 2017 low epidemic intensity levels. Thus the state average in June 2017 exhibited 8% plant severity and 5% leaf severity. Subregionally (municipality), there was 20% (± 8%) of average plant severity and 6% (± 3%) of leaf severity. The epidemic trends of the most inductive municipalities, in general, remained constant with low levels (severity <5%). No additional pests had actionable risk levels, and any pests of quarantine interest were detected during the referred period. However, the digital architecture and operational model of PVEF-Cafeto allows its rapid reactivation (1-3 months) in the event of any phytosanitary emergency. Thus, from the 2020 production cycle to the present, PVEF-Cafeto operates for preventive purposes in Veracruz with 12 technicians attached to the CESV and the technical-scientific support from CP-LANREF. The PVEF-Cafeto has structured big phytosanitary data with 15,773,140 records comprised of 199,660 field evaluations, including pest damage, phenology, and agronomical managements weekly/biweekly intervals; and 87,469,624 climatic records from Temperature / RH sensors establishedin situ.This big structured data is the basis for phytosanitary management in time-space, establishing actionable criteria and generating phytosanitary alerts at different time horizons (Figure 7 and 8). PVEF-Cafeto was awarded for its technological-scientific innovation by the National Council of Science and Technology of Mexico CONACYT (INNOVATIS 2018) and the Inter-American Institute for Cooperation in Agriculture IICA (INNOVAGRO, 2016).
Perspectives
In itsholistic-systemicconception, epidemiological surveillance represents the future of plant health applied to risk mitigation. The speed of epidemic processes at a global level has escalated in time and space. Classic field management is becoming less efficient and profitable in environmental terms and productive assets, forcing regional strategies. Mobility and increased pest density pressure due to productive and commercial activities, human passage, variability, and climate change (Mendoza-Ramoset al.,2021; López-Bautistaet al.,2020; Carbajal-Yepezet al., 2019; Parnellet al., 2017; Mora Aguileraet al.,2014a, b, c), as well as the social demand for safe food production, lower carbon footprint and traceability of the environmental impact, will constitute the complex operational phytosanitary framework. Web-based ESS type 3, due to itsholistic-systemicconception, support in decision algorithms, and predominantly preventivepurpose, embraces the most suitable option to face these challenges. Type 1 and 2 epidemiological surveillance will continue in force but with an impact limited to the regulatory framework. Advances in digital technology have revolutionized the acquisition, management, and use of phytosanitary data, enabling the development and implementation of web-based ESS applied to regional management of phytosanitary risks (Coria-Contreraset al.,2019; Mora Aguileraet al., 2014d). The optimization, harmonization, and quality indicators of all the processes intrinsic to a comprehensive ESS are equally feasible (Acevedo-Sanchezet al., 2017; Guzmán-Hernándezet al., 2017). However, the perspectives will be limited by classical scientific views, fragmented production models, and traditional phytosanitary policies. The adoption of new phytosanitary paradigms and scientific-technological innovation will determine the future ofholistic-systemicESS. For instance, classical epidemiology focused on studies at limited farm production units; theepidemiological triangleortetrahedronadoption; and the conception of damage dependent solely on infectious processes constitute restritive premises that are not compatible with an ESS focused on crop health in the broad productive sense.
Conclusions
In 1975, Krause and collaborators predicted that:‘The future in plant disease prediction will perhaps be centralized national, regional, or state facilities, equipped with data processing machinery linked to remote data acquisition units. These facilities could monitor environmental parameters and process data for diseases, pests, and growing conditions on many crops. Such a network could make disease predictions, issue warnings, and perhaps make definitive disease control recommendations as they are necessary’. Spurred on by the digital revolution, this foresight has been clearly demonstrated. Successful web-based ESS type 3 cases operated by NPPOs, RPPOs, and producer associations have shown the assertiveness of space-scaled digital phytosanitary management. However, strong scientific-technological innovation challenges still prevail with pertinent normative and operational frameworks. Due to itsholistic-systemicandpreventivenature, a web-based ESS type 3 emphasizes the crop’s health under a sustainable and resilient approach. Theprotectionprinciple as understood with the classical view of intervening an epidemic to decrease its intensity, i.e., its epidemic rate, is subordinated to thepreventiveprinciple optimized through economic-biological decision thresholds. Digital technology is a vital component of innovation, but it does not define the success of an Epidemiological Surveillance Program. Theholistic-systemicepidemiological conception of the phytosanitary problem focused on the crop’s health, understood and validated in the field by interdisciplinary teams, determines the applicability and relevance of a comprehensive ESS.
Acknowledgments
To the Directorate General of Plant Health of SENASICA for the financial support to develop and provide the technical-scientific support to PVEF-Cafeto. To the technical staff of the State Plant Health Committees of Chiapas, Puebla, Veracruz, SLP, Guerrero, Colima, Nayarit, Oaxaca, Hidalgo, Querétaro, Jalisco and Edo. de Mexico, for their professionalism and commitment in the operation of the PVEF-Cafeto. And to Miranda Mora for her assistance on the English translation. To coffee producers who, without any restriction, allowed access to their properties. To COLPOS to support the execution of PVEF-Cafeto project.
REFERENCES
Aanensen DM, Huntley DM, Feil EJ, al-Own FA and Spratt BG. 2009. EpiCollect: Linking smartphones to web applications for epidemiology, ecology and community data collection. Plos one 4(9): e6968. https://doi.org/10.1371/journal.pone.0006968 [ Links ]
Acevedo-Sánchez G, Santana-Peñaloza B, López-Bautista V, Martínez-Bustamante V, Coria-Contreras J, Mendoza-Ramos C, Jiménez-González L y Mora-Aguilera G. 2017. Criterios epidemiológicos para implementar una red de monitoreo de enfermedades causadas por Fusarium spp. en regiones agaveras de Jalisco. Revista Mexicana de Fitopatología 35S: 176-177. http://rmf.smf.org.mx/suplemento/Suplemento352017.html [ Links ]
Acevedo-Sánchez G y Mora-Aguilera G. 2016. Desarrollo de REG-N Café v1.0 para determinar n-sitios de monitoreo-muestreo regional de roya del cafeto en México usando criterios epidemiológicos ponderados. In. 49º Congresso Brasileiro de Fitopatologia. 29 agosto-01 septiembre. Alagoas, Maceio, Brasil. [ Links ]
Acevedo-Sánchez G, Mora-Aguilera G, Coria-Contreras JJ, López-Muratalla Y, González-Gómez R y López-Buenfil A. 2015. Vulnerabilidad epidemiológica, productiva y socioeconómica en la cadena productiva del cafeto en Chiapas, Veracruz y Puebla. Revista Mexicana de Fitopatología 33S: 120. http://rmf.smf.org.mx/suplemento/Suplemento332015.html [ Links ]
Carvajal-Yepes M, Cardwell K, Nelson A, Garrett KA, Giovani B, Saunders DGO, Kamoun S, Legg JP, Verdier V, Lessel J, Neher RA, Day R, Pardey P, Gullino ML, Records AR, Bextine B, Leach JE, Staiger S and Tohme J. 2019. A global surveillance system for crop diseases. Science 364(6447): 1237-1239. https://doi.org/10.1126/science.aaw1572 [ Links ]
Casacuberta D. 2013. Innovación, big data y epidemiología. Revista Iberoamericana de Argumentación 7: 1-12. https://revistas.uam.es/ria/article/view/8176/8515 [ Links ]
Chiavegatto ADP. 2015. Uso de big data em saúde no Brasil: perspectivas para um futuro próximo. Epidemiologia e Serviços de Saúde 24(2): 325-332. https://doi.org/10.5123/S1679-49742015000200015 [ Links ]
Coakley SM, McDaniel LR and Shaner G. 1985. Model for predicting severity of Septoria tritici blotch on winter wheat. Phytopathology 75: 1245-1251. https://www.apsnet.org/publications/phytopathology/backissues/Documents/1985Articles/Phyto75n11_1245.PDF [ Links ]
Coria-Contreras JJ, Mora-Aguilera G, Yañez-Morales MJ, Acevedo-Sánchez G, Santana-Peñaloza B, Mendoza-Ramos C, Jiménez-González L, Martínez-Bustamante VI, García-Martínez DC and Rubio-Cortés R. 2019. Applied regional epidemiology to inductive characterization and forecasting of blue agave gray spot (Cercospora agavicola) in Jalisco, Mexico. Mexican Journal of Phytopathology 37(1): 71-94. http://doi.org/10.18781/R.MEX.FIT.1809-4 [ Links ]
Coria-Contreras JJ, Acevedo-Sánchez G, Mendoza-Ramos C, Jiménez-González L y Mora-Aguilera G. 2015a. APLI-K v1.0: Sistema automatizado para la planeación de aplicación de productos químicos contra roya del cafeto (Hemileia vastatrix). Revista Mexicana de Fitopatología 33S: 121. https://www.smf.org.mx/rmf/suplemento/docs/Volumen332015/Suplemento332015FULL.pdf [ Links ]
Coria-Contreras JJ, Acevedo-Sánchez G, Mora-Aguilera G y Martínez-Bolaños M. 2015b. Modelos de pronóstico de ocurrencia regional de la roya del cafeto (Hemileia vastatrix) en el Soconusco Chiapas. Revista Mexicana de Fitopatología 33S: 121. https://www.smf.org.mx/rmf/suplemento/docs/Volumen332015/Suplemento332015FULL.pdf [ Links ]
De Wolf ED and Isard SA. 2007. Disease cycle approach to plant disease prediction. Annual Review of Phytopathology 45: 203-220. https://doi.org/10.1146/annurev.phyto.44.070505.143329 [ Links ]
Drew DA, Nguyen LH, Steves CJ, Menni C, Freydin M, Varsavsky T, Sudre CH, Cardoso MJ, Ourselin S, Wolf J, Spector TD, Chan AT and Consortium C. 2020. Rapid implementation of mobile technology for real-time epidemiology of COVID-19. Science 368: 1362-1367. https://doi.org/10.1126/science.abc0473 [ Links ]
Firanj Sremac A, Lalić B, Marčić M and Dekić L. 2018. Toward a weather-based forecasting system for fire blight and downy mildew. Atmosphere 9(12): 1-17. https://doi.org/10.3390/atmos9120484 [ Links ]
Flores-Sánchez JL, Mora-Aguilera G, Loeza-Kukc E, López-Arroyo JI, Gutiérrez-Espinosa MA, Velázquez-Monreal JJ, Domínguez-Monge S, Bassanezi RB, Acevedo-Sánchez G and Robles-García P. 2017. Diffusion model for describing the regional spread of Huanlongbing from first-reported outbreaks and basing an area wide disease management strategy. Plant Disease 101: 1119-112. https://doi.org/10.1094/PDIS-04-16-0418-RE [ Links ]
Golhani K, Balasundram SK, Vadamalai G and Pradhan B. 2018. A review of neural networks in plant disease detection using hyperspectral data. Information Processing in Agriculture 5(3): 354-37. https://doi.org/10.1016/j.inpa.2018.05.002 [ Links ]
Guzmán-Hernández E, Flores-Colorado O, Acevedo-Sánchez G, Mora-Aguilera G, López-Javier MA y González-Gómez R. 2017. Apps como herramientas de soporte epidemiológico aplicado a sistemas regionales de vigilancia epidemiológica. Revista Mexicana de Fitopatología 35S: 184. https://www.smf.org.mx/rmf/suplemento/docs/Volumen352017/VOLUMEN_35_SUPLEMENTO_2017.pdf [ Links ]
Huber L and Gillespie TJ. 1992. Modeling leaf wetness in relation to plant disease epidemiology. Annual Review of Phytopathology 30: 553-577. https://www.annualreviews.org/doi/pdf/10.1146/annurev.py.30.090192.003005 [ Links ]
Kang WS, Hong SS, Han YK, Kim KR, Kim SG and Park EW. 2010. A web-based information system for plant disease forecast based on weather data at high spatial resolution. The Plant Pathology Journal 26(1): 37-48. https://doi.org/10.5423/PPJ.2010.26.1.037 [ Links ]
Kaundal R, Kapoor AS and Raghava GPS. 2006. Machine learning techniques in disease forecasting: a case study on rice blast prediction. BMC Bioinformatics 7:485. https://doi.org/10.1186/1471-2105-7-485 [ Links ]
Kim HS, Do KS, Park JH, Kang WS, Lee YH and Park EW. 2020. Application of numerical weather prediction data to estimate infection risk of bacterial grain rot of rice in Korea. Plant Pathology Journal 36(1): 54-66. https://doi.org/10.5423/PPJ.OA.11.2019.0281 [ Links ]
Krause RA, Massie LB and Hyre RA. 1975. Blitecast: a computer forecast of potato late blight. Plant Disease Reporter 59(2): 95-98. https://babel.hathitrust.org/cgi/pt?id=chi.23661187&view=1up&seq=112 [ Links ]
Kuang W, Liu W, Ma Z and Wang H. 2012. Development of a web-based prediction system for wheat stripe rust. Pp. 324-335. In: 6th Computer and Computing Technologies in Agriculture (CCTA), Oct 2012, Zhangjiajie, China. https://hal.inria.fr/hal-01348115/document [ Links ]
López-Bautista V, Mora-Aguilera G, Gutiérrez-Espinosa MA, Mendoza-Ramos C, Martínez-Bustamante VI, Coria-Contreras JJ, Acevedo-Sánchez G and Santana-Peñaloza B. 2020. Morphological and molecular characterization of Fusarium spp. associated to the regional occurrence of wilt and dry bud rot in Agave tequilana. Mexican Journal of Phytopathology 38(1): 79-106. http://www.scielo.org.mx/scielo.php?pid=S0185-33092020000100105&script=sci_arttext&tlng=en [ Links ]
Ma J, Du K, Zheng F, Zhang L, Gong Z and Sun Z. 2018. A recognition method for cucumber diseases using leaf symptom images based on deep convolutional neural network. Computers and Electronics in Agriculture 154: 18-24. https://doi.org/10.1016/j.compag.2018.08.048 [ Links ]
Madden L, Pennypacker SP and MacNab AA. 1978. FAST, a forecast system for Alternaria solani on tomato. Phytopathology 68: 1354-1358. https://www.apsnet.org/publications/phytopathology/backissues/Documents/1978Articles/Phyto68n09_1354.pdf [ Links ]
Magarey RD and Isard SA. 2017. A Troubleshooting guide for mechanistic plant pest forecast models. Journal of Integrated Pest Management 8(1): 1-7 https://doi.org/10.1093/jipm/pmw015 [ Links ]
Mendoza-Ramos C, Mora-Aguilera G, Coria-Contreras JJ, Santana-Peñaloza B, Acevedo-Sánchez G, Martínez-Bustamante V, Gutiérrez-Espinosa MA and Rubio-Cortés R. 2021. Fusarium spp. and inoculum load estimation associated to commercial Agave tequilana offsets at different regional epidemic inductivity levels. Mexican Journal of Phytopathology 39(1): 94-121. http://www.scielo.org.mx/pdf/rmfi/v39n1/2007-8080-rmfi-39-01-94-en.pdf [ Links ]
Mendoza-Ramos C, Jiménez-González L, Coria-Contreras JJ, Acevedo-Sánchez G y Mora-Aguilera G. 2015a. Comportamiento aerobiológico de esporas de Hemileia vastatrix en la región nororiental de Puebla-Veracruz. Revista Mexicana de Fitopatología 33S: 238. https://www.smf.org.mx/rmf/suplemento/docs/Volumen332015/Suplemento332015FULL.pdf [ Links ]
Mendoza-Ramos C, Jiménez-González LR, Coria-Contreras JJ, Acevedo-Sánchez G, Santana-Peñaloza B, Martínez-Bolaños M y Mora-Aguilera G. 2015b. Efecto de ingrediente activo y dosis en la esporulación y expansión de lesión de Hemileia vastatrix. Revista Mexicana de Fitopatología 33S: 135. https://www.smf.org.mx/rmf/suplemento/docs/Volumen332015/Suplemento332015FULL.pdf [ Links ]
Mora-Aguilera G, Cortez-Madrigal H and Acevedo-Sánchez G. 2017. Epidemiology of entomopathogens: Basis for rational use of microbial control of insects. Southwestern Entomologist 42(1): 153-169. https://doi.org/10.3958/059.042.0116 [ Links ]
Mora-Aguilera G, Acevedo-Sánchez G, Guzmán-Hernández E, Coria-Contreras JJ, Mendoza-Ramos C, Jiménez-González L, Santana-Peñaloza B, González-Gómez R, López-Buenfil A, López-Javier M y Carranza P. 2016a. Criterios epidemiológicos de accionabilidad regional para control de la roya del cafeto en México. Revista Mexicana de Fitopatología 34S: 23. https://www.smf.org.mx/rmf/suplemento/docs/Volumen342016/Suplemento_34_2016.pdf [ Links ]
Mora-Aguilera G, Coria-Contreras JJ, Martínez-Bolaños M, Acevedo-Sánchez G y Santana-Peñaloza B. 2016b. Gradientes regionales de dispersión de la roya del cafeto (Hemileia vastatrix) en el Soconusco, Chiapas, México. In. 49º Congresso Brasileiro de Fitopatología. 29 agosto - 01 septiembre. Alagoas, Maceio, Brasil. [ Links ]
Mora-Aguilera G, Acevedo-Sánchez G, Coria-Contreras J, González-Gómez R, López-Buenfil A y Javier-López MA. 2015a. Alertas tempranas regionales para manejo de focos de roya del cafeto en México. Revista Mexicana de Fitopatología 33S: 64. http://rmf.smf.org.mx/suplemento/Suplemento332015.html [ Links ]
Mora-Aguilera G, Acevedo-Sánchez G, Coria-Contreras JJ, López-Muratalla Y, López-Buenfil A y González-Gómez R. 2015b. C@FE-RISK v1.0: Simulador de riesgos regionales fitosanitarios, epidemiológicos y productivos en la cadena productiva del café en México. Revista Mexicana de Fitopatología 33S: 119. http://rmf.smf.org.mx/suplemento/Suplemento332015.html [ Links ]
Mora-Aguilera G, Acevedo-Sánchez G, Calderón-Estrada G, Flores-Sánchez J, Domínguez-Monje S, Baker P and González-Gómez R. 2014a. Epidemiological considerations of climate change on tropical crops health. Mexican Journal of Phytopathology 32(2): 147-167. http://www.scielo.org.mx/scielo.php?pid=S0185-33092014000200147&script=sci_arttext&tlng=en [ Links ]
Mora-Aguilera G, Flores-Sánchez F, Acevedo-Sánchez G, Domínguez-Monge S, Oropeza-Salin C, Flores-Olivas A, González-Gómez R and Robles-García P. 2014b. Epidemiological surveillance and current status of coconut lethal yellowing, potato purple top and citrus huanglongbing (HLB) in Mexico. Mexican Journal of Phytopathology 32(2): 120-131. https://www.researchgate.net/publication/300533174_Epidemiological_Surveillance_and_Current_Status_of_Coconut_Lethal_Yellowing_Potato_Purple_Top_and_Citrus_Huanglongbing_HLB_in_Mexico [ Links ]
Mora-Aguilera G, Robles-García P, López-Arroyo JL, Flores-Sánchez J, Acevedo-Sánchez G, Domínguez-Monge D and González-Gómez R. 2014c. Current situation and perspectives in management of citrus HLB. Mexican Journal of Phytopathology 32(2): 108-119. https://www.smf.org.mx/rmf/Vol3222014/AR/32-2_03.pdf [ Links ]
Mora-Aguilera G, Acevedo-Sánchez G, Domínguez-Monge D, Coria-Contreras JJ, Hernández-Hernández E, González-Gómez R, López-Buenfil A, Sánchez-Anguiano H, García-Feria J, Trujillo-Arriaga J, López-Pérez E, Méndez-Ramos A, Matuz-Conde J and Martínez-Bolaños M. 2014d. Epidemiological surveillance system for coffee rust disease (Hemileia vastatrix) in Mexico: A regional approach. In: The 25th International Conference on Coffee Science. 8-13 Septiembre. Armenia, Colombia. 1-6pp. https://www.researchgate.net/publication/306347540_Epidemiological_Surveillance_System_for_Coffee_Rust_Disease_Hemileia_vastatrix_in_Mexico_A_Regional_Approach [ Links ]
Mora-Aguilera G, Acevedo-Sánchez G, Flores-Sánchez J, Hernández R, González-Gómez R and Robles-García P. 2014e. Regional Epidemiology: A new frontier and challenge in plant pathology. In: Abstracts 47º Congresso Brasileiro de Fitopatología “Desafios Futuros”. 17-22 agosto. Londrina, Paraná, Brasil. https://www.researchgate.net/publication/301204091_Regional_Epidemiology_A_new_frontier_and_challenge_in_plant_pathology [ Links ]
Moschini RC, Carranza MR and Carmona MA. 2004. Meteorological-based predictions of wheat head blight epidemic in the southern Argentinean pampas region. Cereal Research Communications 32: 45-52. https://doi.org/10.1007/BF03543279 [ Links ]
Newlands NK. 2018. Model-based forecasting of agricultural crop disease risk at the regional scale, integrating airborne inoculum, environmental, and satellite-based monitoring data. Frontiers in Environmental Science 6: 1-16. https://doi.org/10.3389/fenvs.2018.00063 [ Links ]
Park EW, Seem RC, Gadoury DM and Pearson RC. 1997. DMCAST: a prediction model for grape downy mildew development. Viticulticulture and Enological Science 52: 182-89 https://www.researchgate.net/publication/258219975_DMCast_a_prediction_model_for_grape_downy_mildew_development [ Links ]
Parnell S, van den Bosch F, Gottwald T and Gilligan CA. 2017. Surveillance to inform control of emerging plant diseases: An epidemiological perspective. Annual Review of Phytopathology 55: 591-610. https://doi.org/10.1146/annurev-phyto-080516-035334 [ Links ]
Pethybridge SJ and Nelson SC. 2018. Estimate a new ipad application for assessment of plant disease severity using phothographic standard area diagrams. Plant Disease 102: 276-281. https://doi.org/10.1094/PDIS-07-17-1094-SR [ Links ]
Pethybridge SJ and Nelson SC. 2015. Leaf Doctor: A new portable application for quantifying plant disease severity. Plant Disease 99: 1310-1316. http://dx.doi.org/10.1094/PDIS-03-15-0319-RE [ Links ]
Rosa M, Genesio R, Gozzini B, Maracchi G and Orlandinic S. 1993. PLASMO: a computer program for grapevine downy mildew development forecasting. Computers and Electronics in Agriculture 9(3): 205-215. https://doi.org/10.1016/0168-1699(93)90039-4 [ Links ]
Santana-Peñaloza B, Acevedo-Sánchez G, Coria-Contreras JJ, Mora-Aguilera G, González-Gómez R y López-Buenfil A. 2015. CALCULA-HF v1.0: Estimación de horas favorables de inductividad epidémica debido a la germinación de uredosporas de Hemileia vastatrix. Revista Mexicana de Fitopatología 33S: 119. https://www.smf.org.mx/rmf/suplemento/docs/Volumen332015/Suplemento332015FULL.pdf [ Links ]
SENASICA. 2016. Roya del cafeto (Hemileia vastatrix Berkeley & Broome). Dirección General de Sanidad Vegetal. Programa de Vigilancia Epidemiológica Fitosanitaria. México, D.F. Ficha Técnica No. 40. 23 p. https://prod.senasica.gob.mx/SIRVEF/ContenidoPublico/Roya%20cafeto/Fichas%20tecnicas/Ficha%20T%C3%A9cnica%20de%20Roya%20del%20cafeto.pdf [ Links ]
SIAP (Servicio de Información Agrícola y Pesquera). 2018. Cierre de la producción agrícola por estados. http://www.siap.gob.mx/cierre-de-la-produccion-agricola-por-cultivo/ [ Links ]
Tsukahara RY, Marceli H and Canteri MG. 2008. Relationship between climate and the progress of the asian soybean rust (Phakopsora pachyrhizi) in two micro-regions of Paraná State. Ciências Agrárias 29: 47-52. https://www.redalyc.org/pdf/4457/445744087005.pdf [ Links ]
Received: April 30, 2021; Accepted: August 10, 2021
 Este es un artículo publicado en acceso abierto bajo una licencia Creative Commons
