


 text new page (beta)
 English (pdf)
 Article in xml format
 Article references
 Send this article by e-mail
 Cited by SciELO
  Similars in
SciELO
Similars in
SciELO 
 Permalink
1. INTRODUCTION
Korea is one of the major countries hit by the COVID-19 pandemic in early 2020, with the first case confirmed in January 2020. Infections rose quickly in February, but the spread of the virus was controlled successfully with the help of an effective containment strategy employed by the Korean government from February through March 2020 (Kim, 2020).
Meanwhile, real GDP has declined by 1.3% in 2020. Whilst Korea’s economic downfall started from falling consumption and exports in early 2020, recovery of exports and steady growth in investment in machinery and equipment have considerably offset consumption losses during the second half of 2020.
However, the economic impacts of the pandemic and partial economic recovery have been markedly disproportionate across different business sectors, workers, and households (Stiglitz, 2020; Taylor, 2020). Output growth rates in high-contact service sectors have been substantially lower than those in finance, high-tech, and export-oriented industries. Importantly, the sectors hit hard by the pandemic are the industries that pay relatively lower wages to their workers. The workers who have been mostly dismissed during the pandemic are those in non-standard, temporary labor arrangements. Even among non-standard workers, female workers with atypical employment types were the hardest-hit group. These patterns suggest that COVID-19 has struck the weakest spots of the Korean society, thereby intensifying the economic suffering of the most vulnerable firms, workers, and families.
This paper examines the main impacts of the pandemic on economic activity and discusses the policy implications from South Korea’s experience of the pandemic crisis. I will particularly focus on the unequal distribution of output, employment, and income shocks across different business sectors, workers, and households.
The COVID-19 pandemic has exacerbated pre-existing economic problems in Korea that have been developed since the Asian financial crisis of 1997-1998. These problems mainly include (1) a decreasing share of employment both in the manufacturing sector and financial services (the so-called FIRE sectors) notwithstanding continued growth in their output share in GDP; (2) the polarization of workers based on the employment types and worsening household income inequality; and (3) a surge of corporate saving in combination with rising corporate liquidity preferences.
The widening disparities that occurred in the current pandemic have important macroeconomic implications. First, the disproportionate employment and income impacts on the workers in relatively poorly paid industries and in non-standard employment arrangements tend to raise the household sector’s saving rate. Second, contrasting trends between output and employment in the manufacturing and fire industries and larger employment losses than output losses in the hardest-hit sectors during the pandemic could end up strengthening the business sectors’ saving rate, net lending, and their liquid financial asset investment, thereby adversely affecting aggregate demand. Third, policy measures thus far implemented in Korea have mostly supported big businesses and banks at the expense of the most vulnerable firms and people, therefore failing to curb the exacerbation of employment, income, and social inequalities.
Observing what has happened during the pandemic throughout 2020, worsening trends of income and wealth disparities across firms and households are less likely to be reversed to their pre-pandemic statuses. Therefore, I argue that the resulting sectoral uneven growth, income inequality, corporate liquidity preference could inhibit short-term recovery in the remaining period of the pandemic and exacerbate the pre-existing stagnation tendencies in Korea thereafter.
The implications of all of these patterns are evident. Supporting the weakest sectors and people so that the disparities of income and wealth do not get worse becomes especially vital for full recovery. Without well-designed government support programs and structural reforms that aim to reverse worsening trends of the income and wealth disparities across industries, employment, and households, the Korean economy could plunge into a much severe and prolonged recession after the pandemic. In this sense, our economic policy must not only be massive and well-targeted to protect the bottom-tier firms and families, but also provide more equitable social-economic visions for sustainable growth of the Korean and global economy.
The paper is divided into seven sections. Section 2 outlines South Korea’s aggregate demand, output, and employment growth in 2020. In particular, I will provide defining features of the output and employment structure in Korea. Sections 3 and 4 examine how the COVID-19 crisis has exacerbated the pre-existing dual economic structure in Korea across employment and families. Sections 5, 6, and 7 discuss the macroeconomic implications of the COVID-19 crisis by examining its disproportionate impacts on consumption, investment, and saving behavior of the private sectors in Korea. Section 8 outlines the main policy responses by the Korean government. The final section summarizes the economic implications of the pandemic.
2. THE IMPACTS ON THE ECONOMIC ACTIVITY OF THE COVID-19 CRISIS
In this section, I will outline the major changes in the components of aggregate demand and the structure of employment and output of the Korean economy in 2020.
2.1. Aggregate demand
In 2020, Korea’s real GDP has declined by 1.3%. To better understand key factors driving aggregate demand to change, I provide the relative importance of each component of GDP during the COVID-19 period. Table 1 shows the levels of GDP and its major components for each quarter in 2020 relative to their corresponding figures for the fourth quarter of 2019. It presents the direction and magnitude of changes in aggregate expenditures since the beginning of the COVID-19 crisis. As presented in the table, real GDP in the first quarter of 2020 stood at 98.7% of its pre-crisis level, continued to decline to 95.6% in the second quarter, and then it has partly recovered its pre-crisis level since the third quarter of 2020. Over a year, the Korean economy was eventually able to find its position at a 1.3 percentage point decline in real GDP.
Table 1 Real GDP, 2019Q4-2020Q4
| GDP indices (2019Q4 = 100) | |||||
|---|---|---|---|---|---|
| 2019Q4 | 2020Q1 | 2020Q2 | 2020Q3 | 2020Q4 | |
| Real GDP | 100 | 98.7 | 95.6 | 97.6 | 98.7 |
| Consumption | 100 | 93.5 | 94.9 | 94.9 | 93.4 |
| Private investment | 100 | 100.8 | 102.2 | 102.0 | 103.5 |
| - Machinery and equipment | 100 | 100.1 | 105.3 | 109.7 | 105.6 |
| - Intellectual products | 100 | 100.7 | 102.6 | 102.6 | 104.4 |
| Government expenditures | 100 | 100.8 | 99.6 | 98.3 | 99.7 |
| Exports | 100 | 98.6 | 82.8 | 96.0 | 101.0 |
Notes: Seasonally adjusted real GDP data at chained 2015-year price is retrieved from Statistics Korea. Real GDP and its components in 2020Q1-Q4 are normalized by their corresponding figures for 2019Q4.
Source: Bank of Korea, National Accounts and author’s calculations.
In Korea, the decline of economic activity mainly came from falling consumption and exports. First, although a complete lockdown has not been implemented, a drop in household consumption, especially during the first quarter of 2020, was a major contributor to the output reduction in 2020. Since 2020Q2, private consumption has stopped plummeting partly due to emergency income transfers to households along with successful containment of the virus spread, but fell again during the last quarter due to a resurge of COVID-19 infection cases. Second, falling exports during the first half of 2020 were another important driver to the GDP decrease. Exports fell to 82.8% of the pre-crisis level in 2020Q2 but bounced back to its pre-crisis level thereafter.
In contrast, relatively stable capital investment has counterbalanced the GDP decrease. As shown in Table 1, there has been a steady increase in investment in machinery and equipment and intellectual property products throughout 2020, thereby supporting aggregate economic activity even during the peak of consumption and export shocks. Due to a decent share of private investment in South Korea’s GDP -that is, about a quarter of GDP as of 2020- stable growth in private capital investment coupled with improved exports in the second half of 2020 has supported a relatively prompt recovery of Korean GDP.
2.2. Output and employment
Following the 1.3% drop in GDP in 2020, the employment rate or the employed as a fraction of the working-age population has declined by 2.3% in 2020 (Statistics Korea, 2020a). However, importantly, the economic impacts of the pandemic and a partial recovery have been remarkably disproportionate across businesses, workers, and households. Figure 1 demonstrates large variations in employment losses across different sectors during the COVID-19 crisis. It clearly shows contrasting trends of employment losses between high-contact services (such as accommodation and food, retail, culture, educational activities), high-skilled & information and communication (ITC) related- services (professional and information-communication services), and the manufacturing sector.
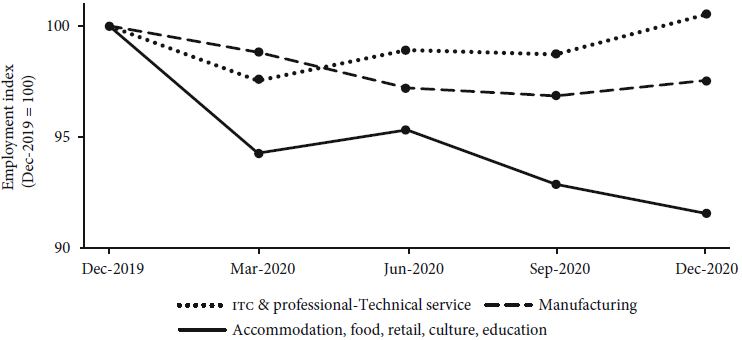
Notes: ITC & Professional-Technical Service includes ITC and professional, scientific, and technical service. The category of accommodation, food, retail, culture, and education consists of accommodation, food, retail, wholesale, education, culture, and recreation services.
Source: Ministry of Employment and Labor (2020a), Labor Force Survey at Establishments, December 2019-December 2020, available at <http://laborstat.moel.go.kr>.
Figure 1 Sectoral employment in 2020, December 2019 = 100, December 2019 to December 2020
Not only the magnitude of job losses was stronger for high-contact services compared to other sectors, but also sectoral employment trends since mid-2020 look markedly divergent. Whereas high-skilled & ITC related- service sectors have recovered the pre-crisis levels of employment in late 2020, job destruction has continued to increase in the high-contact sectors. It is also noted that the manufacturing sector has slashed employment roughly by 3% during the pandemic.
Table 2 presents detailed information on the sectoral changes in employment and production in the Korean economy, ordered by employment changes during the COVID-19 pandemic from 2019Q4 to 2020Q4. Starting from accommodation and food services on the top row through the bottom row -health and social work- the size of employment losses during the pandemic decreases.
Table 2 Sectoral structure of employment, output and wages, 2019Q4-2020Q4
| Employment change 2019Q4-2020Q4 (Thousands) | Output growth 2019Q4-2020Q4 (%) | Employment share 2019Q4 (%) | Output share 2019Q4 (%) | Wage rate per day Dec. 2019 (KOR Won) | |
|---|---|---|---|---|---|
| Accommodation and food services | -313 | -18.11 | 8.6 | 2.4 | 105,340 |
| Retail & wholesale | -197 | -3.34 | 13.3 | 7.8 | 196,134 |
| Manufacturing | -110 | 0.11 | 16.5 | 29.1 | 258,798 |
| Education | -99 | -2.35 | 6.9 | 5.1 | 235,610 |
| Culture and recreation | -97 | -18.25 | 2.0 | 2.4 | 163,574 |
| Real estate | -66 | 0.63 | 2.1 | 8.0 | 164,315 |
| Finance and insurance | -20 | 8.85 | 2.9 | 6.1 | 417,854 |
| Information and communication | -2 | 0.26 | 3.1 | 4.8 | 265,544 |
| Professional, scientific and technical service | 12 | -1.56 | 4.3 | 9.3 | 289,519 |
| Construction | 22 | -2.81 | 7.5 | 5.3 | 197,912 |
| Transportation and storage | 29 | -18.33 | 5.5 | 3.7 | 194,404 |
| Health and social work | 44 | -0.34 | 8.2 | 5.1 | 159,536 |
Source: Statistics Korea (2020b), National Business Survey; Ministry of Employment and Labor (2020a), Labor Force Survey at Establishments; Bank of Korea, National Accounts, GDP and GNI by Economic Activities; and author’s calculations. See Appendix for more details on the data sources.
The following are the major findings from my examination of the figures in Table 2.
The changes in output and employment within the service sector have been visibly divergent. High-contact services -such as education, culture, entertainment, retail and wholesale, and accommodation and food industries- have undergone both output and employment losses, while information and communication-related- services and the health/social work industries have been protected during the pandemic.
On the other hand, in the financial (finance, insurance, and real estate, or so-called FIRE) and manufacturing sectors, output and employment have changed in an opposite direction. Output has continued to grow but there were employment cuts throughout 2020. In particular, the fire sector has achieved rapid output growth during the pandemic, which is contrasted with employment losses (see column 1 in Table 2).
It is important to know that the contrasting trends between employment and production in Korea have begun back in the early 2000s. According to the National Business Survey (Statistics Korea, 2020b), the manufacturing and fire sectors have consistently reduced their employment shares despite a substantial gain in their output shares over the last fifteen years. In detail, from 2004 through 2019, whilst the output share of the manufacturing sector has risen by 2.2 percentage points, its employment share has declined by 0.8 percentage point. During the same period, the finance and insurance sector has increased its output share by 1.4 percentage points, but the employment share has declined by 0.9 percentage point (ibid.; and author’s calculations).
The contrast between the output growing sectors and high-contact services conveys two important macroeconomic implications. First, since relatively lower-wage jobs are concentrated in high-contact services, a greater employment impact on high-contact services could lead to further deterioration of income for lower-tier workers and households, therefore adversely affecting aggregate demand. Since low-income households have a lower saving rate than high-income households, the household saving rate will rise resulting from the disparate job losses. Second, output growth combined with employment loss that occurred in the fire and manufacturing sectors could translate to a rise in corporate saving and financial investment, which, in turn, generates depressing effects on aggregate demand. I will provide more details on these macroeconomic phenomena in the later sections of the paper.
3. DISPROPORTIONATE JOB LOSS
The economic development in the aftermath of the 1997 Asian Financial Crisis has been associated with a dramatic increase in non-standard employment. According to Statistics Korea (2020c), nonstandard-irregular workers account for 36.1% of the total wage-salary workers in South Korea as of August 2020, which amounts to 7.5 million workers. The duality of the Korean labor market indicates disparities in employment stability, working conditions, wages, and social insurance coverage between standard-regular workers and nonstandard-irregular workers.
Given the prevailing dual labor markets in Korea, one can expect that the COVID-19 crisis may have disproportionately affected nonstandard-irregular workers. According to Hwang (2020), a larger proportion of non-standard workers have lost their jobs and undergone larger payment cuts than their counterparts during the pandemic.
In this context, this section examines how the COVID-19 crisis has unevenly affected workers in different employment types in Korea. As shown in Figure 2, from August 2019 to August 2020, 2.49% of total wage and salary workers have lost jobs but non-standard workers were hit exclusively. According to the data (Statistics Korea, 2020c), 7.46% of irregular workers have been dismissed, while standard-regular jobs have gained jobs by 0.07% during the same period.

Notes: Nonstandard-irregular jobs are the forms of employment that do not offer workers the prospect of a long-lasting employment relationship. The nonstandard-irregular jobs mainly include open-ended temporary contracts, atypical-temporary agency workers, and daily or hourly workers.
Source: Statistics Korea (2020c), Economically Active Population Survey, Supplement Survey Results, available at <www.kosis.go.kr>; and author’s calculations.
Figure 2 Job loss by employment type, year-on-year percentage change, August 2019-August 2020
Even among the nonstandard-irregular workers, there have been uneven employment impacts on specific groups. As depicted in Figure 3, “open-ended contract workers” -who have no defined termination date of employment but could be dismissed involuntarily- and “atypically employed workers” -indicating temporary agency workers and disguised self-employed workers- have markedly experienced larger job losses, while jobs for hourly and daily workers have increased during the pandemic. In particular, female in atypical employment (temporary agency and disguised self-employed workers) is the group of the workers who has been hit the hardest by COVID-19. Over a year, 13% of jobs for the atypical type of female workers had disappeared (Statistics Korea, 2020c).

Notes: Nonstandard-irregular jobs can be categorized into three sub-types of employment: (1) open-ended temporary workers whose contract period is not fixed but can be dismissed against workers’ own will, (2) atypically employed workers -mainly including disguised self-employed and agency workers-, and (3) hourly or daily workers.
Source: Statistics Korea (2020c), Supplement Survey Results by Employment Type, August 2020, available at <www.kosis.go.kr>; and author’s calculations
Figure 3 Nonstandard-irregular employment, year-on-year percentage change, August 2019-August 2020
In sum, whereas regular employment type workers have been protected, workers in nonstandard employment types have been exclusively hit by the pandemic. Among the nonstandard workers, open-ended temporary workers and atypical workers were hit heavily. Particularly, female workers have been damaged the hardest even among the atypical workers. Combined with severe employment losses in high-contact service industries, this unequal feature of job destruction during the pandemic provides important implications for designing policy responses.
4. DISPARATE INCOME EFFECTS
Following the uneven distribution of employment losses across businesses and workers, COVID-19 has generated disproportionate income impacts on Korean households. This section examines empirical patterns of household income disparity in Korea during the pandemic. Figure 4 depicts how mean incomes of different household income quintiles have changed in 2020. Mean income in the figure grows from the left to right along the horizontal axis, so 1st quintile is the bottom income household group, and 5th quintile is the top income group. The percentage change in each quintile’s mean income in 2020 is the growth rate of the quintile’s mean income from the same quarter of 2019.
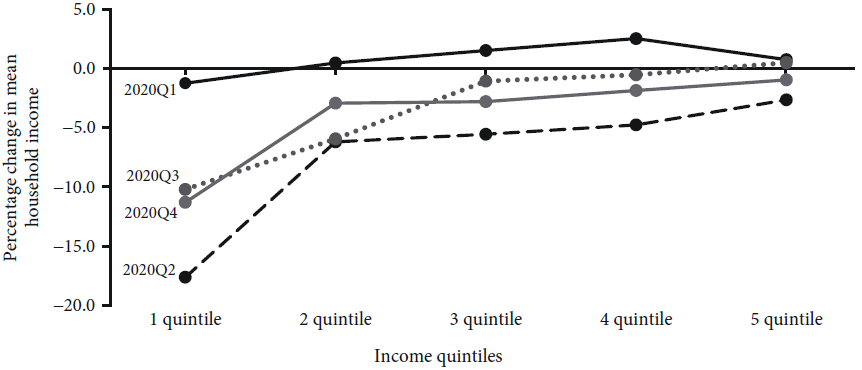
Notes: Mean incomes grow from the left to right on the horizontal axis. Household income includes wage and salary income and business income. Percentage change in quintile incomes in 2020 is the growth rate of each quintile’s mean income from the same quarter in 2019.
Source: Statistics Korea (2020d), Household Income and Expenditure Survey, available at <www.kosis.kr>; and author’s calculations.
Figure 4 Percentage changes in incomes for household income quintiles, 2020
As shown in Figure 4, the bottom quintile households started to encounter income losses from 2020Q1, and then all income quintiles have experienced substantial income losses in 2020Q2. However, the size of initial income losses was markedly different between the bottom and higher-income households. Mean income losses in 2020Q2 range from 17.6 percentage for the bottom quintile households to 2.7 percentage points for the top quintile households.
Furthermore, the evolution of household incomes throughout 2020 demonstrates that the upper three quintiles have almost recovered their pre-crisis income levels from 2020Q3, but recovery looks stagnant for the bottom quintile. Specifically, mean incomes of the bottom quintile in 2020Q3-Q4 were below 90% of their 2019 income levels.
Overall, the higher household income is, the smaller initial income losses occurred, and the faster income recovery followed. Considering the unequal distribution of production and employment losses during the pandemic, extensive employment losses that occurred to high-contact services and nonstandard-irregular workers could have resulted in larger income losses and stagnant income recovery for lower-income families. These domino effects may have widened the disparity of household incomes, which, in turn, hurts aggregate demand.
5. HOUSEHOLDS’ CONSUMPTION AND SAVING BEHAVIOR
The unequal characteristics of job losses and income distribution could have changed households’ consumption and saving behavior. According to Statistics Korea (2020d), the Korean household sector has reduced consumption spending as a share of disposable income throughout 2020, ranging from -7.9 percentage points (2020Q1) to -1.7 percentage points (2020Q4). Figure 5a presents the percentage point change in the ratio of consumption to disposable income in each quarter of 2020 compared to the same quarter of 2019. Low-income households have dramatically reduced their consumption spending in response to income losses. The magnitude of the drop in the consumption ratio for the lower 50% income households has been -10.71, -6.59, and -4.68 percentage points from 2020Q1 through 2020Q3, while the consumption ratio for upper 50% income households has been -7.72, -1.52, and -2.12 percentage points during the same period.

Notes: (1) Average propensity to consume = consumption/disposable income*100; (2) Disposable income = current gross income - (tax + pension contribution + social insurance contribution + interest payment); (3) The low-income group in the upper panel indicates the bottom 50% income households, and the high-income group is the upper 50% income households.
Source: Statistics Korea (2020d), Household Income and Expenditure Survey, Quarterly, available at <www.kosis.go.kr>; and author’s calculations
Figure 5 The ratio of consumption to disposable income, 2020
The different numbers between the two groups appear to be related to the disproportionate income impacts on households with different income levels as examined in Section 4. Considering concentrated job losses in the high-contact, low-wage service sectors and for non-standard workers, low-income households would have reduced consumption as one of the family members has suddenly lost his/her job during the pandemic.
Meanwhile, the upper 50% income households have also reduced their consumption. On average, the upper-half households have gained income by 0.75%, but reduced consumption by 0.6% in 2020 compared to their income and consumption levels in 2019 (ibid.; and author’s calculations). For 2020Q2-Q3, there has been an increase in consumption, but the magnitude of the consumption increase was less than that of the income increase, resulting in a slight drop in the consumption ratio.
Overall, low-income families, a larger portion of which have been adversely hit by COVID-19, have slashed consumption in 2020, thereby contributing to raising the household sector’s saving rate. Because low-income households have negative or relatively lower saving rates (see Figure 5b)1, the uneven distribution of job losses unfavorable for low-income workers could have become the major driver to the rise in the household saving rate.
Between 2019 and 2020, on average, Korean disposable income has risen by 4.3%, but consumption has declined by 1.2%, resulting in a higher household saving rate2. Less consumption or a higher saving rate imply aggravation of aggregate demand. Worse, since the rise in the household saving rate has been caused by the uneven impacts of COVID-19 on some of the service sectors where workers are paid poorly, the slumped period of aggregate demand could be prolonged. Furthermore, since suppliers in service industries tend to slowly respond to a rise in demand, we are likely to see a more sluggish recovery of demand (Olney and Pacitti, 2017; Blecker, 2014).
6. THE RISE IN CORPORATE SAVING AND LIQUIDITY PREFERENCE
The downfall in household consumption could be counterbalanced if corporations have sufficiently increased capital investment. If higher profits have been channeled to a larger scale of capital investment, the negative impacts of the pandemic on the aggregate consumption ratio can be diminished or offset. As presented earlier, the Korean corporate sector’s capital investment has been sustained in 2020. However, if the pace of corporate investment is exceeded by that of the corporate sector’s profits, we can expect a rise in corporate net lending, which, in turn, further depresses aggregate demand.
From 2019Q4 to 2020Q4, 2.3% of jobs have been destroyed and real GDP has declined by 1.3%. Since the magnitude of employment losses was larger than that of output losses, disproportionate degrowth in output and employment could end up strengthening the corporate sector’s saving and net lending. However, due to limited data on the sectoral flow of funds for 2020, reliable calculations for the corporate sector’s net lending should be postponed.
In this section, as a background, I will outline important empirical patterns in South Korea since 1990, and then discuss the expected macroeconomic implications of the COVID-19 downturn. Figure 6 depicts the evolution of the Korean nonfinancial corporations’ (NFCS) profits, capital investment, and net lending relative to national disposable income between 1990 and 2019.

Notes: NFC profit share is NFC’s gross operating surplus relative to national disposable income. NFC investment ratio is NFC’S capital investment relative to national disposable income. NFC net lending denotes NFC’S gross saving net of gross capital investment relative to national disposable income.
Source: Bank of Korea, National Accounts by Institutional Sectors; and Gross Savings and Gross Investments, Annual, 1990-2019, available at <www.kosis.go.kr>; and author’s calculations.
Figure 6 Korean nonfinancial corporate profits, capital investment, and net lending relative to national disposable income, 1990-2019
Over the last three decades, the Korean NFCs have seen a significant increase in gross profits along with downscaled capital investment. Specifically, Korean NFCs’ profit share grew from 16.59% to 22.5% of national disposable income between 2000 and 2010 and then remained at this higher plateau. But NFC capital investment has decreased in the aftermath of the 1997 Asian crisis and fluctuated between 19% to 22% since then. Together, a consistent rise in the profit share and downscaled capital investment combined have made upward pressure on Korean NFCs’ net lending. As shown in Figure 6, the ratio of net lending to national disposable income rose from -11.8% to -0.15% in the period 1990-2019.
Consistent with the findings of de Souza and Epstein (2014) for the U.S. and European countries, the increasing pattern of net lending by Korean nonfinancial firms could be associated with their increased involvement in liquid financial transactions. The liberalized, deregulated financial markets in the aftermath of the 1997 Asian crisis have encouraged Korean firms to increase liquid financial investment by diverting internal resources into the financial markets. Figure 7 depicts changes in Korean NFCs’ liquid financial assets as a ratio of capital investment. The empirical pattern in the figure confirms that Korean NFCs have increased the liquid financial asset investment ratio in the period 2009Q2-2020Q3.
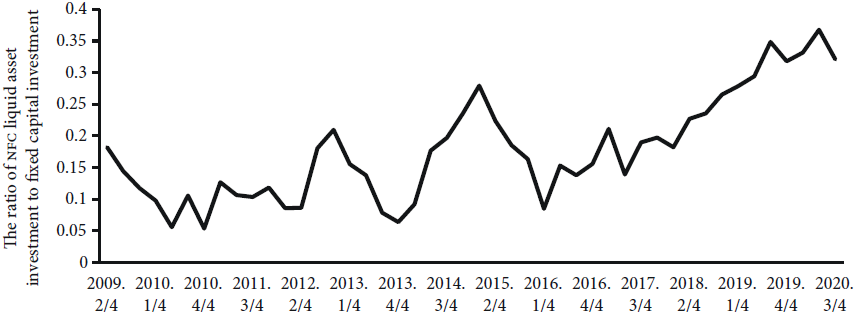
Notes: The liquid financial asset investment ratio is computed as the ratio of NFCs’ liquid financial asset investment to fixed-asset investment. NFC liquid asset investment is the change in liquid financial assets held by NFCs. Liquid financial assets include cash and deposit, marketable securities, securities issued in foreign countries, foreign direct investment, and net miscellaneous liquid assets.
Source: Bank of Korea, the Flow of Funds, Financial Assets and Liabilities Outstanding; National Accounts, Gross Capital Formation, available at <www.kosis.go.kr>; and author’s calculations.
Figure 7 Korean nonfinancial corporate liquid financial asset investment ratio, 2009Q2-2020Q3
Considering the rising trend of corporate net lending and a massive explosion of the Korean and global financial markets during the COVID-19 recession, it is expected that the rise in profits and net lending may have translated to increased engagement in financial transactions by Korean nonfinancial firms.
As examined earlier in Section 2, although output has increased, firms in the manufacturing sector, on average, have reduced employment by 2.5% during the pandemic, which amounts to 110 thousand jobs. In this context, most of Korean NFCS’ net saving flows could come from the output-growing sectors that implemented employment cuts during the pandemic. Considering the divergent patterns between employment and output growth in Korea, Korean NFCS’ net lending to the financial markets may have continued to follow its long-term rising trend.
7. AGGREGATE DEMAND GENERATION.
Supporting aggregate demand is essential for sustaining economic growth. To consider how the current crisis could have affected Korea’s aggregate economic activity, it would be worthwhile to explore the changing nature of the demand structure of South Korea since 1990.
Figure 8 shows the evolution of the sectoral composition of saving and net lending in Korea over the last three decades from 1990 through 2019. Figure 8a depicts the long-term trends of sectoral saving as a share of gross national saving. Korean NFCS and households have shown markedly opposite trends since the 1997-1998 Asian financial crisis. Savings by Korean NFCS have rapidly increased importance in national saving from the late 1990s so that it reaches about 60% of gross national saving in the 2010s, while the household sector lost importance in national saving after they were hit by the 1997 Asian crisis, remained at a lower plateau in the 2000s, and then gradually regained its saving share from 12% to 20% in the 2010s.

Notes: Gross saving of each sector (nonfinancial corporates, household, and government) is divided by gross national saving. Sectoral net lending is each sector’s saving net of investment. Each sector’s net lending is normalized by gross national disposable income.
Source: Bank of Korea, National Accounts-Gross Savings and Gross Investments, available at <www.kosis.go.kr>; and author’s calculations.
Figure 8 Sectoral composition of saving and net lending, 1990-2019
Following the shift in the sectoral composition of saving toward Korean NFCS, a similar pattern of structural change has emerged to sectoral net lending in Korea during the same period from 1990 through 2019. In the aftermath of the 1997 crisis, many Koreans had lost jobs and incomes, which hurts the household sector’s net lending position. However, since the mid-2000s, Korean households have partially recovered their income relative to its pre-1997 level, therefore we can observe a positive value of the net lending ratio since 2009. In contrast, as examined earlier, a rapid increase in profits without a proportionate increase in capital investment has led Korean NFCS to improve their net lending position so that the ratio of net lending to national disposable income has reached a positive value from 2013 through 2018.
Now, throughout the pandemic, higher-tier households and businesses have increased lending surplus incomes and profits to the financial markets, while relatively lower-tier households and the high-contact service sectors are suffering hard. For aggregate demand, these patterns imply that the widening sectoral/income disparities have become the forces driving the national saving rate to rise further, which, in turn, generates downward multiplier effects on aggregate demand.
In sum, the unequal distribution of output, employment, and income shocks across businesses, workers, and households have been the major contributor to the soaring pattern of private saving rates, thereby exacerbating the already worsened domestic demand structure in South Korea.
8. POLICY RESPONSES AND IMPLICATIONS
As a background for understanding policy responses in Korea, it should be noted that the Korean government adopted extensive testing and contact tracing as the main strategy for curbing the spread of the COVID-19 virus rather than implementing stringent social distancing or an extensive lockdown (Kim, 2020). But it is clear that a relatively moderate degree of social distancing has also generated a substantial strain on economic activity (Aum Lee, and Shin, 2020).
As the number of COVID-19 cases exponentially grew in February 2020, consumption fell quickly. Also, given that Korea is an export-oriented economy, falling foreign demand due to extensive lockdowns in many major countries resulted in a rapid decrease in exports in the first half of 2020. As emphasized, the disparate distribution of output, employment, and income shocks over the different sectors of the economy has caused changes in consumption, saving, and investment decisions. This, in turn, may have exacerbated aggregate demand of the Korean economy.
To counterbalance the depressing effects caused by the pandemic, prompt and well-designed policy measures have been required. In this context, the main role of policy responses is twofold. First, it needs to protect the businesses, workers, and families who were directly hit hard by the fall in consumption and exports. Second, it should counteract the widening disparities between firms and people, thereby curbing the negative impacts of the increasing disparities on aggregate demand.
In a similar way that many other countries hit by COVID-19 reacted to the pandemic, the Korean government and policy authorities have adopted a set of fiscal and monetary policy measures facing the severity of the pandemic crisis. Broadly, these policy measures can be characterized as the conventional recession fighting package, which has been adopted by the U.S. during the last two recessions (Organisation for Economic Co-operation and Development, OECD, 2020, Annex 1.B). The emergency stimulus package employed in Korea in early 2020 mainly includes liquidity provision to the firms in the nationally important industries and financial institutions, a variety of tax cuts and credits for stimulating consumption and investment, broad-based cash or grant transfers, and lowering interest rates by slashing short-term rates and by purchasing long-term corporate and treasury bonds (ibid.)
Looking at a breakdown of the total spending in the COVID-19 emergency stimulus package employed in Korea from February through July 2020 (ibid.), liquidity provision to major manufacturers, exporting firms, and financial institutions (60% or Korean Republic Won, KRW, 217 trillion) are the largest components in the stimulus package, followed by supports for small and medium-sized firms and self-employed businesses (26% or KRW 66.6 trillion), tax incentives and emergency relief income transfers to households (7% or KRW 17.6 trillion), financing public health (1.2% or KRW 3 trillion), and employment stabilization measures (1% or KRW 2.5 trillion).
These expenditure shares demonstrate that policy measures are significantly biased away from workers and households and toward businesses. The financial supports for businesses in the form of direct bailout, government-guaranteed loans, and a range of other loans and payments amount to KRW 217 trillion or 86% of the total stimulus spending.
The matter is that much of the liquidity provisioning measures have not been for the people who are the most vulnerable. Even worse, relatively little money flew to the high-hit sectors and small businesses. Instead, a larger fraction of spending was to support relatively larger-sized corporations, most of which are the main exporters in Korea. According to OECD (ibid.) and my calculations, relatively bigger corporations received 39.5% of total emergency stimulus spending, equivalent to KRW 99.3 trillion from February to July in 2020. The liquidity assistance should be equitable across different sectors of the economy, but it ended up mainly assisting big businesses and financial institutions. In contrast, although it can prevent liquidity-constrained small self-employed and low-income households from bankruptcies, no action was taken to relieve the burden of rent, lease, and student loan interest payments throughout 2020.
During the COVID-19 crisis, the main tool for helping Korean households has been to provide income transfers to people. From April through May in 2020, the bottom income bracket households, which is about 2.7 million households, received grants in cash, while the remaining 19 million households received vouchers that were redeemable only at local shops and markets. The amount of the income transfers for a three-person household was about $814. And its policy goal was to promote household consumption, thereby helping small businesses and their workers (ibid.).
On the matter of how effective the income transfer programs were, the data in Statistics Korea (2020d) demonstrates that there has been a consumption increase by KRW 13.6 trillion out of the total KRW 17.6 trillion income transfers over the next 3 months since the start of its distribution. This indicates that the marginal propensity to consume for the emergency income transfers in Korea was about 0.77. Coupled with loosened social distancing measures since May 2020, income transfers were broadly effective in curbing the pace of falling consumption in 2020Q2.
However, as examined earlier, consumption spending of low-income households was not improved much relative to that of high-income households even in 2020Q2 during which the emergency income transfers were executed. Knowing the underlying reasons for this disparate consumption pattern in response to income transfers requires a much closer investigation, but I would point the difference in the payment type between vouchers for higher-income households and cash for the bottom-tier households. Given that there were no burden-relieving measures for fixed costs, such as rents and interest payments, it is expected that the money from the transfers may have been used for covering those regular payments. Overall, regarding policy design, this divergent consumption pattern demonstrates a need for a more targeted approach to vulnerable households during the pandemic.
There was also a measure for stabilizing employment, the so-called “Employment Retention Subsidy.” However, only KRW 1.2 trillion was assigned for running the employment retention subsidy program. Due to the limited budget, the program was destined to be short-lived, too small for help, or too restrictive in terms of application requirements (Park, 2020). Even further, the program had a stringent eligibility condition about the employers who can request. Since it restricted the beneficiaries of the program to the employers who are already enrolled in the employment insurance scheme, many hard-hit businesses could not apply for the assistance (Lee, 2020, p. 2). Because small firms, high-contact service enterprises, and nonstandard-irregular workers3 have substantially lower coverage rates of social insurance than their counterparts, the job retention program was doomed to be ineffective in protecting vulnerable firms and workers. For the same reason, it turns out that relatively affluent businesses have benefited from the job retention program.
Recall that the major impacts of the COVID crisis on economic activity in Korea were concentrated in the employers and workers in the high-contact service sectors, nonstandard workers, and relatively lower-income households. This implies that the government should have targeted those who are working in these blind spots of the society and who are the most vulnerable to the health and economic crisis. However, actual policy measures in Korea were not designed in that context. Instead, the Korean government chose to devote most of the available resources to major corporations, exporting firms, and financial institutions. Probably, this explains why exports and capital investment have swiftly recovered their pre-crisis levels during the second half of 2020. But it looks evident that wealth redistribution in favor of big corporations and banks has occurred at the cost of vulnerable and needy firms and people.
In sum, policy responses must have tackled the disparate impacts of the viral disease on businesses and people who have limited means for survival so that the distribution of income and wealth does not get worse. However, economic policy responses so far implemented in Korea were mostly ineffective in preventing job losses, protecting high-contact service businesses, and counteracting the exacerbation of employment, income, and social inequalities. Without proactive, long-run policy efforts to reduce income and wealth disparities, the Korean economy could plunge into a prolonged economic recession.
9. CONCLUSION
This paper examined the major impacts of the COVID-19 pandemic on economic activity and the effectiveness of policy measures that have been implemented in South Korea. I particularly focused on the disparate economic impacts on businesses, workers, and families and then discussed their macroeconomic and policy implications.
The COVID-19 downturn has deteriorated sectoral uneven growth, income inequality, and corporate liquidity preferences. The macroeconomic implication lies in the exacerbation of structural deficiency in domestic demand generation resulting from rising sectoral, income inequality during the COVID-19 crisis.
In the 1997 Asian crisis, the Korean banks and big corporations were bailed out, but permitted households to collapse. In the aftermath of the crisis, through radical neoliberal reforms for the entire aspects of the society, the Korean economy has recovered and continued to grow, but this recovery happened at the expense of small businesses and low-income workers. The consequence of this unequal recovery process is exemplified by the polarization of the Korean labor markets in which 36.1% of Korean workers, as of 2020, are discriminated against compared to their counterparts in terms of employment, wages, social insurance, and working conditions.
During the current COVID-19 crisis, we are again witnessing another income and wealth redistribution favorable for big corporations and banks and away from small businesses, non-standard workers, and low-income households. The impacts of COVID-19 have been extremely unequal because people who are the most vulnerable in terms of both income and health are likely to suffer more from the disease and unemployment than richer people. This widening disparity also has important macroeconomic implications. In the paper, I discussed that the unequal distribution of output, employment, and income shocks across businesses, workers, and households have contributed to the rising pattern of private saving rates, thereby exacerbating the already worsened domestic demand structure in South Korea.
Since early 2020, the Korean government has responded to the COVID-19 crisis by implementing a wide range of policy measures, which is similar to the recession fighting package adopted by the U.S. However, the policy measures have been extremely biased toward big businesses and away from small firms and low-income people, thereby contributing to the widening disparities of income and wealth among workers and firms.
The current state of the Korean economy indicates that policies going forward must tackle the people and firms who have limited cushion for survival so that the disparities of income and wealth do not get worse. Considering the potential knock-on effects on aggregate demand arising from the widening disparities of income and wealth, protecting the lower-tier firms and people would become essential for full macroeconomic recovery. Without well-designed government support programs for the vulnerable people, the Korean economy could get into a much deeper and long-lasting recession. In sum, post-pandemic economic policies must be massive, long-term, and provide more equitable social-economic visions for the future of the Korean and global economy.

