


Services on Demand
Journal
Article
 English (pdf)
 Article in xml format
 Article references
 Send this article by e-mail
Indicators
-
 Cited by SciELO
 -
 Access statistics
Related links
-
 Similars in
SciELO
Similars in
SciELO
Share

 Permalink
Investigación económica
Print version ISSN 0185-1667
Inv. Econ vol.71 n.279 Ciudad de México Jan./Mar. 2012
Economics of land use dynamics in two Mexican coffee agroforests: implications for the environment and inequality
Economía de la dinámica del uso del suelo en dos fincas de café: implicaciones para el medio ambiente y la desigualdad
Kenneth A. Baerenklau*, Edward A. Ellis** and Raymundo Marcos-Martinez***
* University of California-Riverside. Correo electrónico: <ken.baerenklau@ucr.edu>.
** Centro de Investigaciones Tropicales, Universidad Veracruzana. Correo electrónico: <eellis@uv.mx>.
*** University of California-Riverside. Correo electrónico: <rmarc004@ucr.edu>.
Received June 2011.
Accepted November 2011.
Abstract
Land use and land cover change have wide ranging implications for the environment and human welfare. This study analyzes both landscape and parcel level data to assess the causes and extent of deforestation in two Mexican coffee agroforests, as well as the likely environmental and welfare effects of policies designed to reduce tree cover loss. We find that shade coffee growers in Atzalan exhibit a relatively high elasticity of substitution between agricultural outputs: in response to low coffee prices, they have predominantly cleared their agroforestry parcels for production of tree crops. Shade coffee growers in Zozocolco exhibit a relatively low elasticity of substitution: agroforests were mostly either augmented with allspice trees or abandoned. Our policy simulations show that price supports for shade coffee would have larger effects on canopy preservation and welfare in Atzalan, even though Zozocolco is more marginalized.
Key words: Land use, land cover change coffee agroforests, deforestation, econometric modeling, price supports, Veracruz.
JEL Classification:* Q12, Q15, Q23, Q56
Resumen
Los cambios de uso y cobertura de suelo tiene amplias implicaciones para el medio ambiente y el bienestar humano. Este estudio analiza información, tanto a nivel de paisaje como a nivel de parcelas, para evaluar las causas y extensión de la deforestación en dos áreas agroforestales cafetaleras en México, así como los probables efectos en el medio ambiente y bienestar derivados de políticas encauzadas a reducir la pérdida de cobertura forestal. Los indican que los productores de café bajo sombra en Atzalan presentan una relativamente alta elasticidad de sustitución entre cultivos agrícolas; en respuesta a los bajos precios del café, tales productos han predominantemente cambiado sus parcelas agroforestales por cultivos sin cobertura forestal. Por su parte, en Zozocolco los productores de café bajo sombra muestran una relativamente baja elasticidad de sustitución; ante los bajos precios del café sus parcelas han registrado un incremento en el número de árboles de pimienta o han sido abandonadas. Las simulaciones de políticas muestran que subsidios o controles al precio del café bajo sombra serían más efectivos para preservar la cobertura forestal e incrementar el bienestar en Atzalan, pese a que Zozocolco es una región más marginada.
Palabras clave: uso de suelo, cobertura de suelo, fincas de café, deforestación, modelación econométrica, control y subsidios al precio, Veracruz.
INTRODUCTION AND BACKGROUND
Land use and land cover change (LULCC) have implications for climate change, biodiversity loss, soil degradation, watershed hydrology, and human welfare (Lambin etal., 2001; Geist and Lambin, 2002). Such landscape-scale changes, of which tropical deforestation may be the most well-known current example, are the aggregate results of numerous small-scale or parcel-based land use decisions made by individual agents who are influenced by locally variable environmental, socioeconomic, and institutional factors, and who may respond differently under similar conditions (Overmars and Verburg, 2006; Rindfuss et al, 2004; Geist and Lambin, 2002). Therefore the coupling of remote sensing data on LULCC through time and within landscapes with micro or parcel-level information about relevant local conditions has been particularly useful for identifying the drivers of LULCC as well as institutional mechanisms that might be used to control it (Keys and Chowdhury, 2006; Munroe, Southworth and Tucker, 2004; Verburg, Schot, Dijst and Veldkamp, 2004).
This study takes this dual approach of analyzing landscape and local level data, to assess the causes and extent of deforestation (tree cover loss) in two Mexican coffee agroforests, as well as the likely environmental and welfare effects of economic incentives designed to reduce tree cover loss. Deforestation is a significant issue in Mexico. The Food and Agriculture Organization (FAO) recently ranked Mexico's deforestation fourth worst in the world (FAO, 2006). The problem is particularly acute in the state of Veracruz which has lost over 75% of its forest canopy (semarnat, 2005). This canopy loss has come not only from primary and secondary forest cover, but also from economically productive agroforests. Agroforests are used (often by relatively poor communities) across Mexico to produce coffee, cacao, allspice, and other commodities that benefit from the preservation of tree cover for shade. Agroforests also provide other environmental services in the form of biodiversity preservation, soil and water conservation, and carbon sequestration to a much greater extent than monocrop and pasture systems (Blackman, Albers, Ávalos-Sartorio and Murphy, 2008; Gordon, Manson, Sundberg and Cruz-Angón, 2007; Somarriba et al, 2004; Pearce and Mourato, 2004). When intact, agroforestry systems can provide forest-like benefits; therefore the loss of such systems produces deforestation-like damages.
Historically, coffee in Mexico has been produced largely from shade-canopy agroforestry systems, and has provided a significant source of income to small-holder farmers (Blackman, Albers, Ávalos-Sartorio and Murphy, 2008; Vázquez García, 2001). Despite the recent emergence of countries like Brazil and Vietnam, Mexico remains the ninth largest coffee producer in the world with 3.64% of total world production and 1.91% of total exports (ICO, 2010). Veracruz is the second largest coffee producing state in Mexico (Gordon, Manson, Sundberg and Cruz-Angón, 2007). However, economic conditions for small-scale shade coffee growers throughout Mexico have worsened substantially since 1989, after the collapse of international agreements that tended to prop-up the coffee price and the elimination of the Instituto Mexicano del Café (INMECAFE) that subsidized production, processing, and commercialization (Romero Leon, Houston and Epperson, 2006; Vázquez García, 2001). Since then, coffee production in Mexico has declined and many coffee agroforests have been abandoned or converted to other uses (Romero Leon, Houston and Epperson, 2006; Vázquez García, 2001).
Because higher elevations are better suited for producing high-quality coffee that can be sold at premium prices, abandonment and conversion of coffee agroforests —and the associated economic and environmental problems— have been more common at elevations below 600 meters (Romero Leon, Houston and Epperson, 2006). The sharp reduction in already low rural incomes and the threat to long-term sustainability of these lowland agroforest ecosystems have provided convincing motivation for government intervention. A current noteworthy example is the Diversificación Productiva de Cafetales de Baja Altitud (DIPROCAFE) project, an agricultural diversification project authorized by the State of Veracruz and coordinated by the University of Veracruz with support from the International Coffee Organization and the United Nations Common Fund for Commodities. DIPROCAFE is working with 1 500 small-holders in the municipalities of Atzalan and Zozocolco de Hidalgo to diversify their production efforts within coffee agroforests and achieve a more stable source of income through environmentally sustainable farming. Although Atzalan and Zozocolco are ecologically, environmentally and geographically similar, they exhibit notable socioeconomic differences. The population of Atzalan is relatively more educated and better connected to a variety of commodity markets, while that of Zozocolco is poorer, more indigenous, and isolated. Therefore the effects of market conditions —particularly commodity price fluctuations— on these populations are potentially very different.
In this article we present the results of a comparative study of land use dynamics over the past three decades in these two municipalities, estimate econometric models of land use, and simulate the effects of commodity price support policies in both locations. We find that shade coffee growers in Atzalan exhibit a relatively high elasticity of substitution between agricultural outputs: in response to low coffee prices, they have predominantly cleared their agroforestry parcels for production of tree crops (citrus and bananas), and have experienced a gradual and significant loss of tree cover. On the contrary, we find that the shade coffee growers in Zozocolco exhibit a relatively low elasticity of substitution between agricultural outputs: except for a very recent increase in the conversion of coffee agroforests to pasture, agroforests were mostly either augmented with allspice trees or abandoned rather than cleared. The local population also chose to rely more heavily on subsistence farming presumably until the coffee price rebounds. This means that the causal link between low coffee prices and canopy loss has been relatively weak in Zozocolco, and that efforts such as DIPROCAFE may produce benefits in terms of higher incomes but not in terms of foregone deforestation. Our policy simulations show that price supports would have noticeably larger effects on canopy preservation and on modeled welfare in Atzalan, even though the population of Zozocolco is more marginalized. We discuss qualitative implications of these results, particularly with regard to the social efficiency and equity of programs such as DIPROCAFE.
STUDY AREAS: ZOZOCOLCO DE HIDALGO AND ATZALAN
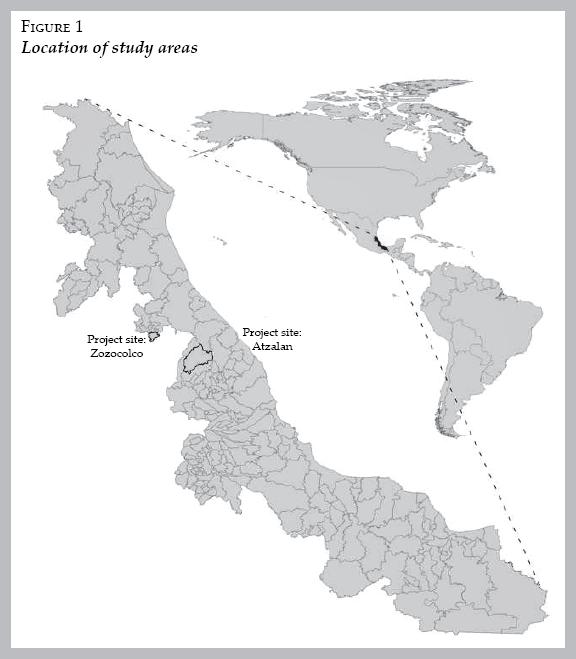
Figure 1 shows the location of our comparative study areas. Zozocolco de Hidalgo and Atzalan diverge in terms of cultural and socioeconomic characteristics but they share very similar agro-ecological conditions. Both municipalities have very hilly topography and have a warm and sub-humid climate. Precipitation falls mostly between the months of June and September, while a marked dry season may last up to 6 months, usually between October and March (García, 1988). Soils are for the most part lithosols or luvisols which are poorly developed soils of low to moderate fertility containing substantial gravel and rocks characteristic of the hilly terrain in the region. Nevertheless, agriculture and cattle production are prominent in the landscape of both study areas. Tree cover in these municipalities is mostly in the form of secondary forests and agroforests, with very little natural and conserved forest remaining.
Zozocolco de Hidalgo is located in the North of Veracruz in the Totonaca region. According to the 2000 census, all of its communities are rural, and 83% of its population was considered indigenous (INEGI, 2001). The municipality covers around 7000 ha and its elevation ranges from 100 to 700 meters above sea level (del Amo et al., 2008). The landscape of the municipality is characterized as a mosaic of natural forests, secondary forests, shade-grown coffee agroforests, pasture and agriculture. It has been molded for centuries by anthropogenic activities such as cultivation of maize, agroforestry practices for coffee, allspice and vanilla production, and pasture establishment for cattle rearing (del Amo et al., 2008). Natural vegetation in the region consists of medium to low tropical evergreen forests (del Angel-Pérez and Mendoza, 2004). However, very little conserved natural forest remains in the municipality located in few fragments on steep slopes, river banks and hill tops.
Zozocolco's economy is small and highly dependent on agricultural production. The annual value of crop production is around $980 000 (SAGARPA, 2006). After the coffee price crisis, allspice cultivation (interspersed with shade coffee) became the main income source in the area. Allspice represents on average 74% of Zozocolco's crop production value. The second most valuable crop is corn (including husks which are used for cooking tamales) which contributes 11%. Coffee only generates 10%, followed by Vanilla with 4%. Cattle production contributes an additional $594 000 to agricultural output for a total of $1.57 million. In 2000, 73% of the labor force worked in the agricultural sector and 48% did not receive wages largely due to subsistence farming (INEGI, 2001). Per capita income was $1 879 and 82% of the population received less than $2.80 per day. The infant mortality rate was 46.6 and the illiteracy rate was 30.6%. According to Consejo Nacional de Población (CONAPO, 2006), in 2005 Zozocolco had a marginalization index1 of 1.05 making it an area with a high degree of marginalization (4th highest out of 212 municipalities at the state level, and 78th out of 2 441 at the national level). Migration from Zozocolco historically has been primarily to major Mexican cities and money transfers back to Zozocolco have not been significant (Moctezuma Pérez, 2008).
Atzalan, located in the central area of Veracruz, is five times larger than Zozocolco. Elevations range from 100 to 2 040 meters above sea level, providing diverse microclimates and agro-ecological conditions that allow cultivation of a variety of different crops. Consequently, for this study, we only consider the lowland portion of the municipality below 700 m which has a surface area of around 25 500 ha. This allows for a more equivalent agro-ecological comparison with Zozocolco. The forested landscape of lowland Atzalan is also highly fragmented with large areas in perennial crops such as citrus and banana as well as pasture areas. As in Zozocolco, tree cover is also mostly represented by agroforests and secondary forests with very little conserved natural vegetation left.
Atzalan's crop production is more than ten times as valuable as Zozocolco's at $17.9 million (SAGARPA, 2006). Citrus production (lemon, orange, tangerine and grapefruit) accounts for 68% of the value. Banana cultivation has become an important income source in the area contributing 12% of the production value. Corn represents 9% and coffee production only 5%. Eighty-nine percent of the value is generated by crops that do not require tree canopy. Cattle production —also occurring on cleared land-contributes an additional $2 million to total agricultural Gross Domestic Product (GDP) for the municipality (SAGARPA, 2006). In 2000, 82% of the labor force worked in agriculture and 32% did not receive wages, again largely due to subsistence farming (INEGI, 2001). At this time the annual per capita income was $2 422 (29% higher than in Zozocolco) and only 1% of the population was considered indigenous. The infant mortality rate was 35.4 and the illiteracy rate was 24.5%. With a marginalization index of 0.19, Atzalan is the 42nd most marginalized municipality in Veracruz and the 412th in Mexico (CONAPO, 2006). Since 1990 there has been a substantial amount of migration from Atzalan to the United States (Mestries Benquet, 2003) resulting in significant levels of remittances.
LAND USE/LAND COVER CHANGE ANALYSIS
LULCC dynamics are assessed for Zozocolco and Atzalan based on remote sensing and Geographical Information Systems (GIS) analyses. Land use and land cover data for both municipalities were obtained for years 1973, 1984, 1989, 1993, 1996, 2000, 2003, and 2006 using LANDSAT and SPOT imagery. All images were pre-processed and underwent orthorectification and radiometric calibration using ERDAS Imagine 8.3.1. Image subsets were created for the municipality of Zozocolco and the lowland area of the municipality of Atzalan.
Land use and land cover data is derived for each image subset by applying a supervised classification method using training samples to produce spectral signatures for each land use/land cover class to guide the classification. Training samples developed for the more recent 2003 and 2006 image classifications were obtained from a set of ground truthing points collected in the field during 2007. The older LANDSAT images were classified by evaluating and comparing mean spectral signature plots for the land use/land cover classes relative to the LANDSAT 2003 image and using training samples with matching signature plots and located in points visually similar and unchanged relative to the 2003 image. The maximum likelihood algorithm in ERDAS Imagine 8.3.1 was used for the supervised classifications in order to generate three main land use/land cover classes for all images: 1) forest/ agroforest tree cover, 2) pasture and 3) agriculture.2 Water, urban areas, and clouds were excluded and masked out equally in all classified images.
The dynamics of LULCC in each study area were determined and compared by evaluating rates of change in land use and land cover during four periods: 1) 1973 to 1989, 2) 1989 to 1996, 3) 1996 to 2003 and 4) 2003 to 2006.3
Rates of change for each land use/land cover class transition are calculated by applying the formula dn = [S2/S1]1/n - 1, a standardized indicator for environmental monitoring in Mexico, where dn: rate of change, S2: land cover in time period two, S1: land cover class in time period one and n: number of years between time periods (Palacio-Prieto et al., 2004). If there is a loss of forest cover, for example, a negative rate is obtained, while an increase in forest cover results in positive rate of change.
Due to the difficulty and degree of accuracy involved in successfully separating agroforest from forest using remote sensing techniques, we determine agroforest regions based on field mapping and GIS techniques. A dataset containing 393 georeferenced parcels of coffee farmers in Zozocolco and Atzalan was obtained from the DIPROCAFE project. Using GIS techniques, each parcel polygon was converted to a point feature and point density analysis was applied to calculate the magnitude per unit area of coffee parcels (point features) that fall within the surface of the municipality. With the resulting surface layer indicating point density of coffee parcels, coffee agroforest regions in the municipality were then zoned and mapped based on those areas with the highest density values and occurrence of coffee parcels. ESRI ArcGIS 9.3 and Spatial Analyst were used for GIS procedures described above. This classification allows us to compare loss of tree cover inside and outside of these regions.
LANDSCAPE TRENDS
Remote sensing GIS analyses demonstrate very different LULCC dynamics occurring in Zozocolco and lowland Atzalan. Figure 2 shows the current (2006) landscapes in both study areas which are represented by heavily reduced and fragmented forest and agroforest tree cover and large areas under agriculture and pasture. Tree cover, represented by forests (natural and fallow) and agroforest, predominantly for coffee, is more prominent and less fragmented in Zozocolco compared to Atzalan. Land use for pasture is more prominent in Zozocolco, while in Atzalan, land use for agriculture predominates.
Trends in surface areas and percentages for the three land use/land cover classes are indicated in figure 3. In Zozocolco, forest and agroforest tree cover declines only slightly from 1973 to 1989, increases sharply from 1989 to 1996, and is followed by sharp decrease in tree cover from 1996 to 2003 which continues to decrease in the most recent period of 2003 to 2006. In 2006, tree cover amounted to 43% of the municipality. Lowland Atzalan shows a more consistent and slightly more severe reduction in forest/agroforest tree cover which in 2006 amounted to 38% of the study area.

Pasture in Zozocolco shows a sharp decrease from 1973 to 1996 followed by a sharp increase from 1996 to 2006, occupying almost 40% of the municipality in 2006 (figure 3). Agriculture, predominantly for maize, tends to be increasing, although it remains proportionally low in the landscape (18% in 2006). Conversely, pasture in lowland Atzalan shows a decreasing trend and accounts for around 20% of the total area in 2006, while agriculture, predominantly citrus and banana production, sharply increases, amounting to almost 40% of the study area.
Table 1 and figure 4 show the annual rates of change in land use/land cover for each period of analysis and in each study area. In Zozocolco, annual rates of change in tree cover show relative stability (—0.26) between 1973 and 1986, and a drastic regeneration of tree cover (2.12) between 1989 and 1996, mostly resulting from abandoned and regenerated pasture areas. Recent losses in tree cover are significantly high with annual rates of —3.89 and —2.07 from 1996 to 2003 and from 2003 to 2006 respectively. Agriculture and pasture increase very sharply between 1996 and 2003, while only pasture increases at a high rate between 2003 and 2006.


In lowland Atzalan, significantly high rates of tree cover loss are reported in all periods except between 1996 and 2003 where changes in tree cover are null (table 1 and figure 4). The highest deforestation rate (—2.57) is evident in lowland Atzalan in the most current period from 2003 to 2006. High rates of expanding areas in agriculture (citrus and bananas) are also apparent, particularly from 1989 to 1996 (6.67). On the other hand, high rates of decreasing pasture areas are demonstrated from 1989 to 2003 while recently pasture has been increasing.
We also evaluate changes in tree cover within and outside of our mapped coffee agroforest regions (table 1 and figure 4). This assessment provides a means to differentiate between tree cover loss that is predominantly associated with the conversion of coffee agroforests from tree cover losses predominantly associated with natural, secondary or fallow forests outside mapped coffee agroforest regions. Results for Zozocolco show consistently low rates of tree cover loss within coffee agroforest regions from 1973 to 2003, ranging from —0.32 to —0.47. However, the rate of tree cover loss increases substantially to —1.78 from 2003 to 2006. Conversely, loss of tree cover in coffee agroforest regions of lowland Atzalan between 1973 and 2003 has been much greater than in Zozocolco with annual rates ranging from —0.96 and —1.03. Nevertheless, loss of tree cover is much lower in agroforest regions of lowland Atzalan (—0.57) compared to Zozocolco during the latest period of 2003 to 2006.
Trends in tree cover outside of coffee agroforest regions in Zozocolco reflect the overall trends in the municipality. For example, the sharp increase in tree cover regeneration observed throughout the municipality from 1989 to 1996 is reflected in the high rate of regeneration outside agroforest regions (table 1 and figure 4). This regenerated tree cover consists of young fallow or secondary forests resulting from unutilized or abandoned pasture.
Moreover, the drastic loss of tree cover in Zozocolco experienced between 1996 and 2003 is also a result of high rates of tree cover converted to agriculture and pasture largely outside coffee agroforest regions. Between 2003 and 2006, however, tree cover loss has been much lower and even minimal outside agroforest regions compared to within, raising concerns about the current trend of agroforest tree cover loss in the municipality.
In lowland Atzalan, tree cover loss outside of coffee agroforest regions has been consistently high with rates ranging from —0.82 to —1.45, again with the exception of the 1996 to 2003 period where tree cover gain (0.74) is observed. However, recent trends indicate high rates of tree cover loss (—1.45) from 2003 to 2006.
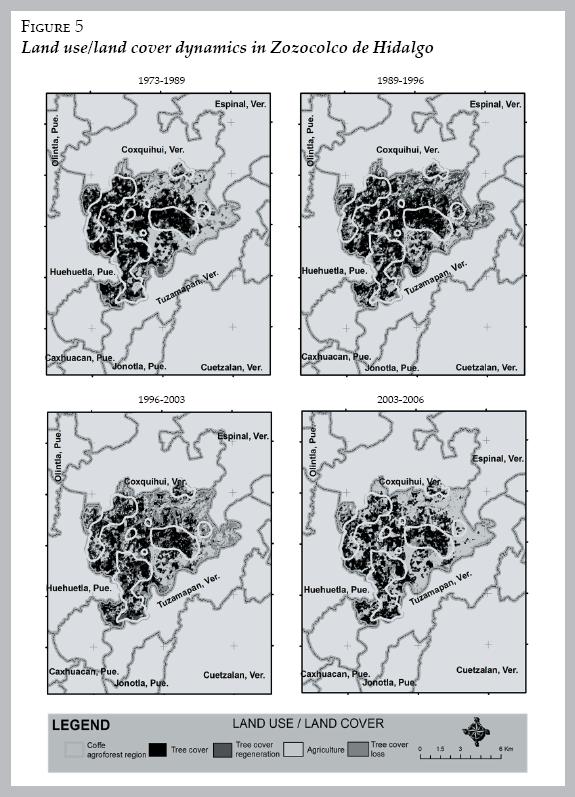
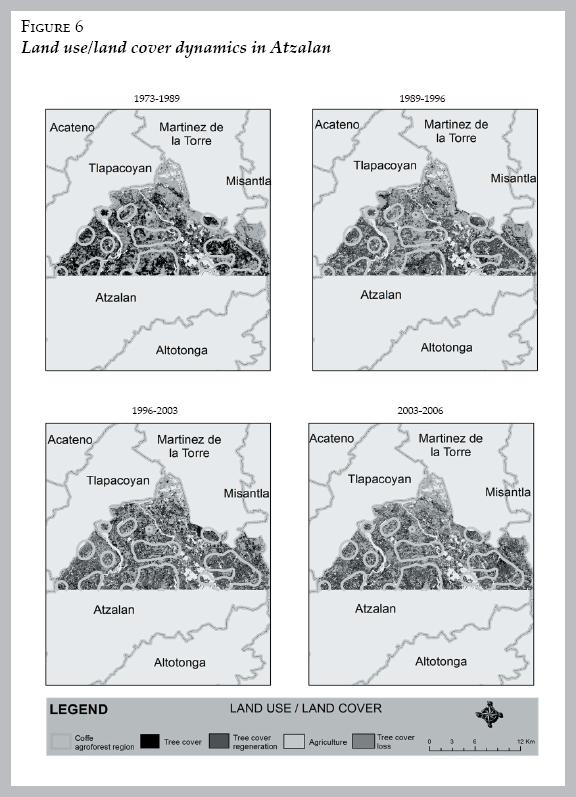
LULCC dynamics for each analysis period in Zozocolco and lowland Atzalan are spatially represented in figures 5 and 6 respectively. These maps show the general trends and patterns in LULCC and tree cover observed in both study areas and described above. Spatially explicit deforested, regenerated, forested and cleared areas can be assessed for each study period in both study areas as well as inside and outside of coffee agroforest regions. Because we are primarily interested in the effect of commodity price fluctuations on shade coffee growers, the following sections develop and estimate parcel-level econometric models to explain the observed trends in the coffee region of each municipality.
ECONOMETRIC MODELING FRAMEWORK
The economic literature on LULCC has shown that economic conditions can play an important role in determining changes in land use and land cover (Geist and Lambin, 2002; Lambin et al., 2001). Much of this literature uses discrete choice models to evaluate the statistical and economic significance of drivers of LULCC (e.g., Munroe, Southworth and Tucker, 2004; Chomitz and Thomas, 2003; Deininger and Minten, 2002; Nelson, Harris and Stone, 2001; Cropper, Puri and Griffiths, 2001; Lambin et al., 2001; Nelson and Hellerstein, 1997; Chomitz and Gray, 1996). These models typically assume that landowners are economically rational and tend to put their land to its most profitable use at any point in time. Although this might not always be the case —landowners may choose less profitable uses when the information available to them is imperfect or if they value non-market aspects of land use such as cultural traditions or environmental sustainability— there is nonetheless a strong incentive for landowners to use their land profitably in order to raise their standards of living, and this motivates the use of this modeling framework. Furthermore, and importantly for this analysis, these models are flexible enough to allow varying degrees of sensitivity to profitability, which is useful for determining the importance of profitability as a driver of LULCC.
A discrete choice model of LULCC assumes that a landowner selects one of J discrete uses for parcel i during year t, and that each use produces a payoff  . The landowner is assumed to know these payoffs and to select the land use with the highest payoff for each parcel at each point in time. The analyst cannot observe the payoffs exactly, but can observe certain state variables xijt that affect the payoffs; therefore each is modeled as a random variable with expectation
  , where βj is a parameter vector describing the impact of each variable on the expected payoff for land use j. It follows that
  , where εitj is a random variable with expectation equal to zero. If the εitj are independent and identically distributed Gumbel random variables, then the choice model is a multinomial logit (MNL) with the probability of observing land use j at parcel i in year t given by:
  . For a sample of land use observations, the log-likelihood function is given by:
  , with Yijt = 1 if parcel i is observed in land use j during year t. The analyst's goal is to find the most accurate description of LULCC by estimating the vectors βj that maximize L given the sample of observations on land uses y and state variables x.
For the case of landowners who presumably care about profitability, the natural specification for v(xijt, βj) is an approximation of the profit function. A simple profit function takes the form: Vjt = Pjtyjt - Cjt' xjt, where Pjt is the price per unit of product j during year t; yjt is the yield per hectare of product j; Cjt is a vector of per-unit input costs; and xjt is a vector of inputs per hectare. For this study, both Atzalan and Zozocolco are characterized by relatively high variability in output prices and yields through time, but relatively steady production practices and thus input costs (Raymundo Marcos-Martínez, personal communication, June 2008). Therefore we use the following specification: vjt = Pjtyjt - Cj, where Cj is the (constant) per-hectare cost of producing product j. To allow profit to vary across parcels based on observed characteristics, we define:  , where x has been expanded to include Vjt and a constant term to account for production costs.4
As described in the preceding sections, during our study window the important agricultural products in Atzalan were shade grown coffee, cattle, corn for grain, orange, lemon, and banana. In Zozocolco, they were shade grown coffee, allspice, cattle, and corn for grain and husks. For each of these products, we obtain historical state-level price and yield data from the Sistema de Información Agropecuaria de Consulta (siacon, 2007), and normalize prices to year 2000 pesos using the Índice Nacional de Precios al Consumidor Agropecuarios (Banco de Mexico, 2007).5 Furthermore, to make the modeling framework empirically tractable and because it is difficult to distinguish between some of these products in our remote sensing data, we construct land use categories that are somewhat different from those used in the preceding sections. For Atzalan we estimate a model with four categories: agroforestry (shade grown coffee), pasture and field crops (cattle and corn for grain), perennial tree crops (orange, lemon, and banana), and fallow. We group pasture and annual crops not only because they both involve complete loss of tree canopy but also because our economic data suggests these uses generate relatively low but steady profit. Likewise we group orange, lemon, and banana not only because each provides some amount of canopy and soil retention benefit, but also because our economic data suggests these uses generate relatively high but variable profit. For Zozocolco, using similar reasoning, we estimate a model with three categories: agroforestry (shade grown coffee and allspice), pasture and field crops (cattle and corn for grain and husks), and fallow.
To construct a price index for each land use category, we do three things. First, when a category includes multiple products, we construct a weighted per-hectare price according to the total area harvested for each product in the category. Second, because only relative payoffs affect choices in a discrete choice framework, we normalize these prices using inflation-adjusted state-level GDP per capita6; thus we set βfallow = 0 for model identification. And third, because landowners tend to be unresponsive to short-term fluctuations in prices and yields, particularly when switching land uses entails large costs as it does in agriculture, but become more likely to switch if revenues remain low for an extended duration of time (Raymundo Marcos-Martínez, personal communication, June 2008), we average each category-specific per-hectare price over five years  .
.
To populate the matrix of observed land uses y for each municipality, we randomly select from the remote sensing data within and immediately surrounding the coffee regions 163 parcels for Atzalan and 115 parcels for Zozocolco. We test these samples to ensure no statistically significant spatial autocorrelation.7 To populate the matrix of state variables x, we derive fixed parcel features that might affect LULCC from the remote sensing GIS data: elevation, slope, distance to road, distance to market, and soil texture. Last, we append population data for each municipality to control for its associated land use pressure. With seven observations on each parcel8 (1984, 1989, 1993, 1996, 2000, 2003, and 2006), we have 1141 observations for Atzalan and 805 observations for Zozocolco. Summary statistics are provided in table 2.

ECONOMETRIC MODELING RESULTS
Each model is estimated in Gauss (Aptech Systems 2003) using the Constrained Optimization solver to maximize the likelihood function. Table 3 shows the estimated coefficient vectors (βj), standard errors, and significance levels. Overall results are mixed, but some patterns emerge. The coefficients on normalized price for Atzalan tend to be larger and more significant than for Zozocolco, and also tend to have the intuitively correct sign; but the tree crops coefficient has a significant but counterintuitive sign. We interpret this correlation to the relatively high but declining price of tree crops during our study period: despite the declining price, these products remain relatively profitable and thus continue to be planted by more and more landowners. Price coefficients in Zozocolco are substantially smaller and not significantly different from zero. However, the magnitude of the effect of a variable cannot be judged simply by examining the magnitude of the coefficient in nonlinear models like these. Therefore we calculated the average marginal effect of a change in each variable in each model, and found that price effects in Atzalan are at about 10 times larger than in Zozocolco. These results seem consistent with qualitative observations from the two municipalities: Atzalan being more market-oriented and Zozocolco being more traditional and disconnected from trade. We revisit the implications of price sensitivity later with our policy simulations.
The coefficient estimates on population also seem to have the intuitively correct sign: increased population pressure tends to lead to less agroforestry and more pasture and ield and tree crops (for both subsistence and greater cash income). The remaining variables in table 2 are parcel-specific and do not vary through time. Although slope is generally not very significant, greater land slope tends to be associated with agroforestry and lesser slope with pasture and field and tree crops. Elevation has a positive and significant effect on the occurrence of agroforestry and a negative but insignificant effect on the occurrence of other land uses. All of this is consistent with intuition and informal observation in the study areas. Estimation results for the two distance variables are interesting and mostly intuitive. Tree crops tend to be closer to roads and markets, consistent with the emphasis on these products as cash crops that must be transported to market. Pasture and field crops tend to be closer to roads but further from markets, consistent with their occurrence at lower elevations (where roads tend to be located) and reliance on field crops for self-consumption rather than market sale. Agroforestry in Atzalan tends to be further from roads and closer to markets, while the opposite holds in Zozocolco. While the effect of roads is not significant, that of markets is and likely reflects the greater market orientation of landowners in Atzalan.
The models also can be compared in terms of how well they it the observed land use data. The Atzalan model correctly predicts 52% of the observed land uses while the Zozocolco model correctly predicts 60%. However, the Atzalan model has four land use categories while the Zozocolco model only has three; therefore random guessing should produce only 25% correct predictions in Atzalan versus 33% in Zozocolco. Therefore the Atzalan model does about 2.08 times better than random guessing while the Zozocolco model does about 1.81 times better. These are fairly similar performances. However, one area in which the Atzalan model performs noticeably better than the Zozocolco model is in predicting canopy loss (i.e., conversion from agroforestry to another land use). In the Atzalan dataset there are 83 instances of canopy loss of which the model correctly predicts 19 (23% correct); in the Zozocolco dataset there are 30 instances of canopy loss of which the model correctly predicts none. Overall it seems that the behavior of landowners in Atzalan lends itself better to the modeling framework used here.
POLICY SIMULATIONS
It is straightforward to use the estimated models to simulate the effects on land use decisions that various economic policies might have. For example, production subsidies (government payments over and above market prices) and price floors (minimum guaranteed prices) have been used in many countries across different economic sectors to encourage production of certain goods. The United States continues to provide massive financial incentives for its agricultural producers, who respond with greater production levels than they would otherwise choose. The ongoing DIPROCAFE project provides another similar type of incentive: by helping farmers identify and produce viable shade crops, the reward for using an agroforestry system is increased and presumably the likelihood that canopy will be maintained is increased, leading to fewer instances of canopy loss. However this outcome obviously depends not only on the magnitude of the incentive but also on the sensitivity of the local population to the incentive.
One advantage of the simple modeling framework used here is that the exact form of the incentive does not need to be specified in order to simulate its effect; rather the incentive can be expressed as the net impact on the revenue from agroforestry. Staff from the DIPROCAFE project estimated the likely economic effects of the proposed agricultural diversification efforts at the parcel level. Two coffee-related agroforestry systems were considered, and it was estimated that such systems could raise profit per hectare for coffee parcels from around $60 annually to around $600 annually at year 2004 prices (Raymundo Marcos-Martínez, personal communication, January 2010). In our modeling framework, and assuming similar effects in other years, this change is equivalent to roughly doubling the revenue earned from coffee without changing the production costs.9 Table 4 and figure 7 show the simulated effect such a policy would have on the occurrence of agroforestry parcels in both municipalities. The policy has a substantially larger anticipated effect in Atzalan where the average number of agroforestry parcels increases from 86 to 116 (35%), versus in Zozocolco where the average number increases only from 68 to 70 (3%). This order-of-magnitude difference in relative land use effects across municipalities directly reflects the large difference in estimated price sensitivities reported earlier.


Government support policies like DIPROCAFE and others not only affect land use and environmental quality, but also personal welfare and economic standards of living for landowners. For discrete choice models, it is straightforward to calculate the welfare effects of such a policy in terms of the anticipated change in the expected value of the land use decision facing the landowner. For the multinomial logit model, it is well-known that:10

Therefore it is possible to calculate the expected value with and without the policy, for each parcel in each municipality, and to compare relative changes in average welfare across municipalities. We do this for the DIPROCAFE simulation and ind that such a policy would raise the modeled welfare in Atzalan by nearly 25% on average, while increasing the welfare in Zozocolco by only 2.3%. Again, this is an order-of-magnitude difference in relative effects that is consistent with the characteristics of the municipalities.
Given these results, it would seem that a strong argument could be made to prioritize government support efforts in places like Atzalan where a substantial amount of deforestation will be prevented and modeled welfare effects will be positive and signiicant, as opposed to places like Zozocolco where both effects are likely to be small. While this is true, such an approach would overlook the existing disparity in marginalization across municipalities and would lead to increased inequality by making the population of Zozocolco relatively even poorer; it also would perversely reward opportunistic landowners who are more likely to cut down tree canopy rather than preserve it and the public benefit it provides.
CONCLUSIONS
This article demonstrates how common commodity price fluctuations can have very different effects on land use decisions at the local level, even within a relatively small geographic region. For this case study, the more marginalized population of Zozocolco has responded to the sharp decline in the coffee price largely by maintaining shade canopy, either through temporary abandonment of coffee parcels or by augmenting parcels with allspice, and relying to a greater extent on subsistence farming. The less marginalized population of Atzalan has responded by clearing more shade canopy primarily for the production of tree crops for cash income. Our estimation and simulation results show that government programs like DIPROCAFE are likely to be substantially more successful in terms of ecological goals in places like Atzalan; however the income assistance provided by such programs would do more to reduce inequality if it were focused on places like Zozocolco.
We draw three main conclusions from this study. First, based on a LULCC analysis like this one, a government with a limited budget for programs like DIPROCAFE may face a difficult decision: allocate scarce resources where they will provide the greatest measurable environmental and economic benefits; or allocate those resources to the most marginalized communities where they will produce substantially smaller measurable benefits but will decrease inequality. In such a case, direct inquiry into the nature of inequality and the social benefits of reducing it would be needed. This article adopts a definition of inequality that is based on income and assumes that reductions in income disparity necessarily and beneficially reduce inequality. However other deinitions could be used that might be based on access to educational and employment opportunities or stated measures of satisfaction or happiness. Indeed the complete elimination of income inequality may not be socially optimal if the source of the inequality is preference heterogeneity across cultures or other subpopulations that leads to (voluntary) income disparity. However such an investigation is beyond the scope of this work and typically not well informed by LULCC datasets like this one.
The second related conclusion is that this problem involving multiple goals —environmental preservation and inequality reduction— exemplifies the principle that multiple policy instruments are likely needed to achieve an efficient or cost-effective outcome. Programs like DIPROCAFE appear useful and appropriate for preventing deforestation in areas like Atzalan that are more prone to canopy-reducing land use change. However they certainly are not the only option for reducing inequality, and may in fact be a very costly method for doing so in areas that are not prone to canopy loss. Although it is well beyond the scope of this work to recommend a preferable approach for addressing income inequality, we think it is necessary for responsible governments to undertake such an assessment before investing in any large-scale efforts that aim to accomplish both goals with a single policy.
Our third conclusion is that governments must be careful when extrapolating the results of pilot studies. A pilot study of a program like DIPROCAFE conducted in a municipality like Atzalan could lead to the erroneous conclusion that similar amounts of canopy preservation would be expected in the nearby and, by many measures, similar municipality of Zozocolco. Information about locally varying socioeconomic and cultural differences would be needed to inform such extrapolation in order to correctly predict the policy effects out-of-sample. In this case, for example, the remittances sent to Atzalan have been important for many farmers trying to finance the conversion of agroforestry to cash crops (Raymundo Marcos-Martínez, personal communication, March 2010), but this source of capital is not available in Zozocolco. This effectively constrains farmers in Zozocolco to a smaller set of less capital-intensive land uses and contributes to persistent inequality through time.
The analysis presented here could be improved in several ways. The statistical model is relatively simple and could more closely represent the decision environment facing small holder farmers in this region. For example, it could account for forward-looking behavior (anticipation of price changes in the future), risk preferences, and credit constraints. It also would be useful to explicitly account for abandoned (fallowed) agroforestry parcels, even though it is not possible to directly distinguish these from working parcels in the GIS dataset; the expectation-maximization algorithm might lend itself well to this task. It also would be helpful to include the effects of previous commodity support programs on land use decisions. Although we have collected some of this information, additional interviews with farmers in the study area are needed to complete and verify the dataset. We plan to do this in the future.
REFERENCES
Banco de Mexico, 2007. Indice Nacional de Precios al Consumidor Agropecuarios. Available at: <http://www.banxico.gob.mx/SieInternet/consultarDirectorioInternetAction.do?accion=consultarCuadroAnalitico&idCuadro=CA55§or=8&locale=es> [Last accessed September 2007] [ Links ].
Blackman, A., Albers, H.J., Ávalos-Sartorio, B. and Murphy, L.C., 2008. Land cover in a managed forest ecosystem: Mexican shade coffee. American Journal of Agricultural Economics, 90, pp. 216-231. [ Links ]
Chomitz, K. and Gray, D.A., 1996. Roads, land use, and deforestation: a spatial model applied to Belize. World Bank Economic Review, 10, pp. 487-512. [ Links ]
Chomitz, K. and Thomas, T., 2003. Determinants of land use in Amazonia: a fine-scale spatial analysis. American Journal of Agricultural Economics, 85, pp. 1016-1028. [ Links ]
CONAPO (Consejo Nacional de Población), 2006. Indices de Marginarán 2005. Mexico: CONAPO. [ Links ]
Cropper, M.L., Puri, J. and Griffiths, C., 2001. Predicting the location of deforestation in North Thailand: the role of roads and protected areas. Land Economics, 77 (2001), pp. 172-186. [ Links ]
Deininger, K. and Minten, B., 2002. Determinants of deforestation and the economics of protection: an application to Mexico. American Journal of Agricultural Economics, 84, pp. 943-960. [ Links ]
del Amo Rodríguez, S. et al, 2008. Plan de Ordenamiento Ecológico de participación comunitaria del Municipio de Zozocolco de Hidalgo, Veracruz. [Libro digital] Veracruz, México: Universidad Veracruzana. [ Links ]
del Angel-Pérez, A.D. and Mendoza M.A. 2004. Totonac homegardens and natural resources in Veracruz, Mexico. Agriculture and Human Values, 21, pp. 329-346. [ Links ]
DIPROCAFE, 2006. Encuestas agronómicas y socioeconómicas. Veracruz, México: Centro de Investigaciones Tropicales, Universidad Veracruzana. [ Links ]
FAO (Food and Agriculture Organization), 2006. Global Forest Resources Assessment2005: Progress towards sustainable forest management. FAO Forestry Paper 147. Rome: FAO. [ Links ]
García, E., 1988. Modificaciones al Sistema de Clasificación Climática de Koppen, 4th ed. Mexico: Offset Larios. [ Links ]
Geist, H.J. and Lambin, E.F., 2002. Proximate causes and underlying driving forces of tropical deforestation. BioScience, 52, pp. 143-150. [ Links ]
Gordon, C., Manson, R., Sundberg J. and Cruz-Angón, A., 2007. Biodiversity, profitability, and vegetation structure in a Mexican coffee agroecosystem. Agriculture, Ecosystems and Environment, 118, pp. 256-266. [ Links ]
Hanemann, M., 1999. Welfare analysis with discrete choice models. In: J.A. Herriges and C.L. Kling, eds. Valuing Recreation and the Environment Cheltenham: Edward Elgar, pp. 33-64. [ Links ]
INEGI (Instituto Nacional de Estadística y Geografía), 2001. XII Censo General de Población y Vivienda 2000, Mexico: INEGI. [ Links ]
ICO (International Coffee Organization), 2010. Trade Statistics. Available at: <http://www.ico.org/trade_statistics.asp> [Last accessed February 2010] [ Links ].
Keys, E. and Chowdhury, R., 2006. Cash Crops, smallholder decision-making and institutional interactions in a closing-frontier: Calakmul, Campeche, Mexico. Journal of Latin American Geography, 5(2), pp. 75-90. [ Links ]
King, A., 2007. Trade and Totomoxtle: livelihood strategies in the Totonacan region of Veracruz, Mexico. Journal of Agriculture and Human Values, 24(1), pp. 29-40. [ Links ]
Lambin E.F. et al, 2001. The causes of land-use and land-cover change: moving beyond myths. Global Environmental Change, 11, pp. 261-269. [ Links ]
Mestries Benquet, F., 2003. Crisis cafetalera y migración internacional en Veracruz. Migraciones Internacionales, 2(2), pp. 121-148. [ Links ]
Moctezuma Pérez, S., 2008. Ambiente, cafeticultura y migración: Los indígenas Totonacos de Naranjales, Mecatlan, Veracruz Master's thesis Universidad Iberoamericana. [ Links ]
Munroe, D., Southworth, J. and Tucker, C., 2004. Modeling spatially and temporally complex land-cover change: the case of western Honduras. Professional Geographer, 56, pp. 544-559. [ Links ]
Nelson, G., Harris, V and Stone, S., 2001. Deforestation, Land use and property rights: empirical evidence from Darien, Panama. Land Economics, 77, pp. 187-205. [ Links ]
Nelson, G.C. and Hellerstein, D., 1997. Do Roads cause deforestation? Using satellite images in econometric analysis of land use. American Journal of Agricultural Economics, 79, pp. 80-88. [ Links ]
Overmars, K.P. and Verburg, P.H., 2005. Analysis of land use drivers at the watershed and household level: linking two paradigms at the Phillipine forest fringe. International Journal of Geographical Information Science, 19, pp. 125-152. [ Links ]
Palacio-Prieto, J.L. et al, 2004. Indicadores para la caracterización y ordenamiento territorial. México: Secretaría de Medio Ambiente y Recursos Naturales (SEMARNAT)-Instituto Nacional de Ecología (INE). [ Links ]
Pearce, D. and Mourato, S., 2004. The economic valuation of agroforestry's environmental services. In: G. Schroth et al, eds. Agroforestry and Biodiversity Conservation in Tropical Landscapes. Washington, D.C.: Island Press. [ Links ]
Rindfuss, R.R. et al., 2004. Developing a science of land change: challenges and methodological issues. PNAS, 101(39), pp. 13976-13981. [ Links ]
Romero Leon K., Houston, J.H. and Epperson, J.E., 2006. Diversification in Low-grade coffee-growing areas of Veracruz, Mexico: market possibilities. Journal of Food Distribution Research, 37, pp. 143-148. [ Links ]
SAGARPA (Secretaría de Agricultura, Ganadería, Desarrollo Rural, Pesca y Alimentación), 2006. Servicio de Información y Estadística Agroalimentaria y Pesquera, México: SAGARPA. [ Links ]
SEMARNAT (Secretaría de Medio Ambiente y Recursos Naturales), 2005. Informe de la situación del medio ambiente en México; compendio de estadísticas ambientales, México: SEMARNAT/PNUD. [ Links ]
SIACON (Sistema de Información Agropecuaria de Consulta), 2007. Available at: <http://www.oeidrus-tamaulipas.gob.mx/cd_anuario_06/SIACON_2007.html>[Last accessed September 2007] [ Links ].
Somarriba, E. et al., 2004. Biodiversity conservation in neotropical coffee (coffee arabica) Plantation. In: G. Schroth et al, eds. Agroforestry and Biodiversity Conservation in Tropical Landscapes. Washington, D.C.: Island Press. [ Links ]
Vázquez García, V, 2001. Coffee production and household dynamics: the Popolucas of Ocotal Grande, Veracruz. Agriculture and Human Values, 18, pp. 57-70. [ Links ]
Verburg, P.H., Schot, P.P., Dijst, M.J. and Veldkamp, A., 2004. Land use change modeling: current practice and research priorities. GeoJournal, 61, pp. 309-324. [ Links ]
* JEL: Journal of Economic Literature-Econlit.
The authors are grateful for funding from the University of California Institute for México and the United States (UC-MEXUS) and the Consejo Nacional de Ciencia y Tecnología de México (CONACYT). We thank Dan Bromley for help with earlier drafts of this article, Irving Uriel Hernández Gómez and César Gallo Gómez for their support with GIS processing and field work, Marisol Martínez Bello for her support with remote sensing, and Emma Cesta Arrieta and Edgar Chavez Garrido for their help with conducting surveys and interviews. We also thank the municipal authorities and farmers of Atzalan and Zozocolco de Hidalgo, Veracruz, and the Diversificación Productiva de Cafetales de Baja Altitud (DIPROCAFE) project.
1 The marginalization index incorporates data about education, housing, and income to characterize overall socioeconomic conditions. This index ranges from —2.00 to 3.23 throughout Mexico, with lower values corresponding to a better welfare status (CONAPO, 2006).
2 The agriculture category for Zozocolco includes only corn. For Atzalan, it includes corn, citrus, and banana. A somewhat different classification is used for the econometric model presented in section five.
3 Some image years (1984, 1993, and 2000) were dropped in order to focus on longer-scale trends in this section; the econometric model makes use of all image years except 1973 which predates available price data.
4 This constant term also accounts for other product-specific attributes that influence land use decisions.
5 For price and yield data on corn husks, we rely on data from del Amo et al. (2008) and King (2007).
6 We interpret this as the "price" for fallow land because it represents the reward from not farming and instead inding employment in the broader economy.
7 The Moran's I global index for each time period is less than 0.11, providing evidence of insignificant spatial autocorrelation in the data.
8 This panel is substantially longer than those used by LULCC studies cited herein, and thus is well-suited for investigating price effects.
9 Recall that production costs are included in the constant term in this modeling framework.
10 See, for example, Hanemann (1999).

