


 text new page (beta)
 English (pdf)
 Article in xml format
 Article references
 Send this article by e-mail
 Cited by SciELO
  Similars in
SciELO
Similars in
SciELO 
 Permalink
1. INTRODUCTION
Metallicity gradients in disk galaxies, provided by the analysis of the chemistry of H II regions at different galactocentric distances, have been long studied (Aller 1942; Searle 1971, and many others), as such an analysis gives information on the chemical history of the host galaxy. The history of star formation and the processes of accretion and mass loss in a galaxy can be determined by using chemical evolution models that reproduce the present chemical abundances of the interstellar medium (ISM) using the abundances of H II regions as constraint. See e.g., Carigi & Peimbert (2011).
It has been found that the metallicity gradients obtained from H II regions and other indicators are always negative, that is, chemical abundances are lower at larger galactocentric distances. Many galaxies have been analyzed showing the same result. Recently Sánchez et al. (2014) analyzed the O abundance in a large number of H II regions in more than 300 galaxies observed by the CALIFA survey, reporting that in many galaxies with H II regions detected beyond two disk effective radII the slope presents a flattening at large distances and, in some cases, a drop or truncation of the O abundance occurs in the inner regions.
Since some time ago the abundances determined for PNe are also being used to analyze the chemical gradients in galaxies. Among the oldest studies of PNe in the Milky Way are those of D’Odorico, Peimbert, & Sabbadin (1976) and Kaler (1980). As PNe are objects with ages between 1 and 10 Gyr, they provide information of the past ISM abundances, helping then in the determination of the evolution of the chemical abundances in a galaxy, and providing additional constraints for chemical evolution models (Hernández-Martínez et al. 2011).
Oxygen is the most used element to determine the chemistry of H II regions because its abundance is well determined by just adding the ionic abundances of O+ and O ++, whose lines are observed in the visual range of wavelengths. The determination of ionic abundances requires the determination of physical conditions in the plasma, in particular the electron temperature, which can be derived also in the visual range by detecting the faint auroral lines [OIII] λ4363 and [NII] λ5755, in order to use the so called direct-method to determine abundances.
Gradients based on oxygen abundances have been also calculated from PN data, although for the case of highly ionized objects a correction due to the presence of O+3 is required. However, it has been shown that O in PNe may be enriched (or depleted) due to stellar nucleosynthesis, particularly in low-metallicity environments (Peña, Stasińska, & Richer 2007; Flores-Durán, Peña, & Ruiz 2017) and also in Galactic PNe with carbon-rich dust (Delgado-Inglada et al. 2015). Therefore, metallicity gradients derived from O abundances in PNe could be perturbed by stellar nucleosynthesis and thus this element would be not adequate to analyze the chemical gradients and the evolution of galaxies. Apparently Ne abundances are also modified by stellar nucleosynthesis in low-metallicity environments (Karakas 2010; Milingo et al. 2010; Flores-Durán, Peña, & Ruiz 2017). On the other hand, Ar and S abundances in PNe are not expected to be modified in such processes during the PN progenitor lifetime, although their abundance determinations have large uncertainties due to large uncertainties in the ionization correction factors when only one ion (Ar++ or S+) is observed (Delgado-Inglada, Morisset, & Stasińska 2014). Especially, the S abundance presents several problems, like ‘the Sulphur anomaly’. See e.g., Henry et al. (2010).
In this work we propose to use Ar/H, together with O/H and Ne/H abundance ratios, to trace the PN metallicity gradients in the galaxies of the local universe: M 31, M 33, NGC 300, and the Milky Way (MW). Gradients of PNe will be discussed in comparison with those of H II regions. In §2 we present the data used for the different galaxies. In §3 the abundance gradients are calculated for each galaxy. In §4 our results are presented and discussed, and our conclusions are indicated in §5.
2. DATA ACQUISITION
Data used in this work consist of abundances and galactocentric distances of PNe and H II regions of the spiral galaxies M 31, M 33, NGC 300, and the Milky Way. Most data were obtained from the liter-ature trying to include only abundances calculated with the direct-method (determined electron temperature), in a homogeneous way by one group of authors. However, in some cases data from different sources have been included in order to obtain a larger sample of objects for statistical studies, covering as large a galactic radius as possible. This introduced some degree of inhomogeneity that has been minimized by adopting only objects with determined electron temperature and by using recent ionization correction factors. We selected samples where O, Ne, and Ar abundances were available.
We intend to build gradients based only on data from genuine PNe and H II regions. Therefore, for all the galaxies, we carefully selected as genuine PNe those objects where the [OIII] λ5007 intensity relative to Hβ is larger than 3, because a lower value could correspond to a compact H II region and not to a bona-fide PN. This criterion has been used, for instance, by Ciardullo et al. (2002) to select PNe to build the PNLF in external galaxies. On the other hand, H II regions showing an [OIII] λ5007 intensity larger than 3 times Hβ were eliminated from the sample because these objects could correspond to nebulae around WR stars or SN remnants, whose abundances can be contaminated by the processes in the central stars and would not correspond to abundances of authentic pre-star nebulae.
In Table 1 we present several characteristics of the galaxies, such as their Hubble type, mass, distance to the Milky Way and the optical radius R25 (the 25 mag arcsec−2 isophotal radius).
TABLE 1 CHARACTERISTICS OF GALAXIES
| Name | Hubble Type |
Mass M⊙ |
Dist. (kpc) |
O/H(a) | R25 (kpc) |
Refs. R (b)25 |
|---|---|---|---|---|---|---|
| M 31 | SA(s)b | 1.5E12 | 785 | 8.8 | 20.6 | D14 |
| MW | SBbc | 8.0E11 | - | 8.8 | 11.5 | S-M18 |
| M 33 | SA(s)cd | 5.0E10 | 849 | 8.5 | 9.0 | M07 |
| NGC 300 | SA(s)d | 3.5E10 | 1880 | 8.6 | 5.3 | B09 |
a)O/H is the abundance at R = 0, 12+log O/H, for H II regions.
b)D14: Draine et al. (2014), M07: Magrini, Corbelli, & Galli (2007), B09: Bresolin et al. (2009), S-M18: Sánchez-Menguiano et al. (2018).
2.1. M 31
The well known M 31 is the most massive spiral galaxy in the Local Group. It is at a distance of 785 kpc from the Milky Way (McConnachie et al. 2005).
Chemical gradients calculated from the abundances of H II regions have been studied by several authors, mostly based on abundances derived by using strong-line methods because due to the high metallicity in this galaxy, the auroral lines indicative of electron temperature, such as [OIII]λ4363 and [NII]λ5755, are faint and difficult to detect. The largest sample analyzed in this way is the one by Sanders et al. (2012), which included 192 H II regions. They reported an O abundance gradient of about −0.0195 ± 0.0055 dex kpc−1, but found that the slope depended on the choice of the strong-line method used.
Zurita & Bresolin (2012) obtained abundances based on the direct-method for 31 H II regions con-centrated at two galactocentric distances of 3.9 and 16.1 kpc. These authors discussed the O/H abun-dance gradient finding a robust negative slope of ΔO/H / ΔR = −0.023 dex kpc−1, based on both the direct-method and the strong-line method. This value is similar to the values reported by other authors, based on strong-line methods (Zaritsky, Kennicutt, & Huchra 1994; Sanders et al. 2012).
Interestingly, Zurita & Bresolin (2012) found that abundances determined with the direct-method for their H II regions are lower, by about 0.3 dex, than the values determined with the strong-line methods and the values derived for supergiant stars, at any galactocentric distance. The authors attribute this discrepancy to a bias in their sample, which would not be representative of the mean H II region population (because only high-temperature, and thus low-metallicity regions could be detected in their search), and to the probable depletion of O in dust grains. The abundance data for H II regions used in this work, are taken from Zurita & Bresolin (2012).
Data for PNe were collected from the articles by Kwitter et al. (2012); Sanders et al. (2012); Balick et al. (2013); and Fang et al. (2013, 2015). The use of data from different authors can introduce undesirable inhomogeneities. Therefore, in order to analyze chemical abundances on a more homogeneous system, physical conditions and ionic abundances of PNe were recalculated by us from the extinction-corrected line intensities published by the cited authors. The IRAF 2.16 five level nebular modelling package “stsdas.analysis.nebular”, with the tasks temden and ionic , was employed to determine the physical conditions and ionic abundances. For the full sample the [O III] temperature was derived and occasionally the [N II] temperature was available, but all the ionic abundances were calculated with the [O III] temperature (one-temperature zone model). Total abundances were derived from the ionic abundances by using the ionization correction factors (ICFs) by Delgado-Inglada, Morisset, & Stasińska (2014) which correct for the ions not seen. The results, although not too different from the ones published by the cited authors, are now in a homogeneous system.
The PN distribution in this galaxy extends up to R/R25 ≈ 5 (R ≥ 100 kpc) while data for the H II regions cover only up to R/R25 ≈ 1 (R ≈ 20 kpc).
The galactocentric distances used in the diagrams for the gradients were collected from the same references used for the abundance ratios.
2.2. M 33
M 33 is the third most-massive spiral galaxy in the Local Group. Its Hubble type is very late, SA(s)cd, and its mass is much lower than the masses of the Milky Way and M 31, by factors of 16 and 30 respectively. It is located at 849 kpc from the Milky Way and appears almost face-on. The central metallicity in M 33 as given by H II regions, 12 + log O/H = 8.5, is lower than that of the bigger spirals, and it is even lower than that of NGC 300 (see Table 2).
TABLE 2 LINEAR FITS FOR METALLICITY GRADIENTS IN M 31, THE MILKY WAY, M 33, AND NGC 300
| Oxygen | Neon | Argon | ||||||||||
|---|---|---|---|---|---|---|---|---|---|---|---|---|
| X0 | err | ΔX/ΔR dex/kpc | err | X0 | err | ΔX/ΔR dex/kpc | err | X0 | err | ΔX/ΔR dex/kpc | err | |
| M 31 | ||||||||||||
| All PNe | 8.46 | 0.03 | -0.001 | 0.001 | 8.01 | 0.04 | -0.002 | 0.001 | 6.22 | 0.05 | -0.002 | 0.001 |
| Type I | 8.43 | 0.03 | -0.002 | 0.001 | 8.03 | 0.05 | -0.004 | 0.002 | 6.31 | 0.09 | -0.005 | 0.002 |
| non-Type I | 8.57 | 0.03 | -0.003 | 0.001 | 8.01 | 0.06 | 0.000 | 0.001 | 6.17 | 0.07 | -0.000 | 0.001 |
| H II reg. | 8.76 | 0.10 | -0.030 | 0.007 | 7.99 | 0.23 | -0.036 | 0.016 | 6.38 | 0.18 | -0.021 | 0.013 |
| MW | ||||||||||||
| All PNe | 8.85 | 0.05 | -0.024 | 0.003 | 8.20 | 0.03 | -0.021 | 0.005 | 6.58 | 0.03 | -0.018 | 0.015 |
| Type I | 8.75 | 0.05 | -0.019 | 0.002 | 8.24 | 0.06 | -0.026 | 0.014 | 6.60 | 0.02 | -0.010 | 0.006 |
| non-Type I | 8.84 | 0.05 | -0.022 | 0.003 | 8.20 | 0.05 | -0.027 | 0.009 | 6.45 | 0.03 | -0.018 | 0.006 |
| H II reg. | 8.79 | 0.05 | -0.040 | 0.005 | 8.21 | 0.04 | -0.027 | 0.012 | 7.18 | 0.14 | -0.071 | 0.029 |
| M 33 | ||||||||||||
| All PNe | 8.34 | 0.07 | -0.038 | 0.016 | 7.70 | 0.06 | -0.036 | 0.030 | 6.17 | 0.06 | -0.031 | 0.014 |
| Type I | 8.52 | 0.34 | -0.032 | 0.020 | 7.83 | 0.40 | -0.039 | 0.050 | 6.31 | 0.25 | -0.058 | 0.030 |
| non Type I | 8.34 | 0.15 | -0.010 | 0.020 | 7.59 | 0.15 | -0.024 | 0.015 | 6.01 | 0.11 | -0.010 | 0.020 |
| H II reg. | 8.48 | 0.03 | -0.047 | 0.008 | 7.76 | 0.04 | -0.043 | 0.010 | 6.34 | 0.04 | -0.064 | 0.016 |
| NGC 300 | ||||||||||||
| PNe | 8.37 | 0.03 | -0.030 | 0.011 | 7.65 | 0.03 | -0.029 | 0.013 | 6.31 | 0.02 | -0.051 | 0.014 |
| H II reg. | 8.57 | 0.03 | -0.077 | 0.008 | 7.71 | 0.05 | -0.065 | 0.016 | 6.33 | 0.04 | -0.104 | 0.017 |
Gradients from PN abundances were given by Magrini, Stanghellini, & Villaver (2009) and Bresolin et al. (2010) who found that the slopes were equal to the ones of H II regions, or flatter.
For this galaxy, PN data were collected from Bresolin et al. (2010) and Magrini et al. (2010), and H II region data from Magrini et al. (2010). The distributions of H II regions and PNe extend up to R/R25 ≃ 1 (R ≈ 9 kpc). As said in the Introduction, in the sample of PNe we excluded those objects showing [OIII]λ5007/Hβ intensity ratios smaller than 3 and, consistently, for the H II regions we excluded the objects showing ratios larger than 3. This is to avoid contamination by compact H II regions in the PN sample, and to avoid contamination by supernova remnants, W-R nebulae and other highly ex-cited objects in the H II region sample. Our diagrams then contain only genuine PNe and H II regions.
The galactocentric distances employed to build the gradient diagrams were calculated by us, according to the procedure described by Cioni (2009).
2.3. NGC 300
The almost face-on spiral NGC 300 is the least massive galaxy of the sample studied here and the only one outside the Local Group. Also, it has the latest Hubble type, SA(s)d. It is similar to M 33 in several aspects. Several authors have studied the H II regions. Bresolin et al. (2009) were the first to determine the oxygen abundance gradient based on direct-method abundance determinations. They found ΔO/ΔR = −0.077 dex kpc−1 with a central abundance of 12+log O/H ≃ 8.57.
Stasińska et al. (2013) analyzed the chemical gradients provided by H II region and PN abundances finding that gradients of PNe appear flatter than those of H II regions.
In this work we have re-analyzed the PN data presented by Stasińska et al. (2013), to compare the case of NGC 300 with the other galaxies of the sample. The abundances presented by Stasińska et al. (2013) were derived by adopting the ICFs proposed by Kingsburgh & Barlow (1994), and in this work we have used the more recent ICFs presented by Delgado-Inglada, Morisset, & Stasińska (2014). With these new ICFs we found that our O/H values were equal to the Stasínska et al. (2013) ones, with differences of less than 0.03 dex, our Ne/H values show differences, on average, of less than 0.05 dex, while our Ar/H values show differences of 0.07 dex on average. Data for H II regions are from Bresolin et al. (2009).
In this galaxy PNe and H II regions have been found up to R/R25 ≃ 1 (R ≈ 5 kpc). Galactocentric distances were collected from the same authors as the abundances.
2.4. Milky Way
Metallicity gradients have been widely studied in the MW by means of H II regions, PNe, Cepheid stars, stellar clusters and other objects; see e.g., Deharveng et al. (2000); Maciel, Costa, & Ushida (2003); Henry et al. (2010); Stanghellini & Haywood (2018, 2010); Esteban et al. (2017); the compilation by Mollá et al. (2019), etc. The reported results for PNe have been contradictory. It has been claimed that the PN gradients coincide with those of H II regions or that the PN gradients are shallower, that gradients have flattened (or steepened) with time, or that the gradient changes slope at certain distance from the galactic center. One of the main problem in these determinations is the large uncertainties in the distances to PNe.
Determining the distance to galactic PNe is a difficult task. The trigonometric parallax method is available only for a handful of nearby objects. Even the parallaxes measured by GAIA are limited to distances of a few kpc around the Solar System, and in GAIA Data Release 2 less than a hundred PNe have confidently measured parallaxes (Kimeswenger & Barría 2018). Therefore, the distances for a large sample of PNe are based on model-dependent statistical methods which, on occasion, lead to different results. At present, the most used distance scales are those proposed by Stanghellini & Haywood (2010), hereafter S10, and by Frew, Parker, Bojiĕcié (2016), hereafter F16. The latter authors established a robust optical statistical distance indicator, the Hα surface brightness vs. radius (SHα-r) indicator, where the intrinsic radius is calculated by using the angular size, the integrated Hα flux, and the reddening to the PNe. This radius, combined with the angular size, yields directly the distance. On the other hand, S10 determine statistical distances based on apparent diameters and 5 Ghz fluxes of PNe. A comparison of both distance scales are presented below.
In this work we used the PN chemical abundances reported by Henry, Kwitter, & Balick (2004), Milingo et al. (2010)), and Henry et al. (2010). These authors belong to the same group; therefore, all physical conditions were calculated with the same method, and total chemical abundances were obtained using the ICFs described in Kwitter & Henry (2001). The Galactic sample consists of 156 PNe covering galactocentric distances in the range 0.21 kpc ≤ R ≤ 22.73 kpc (0.02 ≤ R/R25 ≤ 1.97). More than 40 of these PNe lie at distances larger than the solar galactocentric distance and are crucial for the gradient determination.
Oxygen abundances for H II regions were taken from Esteban et al. (2017), while neon and argon abundances were collected from García-Rojas et al. (2004)), García-Rojas et al. (2005), García-Rojas et al. (2006), García-Rojas et al. (2007), Esteban et al. (2004), Esteban et al. (2013), and Fernández-Martín et al. (2017). As said above, the use of data processed by different authors can introduce some in-homonogeneities and uncertainties in the Ne and Ar gradients of H II regions, that should be considered carefully.
In Figure 6 we present the comparison of the metallicity gradients of oxygen, argon and neon for the Galactic H II regions and the PN sample. This figure will be discussed in detail in § 3.4, Here we want to show that for the case of PNe we are using the distances by F16 and S10 for a comparison. As seen in this figure the oxygen, neon, and argon abundances show a very large dispersion at all galactocentric distances, but the linear regressions for PNe are similar for both distance indicators. Therefore in the following F16 distances will be used as an independent way to compare with other works.
3. ABUNDANCE GRADIENTS
Abundance gradients for the different elements and the different galaxies were calculated by fitting a straight line to the abundances versus the fractional galactocentric distance R/R25 and also versus the distance R (kpc). For each elemental abundance we computed one fit for PNe and one for H II regions. Gradients are shown in the respective figures. In Table 2 a compendium of the abundance gradients versus galactocentric distance R (kpc) is listed. For each fit the table gives the values of the intercept, X0, and the slope, calculated by the equation:
Errors have been calculated at 1 sigma. The errors in the gradients of Ne and Ar are much larger than in O, due to the large dispersion of the abundances at any galactocentric distance, and to the uncertainties in the abundance determination, because large ICFs are used for these elements.
3.1. M 31
In Figure 1 the radial gradients for O/H, Ne/H and Ar/H, for PN and H II region abundances are plotted vs. R/R25. The gradients vs. R (kpc) are presented in Table 2.

Fig. 1 Radial metallicity gradients of O (top), Ne (center) and Ar (bottom) for M 31, are presented. Black circles represent PNe and red squares, H II regions. Black dashed lines correspond to the linear fit for PN data and dashed-dotted red lines correspond to the linear fits for H II regions. The color figure can be viewed online.
A linear fit to the gradients is included in each case. The abundances of elements in PNe present a large dispersion at any given galactocentric distance, but in particular in the central zone. It is worth to notice that there are some PNe in the central region with very low O/H abundance, which do not have Ne/H or Ar/H abundance determinations. H II regions also show a large dispersion in the elemental abundances at any galactocentric distance (Zurita & Bresolin 2012; Sanders et al. 2012).
For the case of O in H II regions, we obtain:
or equivalently
The O gradient found is equal, within the uncertainties, to the one derived by Zurita & Bresolin (2012). For Ne, we find
and for Ar, we find
In all the cases, the errors correspond to 1 sigma.
PN abundances seem unrelated to the galactocentric distance; the PN gradients are really flat, showing slopes of −0.001 ± 0.001 dex kpc−1 for O, −0.002 ± 0.001 dex kpc−1 for Ne, and −0.002 ± 0.001 dex kpc−1 for Ar, which considering the errors are consistent with 0. This indicates that at large galactocentric distances PNe present on average the same O/H abundances as the central zones; the same is true for Ar and Ne.
The O/H value at the intercept for H II regions, 12+log O/H = 8.76±0.10, seems slightly larger than the value for PNe, 12+log O/H = 8.46±0.03, while the Ne/H and Ar/H central values are similar for H II regions and PNe, within uncertainties. However, due to the negative gradients for H II regions, at large distances (R ≤ R25,) the O/H, Ne/H and Ar/H abundances in PNe are always larger than the abundances in H II regions.
The larger value of O at the intercept for H II regions seems to be an artifact due to the limited sample of Zurita & Bresolin (2012), which moreover presents large uncertainties. In addition, there are a large number of PNe with low O abundances in the central zone, with no Ne and Ar measurements, that could be contributing to the low O/H central value for PNe. In this zone a very large dispersion is observed.
In the central zone the value at R = 0 of log Ne/O=−0.77 for H II regions is about solar and excludes the possibility indicated by Zurita & Bresolin (2012) of a large O depletion in dust grains. On the other hand, Ne in H II regions is similar to Ne in PNe in the central zone. Relative to Ar, log Ar/O (H II) = −2.38 and log Ar/O (PNe) = −2.24 which correspond well with the solar or Orion values.
In Figure 2 we show the abundance gradients for PNe separated by Peimbert types. Peimbert (1978) called Type I those PNe with a N/O abundance ratio larger than 0.5 and a He/H abundance ratio larger than 0.14. This group includes the PNe with central stars with initial masses larger than about 3.0 M⊙ and therefore they are the youngest objects among PNe. They have enriched their nitrogen abundances by nucleosynthesis processes, such as CNO and hot-bottom-burning (HBB) and the newly formed N has been transported to the surface in different dredge-up events. In the Galaxy, Type I PNe belong to the thin disk and their ages are about 1 Gyr. Non-Type I PNe include the Peimbert Types II and III, which are classified based on their radial velocity, being smaller or larger than 60 km s−1, and are located in the thick disk. They correspond to older objects with initial masses smaller than 2 M⊙, where no large N-enrichment is present. Their ages are between 2 to 8 Gyr.

Fig. 2 Radial metallicity gradients for different Peimbert Type PNe in M 31. The data for Type I PNe are shown as red triangles, the data for non-Type I PNe as blue crosses. The color figure can be viewed online.
Thus our Figure 2 represents an effort to determine the behavior of the abundance gradient over time. It is evident that although the gradients are very flat and the uncertainties are large, Type I PNe show slightly steeper gradients for the three elements: O, Ne and Ar. Additionally, Type I PNe seem to be O-poorer than non-Type I, possibly showing the effect of CNO and HBB processes which operates in these massive stars. This phenomenon will be discussed in more detail in § 4.1.
It should be mentioned here that the value of the N/O abundance ratio, used to define a Peimbert Type I PN is slightly dependent on the metallicity. The N/O ratio defined by Peimbert (1978) applies to the metallicities of the Milky Way and M 31, and should be slightly lower for M 33 and NGC 300, but the difference is not important for this work and the results are not much affected.
We will discuss the results for M 31 in sections ahead, together with the results for the other galaxies.
3.2. M 33
Metallicity gradients for H II regions and PNe in M 33 are presented in Figures 3 and 4. In the latter one, PNe are separated into Peimbert Type I and non-Type I objects. Differently to what happens in M 31, in this galaxy O, Ne and Ar abundances of PNe and H II regions are similar, within uncertainties, at any galactocentric distance.

Fig. 3 Radial metallicity gradients in M 33. Symbols are as in Figure 1. The color figure can be viewed online.

Fig. 4 Radial metallicity gradients for PNe of different Peimbert Type in M 33. In red the data for Type I PNe are shown and in blue, the data for non-Type I PNe. The color figure can be viewed online.
For PNe the straight-line fit of the gradients gives 12+log O/H = (8.34±0.07) −(0.038±0.016) R (kpc) and for H II regions, 12+log O/H=(8.48±0.03) − (0.047 ± 0.008) R (kpc). That is, the slope for PNe seems shallower than the slope for H II regions, by about 30% for O and by larger factors for Ne and Ar, but the uncertainties are large making these results inconclusive. However, we consider them indicative of shallower PN gradients.
In Figure 4, the gradients of PNe with different Peimbert Types are shown. There are only a few Type I PNe in the sample (about 20%) and the un-certainties are very large. However, the central values can be considered to be equal, within errors, for both PN types. Despite the uncertainties, slightly steeper gradients are apparent for Type I PNe, while the gradients for non-Type I PNe are flatter. The slopes shown by Type I PNe are more similar to those of H II region. The huge uncertainties in these results make them inconclusive, but only indicative. We consider them reliable because M 33 shows results similar to M 31 and NGC 300.
3.3. NGC 300
PN data in this galaxy were analyzed by Stasińska et al. (2013), where O, Ne, S and Ar abundance gradients were presented. These authors found that the formal O/H, NeH and Ar/H abundance slopes for PNe are shallower than those of H II regions and attributed this to a steepening of the metallicity gradients during the last Gyr. The O/H central value of PNe is smaller by 0.15 dex than the central value of H II regions. Ne/H and Ar/H, on the other hand, present the same central abundances for PNe and H II regions, and almost flat gradients, although affected by large dispersion at any galactocentric distance. According to Stasińska et al. (2013), due to the difference in the O/H value at R = 0, O abundances in PNe could be affected by nucleosynthesis of their central stars.
Our analysis of these data, calculated with the ICFs by Delgado-Inglada, Morisset, & Stasińska (2014), shows similar results, presented in Figure 5. O, Ne and Ar metallicity gradients for PNe in NGC 300 are flatter than the values for H II regions. Their ΔX/ΔR values are about half the values found for H II regions, in very good agreement with the results of Stasińska et al. (2013). In the central zone, H II regions show 12+log O/H = 8.57±0.03, log Ne/O = −0.86±0.008 and log Ar/O= −2.20±0.07. These abundance ratios are similar to the solar or Orion values, while PNe show values 12+log O/H= 8.37±0.03, log Ne/O =−0.73±0.06, and log Ar/O = −2.06±0.05, also similar to the solar and Orion values but with an apparent O decrease by 0.2 dex, relative to the O of H II regions, as already indicated by Stasińska et al. (2013). This will be discussed in §4. The central values of Ne/H and Ar/H are similar for PNe and H II regions.
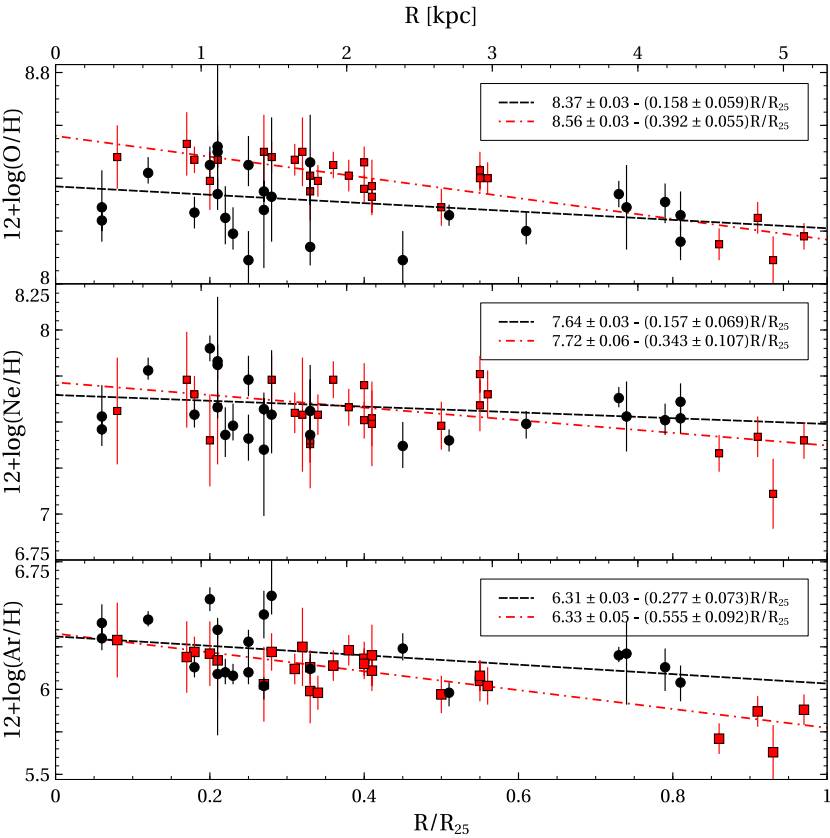
Fig. 5 Radial metallicity gradients in NGC 300. Symbols are as in Figure 1. The color figure can be viewed online.
In this case, an analysis discriminating between the Peimbert Type PNe is not possible, because there are very few Type I PNe in the sample.
3.4. The Milky Way
Metallicity gradients have been widely studied in the MW by means of many kind of objects. See references in §2.4.
Henry et al. (2010), using distances by Cahn, Kaler, & Stanghellini (1992) derived an O gradient for PNe of −0.058 ± 0.006 dex kpc−1, which changes to −0.042±0.004 dex kpc−1 if the distances by Stanghellini, Shaw, & Villaver (2015) are used. Henry et al. (2010) suggested that the gradient steepens beyond a galactocentric distance of 10 kpc. In a recent work, Stanghellini & Haywood (2018), using distances given by S10, reported that out to R/R25 ≃ 2.4 (R ≈ 28 kpc) the radial gradient of oxygen for PNe is shallow, with a slope of ≈ −0.02 dex kpc−1 and a central abundance of 12+log(O/H)≃ 8.68. These authors suggest that the gradient changes with R in the sense that the significant slope is limited to R between 10 and 13.5 kpc, and outside this range the gradient is almost flat.
We analyzed the gradients derived from the data for PNe and H II regions mentioned in §2.4. PN abundances were calculated by us in a homogeneous way. The results are presented in Figures 6 and 7. In the latter figure the data have been binned in distance taking bins of 1 kpc, for clarity. The distances by F16 are used for PNe. Clearly, PN gradients are flatter that those of II regions. ΔX/ΔR is about twice larger for H II regions (see Figure 7 and Table 2). The binning of data with distances introduced an artifact in Figure 7 in the sense that the O and Ne abundances for PNe seem larger than the values for H II regions at R = 0. But this does not occur in Figure 6, where the original data, not binned, were used. In these graphs it is observed that the O and Ne values at the central zones coincide for PNe and H II regions, within uncertainties, while the Ar/H abundance is lower in PNe by 0.7 dex. However, due to the shallower gradients for PNe, at galactocentric distances larger than a few kpc the average abundances of PNe are larger than those of H II regions, similarly to what happens in M 31 and NGC 300. This can explain in part the results by Rodríguez & Delgado-Inglada (2011), who found that in the solar vicinity, PNe appear richer than H II regions.
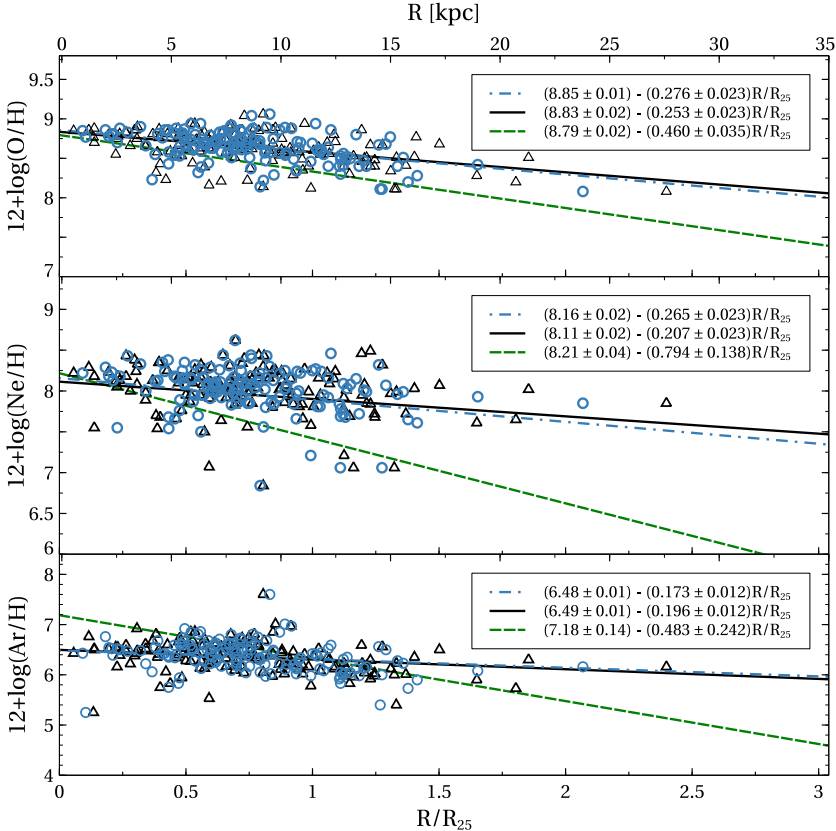
Fig. 6 Radial metallicity gradients of O, Ne and Ar, in the Milky Way. Open blue circles and black triangles are PNe with distances from Frew et al. (2016) and Stanghellini & Haywood (2010) respectively. The dotted-dashed line is the linear fit for F16 distances and the solid line that for Stanghellini & Haywood distances. The green dashed line is the linear fit for H II regions by Esteban et al. (2016). The color figure can be viewed online.

Fig. 7 Radial metallicity gradients. The black circles correspond to PNe with F16 distances in bins of 1 kpc. Solid lines are the fits for PNe and dashed lines those for H II regions. The top panel shows the radial gradient for O, the center panel the gradient for Ne, and the bottom the gradient for Ar. The color figure can be viewed online.
The gradients derived for PNe of different Peimbert types are shown in Figure 8. In this case, gradients of Type I and non-Type I PNe are equal within uncertainties. A possible change in the slope, at R≈ 14 kpc, is appreciated, which will be discussed in the next section.

Fig. 8 The PNe of the MW with distances binned as in Figure 7. Red diamonds represent Type I PNe and blue stars non-Type I PNe. Solid lines show the linear fits for Type I SNe, the dotted lines those for non-Type I SNe. The color figure can be viewed online.
We used the known GAIA distances of PNe to analyze the gradient for PNe. Using the same set of abundances as for the MW, we searched for those PNe that have calculated parallaxes in GAIA Data Release 2 (GAIA DR2). We did not take into account those objects with negative parallax and those with errors in parallax (dp/p) larger than 0.4. We found 22 PNe meeting these requirements. No gradient was found in this interval for the three analyzed elements, because GAIA galactocentric distances are limited from 6 to 10 kpc, and this interval is too short to show any gradient, due to the large dispersion in abundances.
4. RESULTS AND DISCUSSION
The radial gradients of the elements O, Ne and Ar are analyzed for homogeneous samples of PNe and II regions in four disk galaxies of different Hubble type, different masses and different metallicities, M 31, M 33, NGC 300 and the Milky Way. A compendium of our results, with all the linear fits and slopes ΔX/ΔR in dex kpc−1, is presented in Table 2. In the following we discuss the results.
4.1. M 31
Our work extends the PN sample, including objects from 2 kpc up to a distance larger than 100 kpc (0.2 - 5 R25). In this interval the abundance gradients for PNe are flat, consistent with a slope of zero. The average abundances of PNe are the same at all galactocentric distances, showing a very large dispersion.
On the other hand the gradients for H II regions are always negative, with values −0.030 ± 0.010 dex kpc−1 for O, −0.036 ± 0.016 dex kpc−1 for Ne and −0.021 ± 0.013 dex kpc−1 for Ar. These slopes are much shallower than the slopes in the other three galaxies. The very flat gradients found in M 31 could indicate, according to Sánchez et al. (2014), that M 31 has been perturbed by interactions or merging. It is clear that these phenomena have had an important role in the formation and growth of M 31, a galaxy that shows numerous stellar sub-structures in its outskirts (McConnachie et al. 2009, and references therein).
At the central position PNe appear to have an average O/H abundance slightly lower than the average of H II regions, but similar Ne/H and Ar/H abundances. This could be due to the presence of several PNe with very low O abundance (and not known Ne and Ar) in the central region, as it was explained in § 3.1
Similarly to our work, Sanders et al. (2012) and Magrini et al. (2016) reported that the O/H gradient from PN abundances is flat in M 31. Sanders et al. (2012) in particular, from the analysis of O abundances of 52 PNe derived with the direct-method and located at galactocentric distances from 5 to 25 kpc (0.2 to 1.2 R25), found no relation between PN abundances and their galactocentric distances. The same PN sample was re-analyzed by Magrini et al. (2016), who reported that radial migration plays an important role in PNe of M 31, which possibly explains the extreme flatness of PNe gradients, since PNe may have migrated far from their place of origin.
When the sample is divided into Peimbert Type I PNe (young objects) and non-Type I PNe (older objects), we found that the young objects show a steeper gradient, although still very flat (Figure 2). Due to their youth (ages lower than about 1 Gyr), Type I PNe have had less time to migrate from their birth places. Thus they might be showing the gradient at about 1 Gyr ago, but considering that these gradients are very flat (compared to those of H II regions) migration could have been an important role for these young PNe too.
It is important to mention that the results found for M 31 corroborate models of galactic chemical evolution, which besides including the star formation rate, gas in fall rate accross the disk, inflows and outflows of gas, stellar evolution and yields, among other processes, also include radial redistribution of stars (stellar migration). Models by Ruiz-Lara et al. (2017) predict that radial redistribution and accretion increase the metallicity dispersion, and flat-ten the age and metallicity profiles of galaxies; the greater the efficiency of the redistribution, the larger the flattening effect and, as a consequence, a steeper metallicity gradient should be expected at the birth of the objects. Type I PNe being closer to their birth places, they show steeper gradients.
Peimbert Type I PNe present slightly lower O abundances than non-Type I’s, while the Ne and Ar abundances are similar. This can be due to nucleosynthesis, because CNO and HBB processes are expected to occur in these more massive central stars, modifying their initial O abundance. Such an O decrease is predicted by recent sophisticated evolutionary stellar models for low-intermediate mass stars of the MW, computed at different metallicities, by Ventura et al. (2017). Using the sequence of models with z ≈ 0.014 (solar metallicity) it is found that stars with masses larger than 3 M⊙ decrease their O/H abundance by up to 0.2 dex at the end of their evolution, while stars of lower masses do not modify their original O/H. This is the effect we are finding in the comparison of Type I and non-Type I PNe in M 31.
4.2. M 33
For M 33, a late Hubble-type galaxy, the results are presented in Figures 3 and 4. In this case O, Ne and Ar in PNe show central values similar to those of H II regions. Therefore there was no important enrichment of the ISM since the time of formation of these PNe. Similarly, the O abundance gradients of PNe and H II regions are equal, within uncertainties, but the Ne and Ar abundance slopes in PNe seem significantly flatter, although the large dispersion and large uncertainties make these results doubtful.
Due to the similarity of metallicity gradients and the large dispersion, Magrini, Stanghellini, & Villaver (2009) claimed that gradients are equal for PNe and H II regions. In a recent paper, Magrini et al. (2016) analyzed the possible effects of radial migration in M 33 and concluded that it is not im-portant. Also Bresolin et al. (2010) declared that PNe and H II regions have gradients equal within uncertainties, but an analysis of their Table 8 shows that the slopes of PNe are systematically flatter than those of H II regions, even when the uncertainties are large.
It is interesting to notice that PNe in M 33 do not show O reduction compared to H II regions, as occurs in NGC 300 (see next section), despite the similar low metallicity of both galaxies. It seems that the initial masses of the central stars in this galaxy are not as large as in NGC 300. Thus, they are not affected by nucleosynthesis in the same way as seen in NGC 300. According to Ventura et al. (2016) models, the initial masses should have been not much larger than 2 M⊙.
Although the uncertainties are huge due to the small number of objects, Type I PNe in M 33 seem to present slopes steeper than non-Type I PNe, and more similar to the ones of H II regions. Again these results are very uncertain, but we consider them indicative of a behavior similar to that of M 31.
4.3. NGC 300
For NGC 300, the latest Hubble-type galaxy, with a metallicity similar to M 33, the abundance gradients of PNe are about twice smaller than the gradients of H II regions (see Figure 5). The gradients presented by H II regions are the largest (ΔO / R = −0.077 ± 0.008 dex kpc−1) of the whole galaxy sample.
The average O/H central abundance of PNe is lower than the value of H II regions by 0.2 dex, while Ne and Ar have the same central values. Such an O decrease, which does not occur for Ne and Ar, could be the result of stellar nucleosynthesis and dregde-up events. Stellar evolution models performed by Ventura et al. (2016) for PNe in the SMC (which has a metallicity similar to that of NGC 300) predict a de-crease of the initial O occurring in stars with masses larger than 3 M⊙, due to HBB; simultaneously, a large N-enrichment occurs. Such an N-enrichment is observed for the PNe of NGC 300 (Stasińska et al. 2013). Therefore, we conclude that the central stars of PNe analyzed in this galaxy had, in general, large initial masses; they are younger than 1-2 Gyr. This is certainly due to a bias in the sample because only the brightest objects were observed at the distance of NGC 300 (Peña et al. 2012).
The central values of Ne/H and Ar/H are similar for PNe and H II regions. Once again, this indicates that PNe are young objects, which had initial abundances similar to the present ISM.
An interesting fact is that at R/R25 larger than 0.6, the Ar/H abundances of PNe are definitely larger than those of H II regions, independently of the large dispersion. This is also found for Ne, but it is less marked. Since Ar it is not expected to have been modified by stellar nucleosynthesis of the central stars, this is indicating that radial migration should have been important for PNe (despite their youth), and that PNe have changed their initial galactocentric distances, being churned in the galaxy, although not at the level of migration found in M 31.
4.4. The Milky Way
The results for the MW are presented in Figures 6 and 7. The latter figure shows PNe data in distance bins of 1 kpc. The PN sample covers a galactocentric distance interval 0.21 kpc ≤ R ≤ 22.73 kpc (0.02 ≤ R/R25 ≤ 1.97). The gradient obtained for in PNe is −0.024 dex kpc−1, similar to the ones derived for Ne and Ar. As occurs in M 31, and NGC 300, PN gradients are flatter, by about a factor of 2, than the gradients of H II regions.
The gradients for Type I and non-Type I PNe are shown in Figure 8. In this figure the slopes of both kinds of nebulae seem indistinguishable. Our result is different from that reported by Stanghellini & Haywood (2010) and Stanghellini & Haywood (2018) for their young and old PN samples, using the distances by S10. They claim that young PNe definitely present a steeper gradient of −0.027 dex kpc−1 versus −0.015 dex kpc−1 for old PNe. We are not sure if our different result is due to the different PN samples (a much larger sample from the literature, not homogenized, was used by Stanghellini & Haywood) or to the different distance scale used. In any case we concur with them in that PN gradients are flatter than those of H II regions. Therefore, it appears than PNe have moved from their birth places due to radial migration and are showing flatter gradients. Alternatively, it is possible that the abundance gradients were flatter several Gyr ago.
Although a linear fit to these gradients produces acceptable results, it should be noticed that at distances larger than about 14 kpc, the observed abundances (in particular O/H and Ar/H) decrease to a value below the linear fit and continue flat outwards, showing a break. Unfortunately, in our sample there are few PNe there and this result is not conclusive. A break at a distance R ≈13.5 kpc was reported by Stanghellini & Haywood (2018) for the same sample of outer PNe. Following Halle et al. (2015) they attributed this behavior to the effect of the galactic bar, whose outer Lindblad resonance would be located at about this distance according to N-body simulations. It is crucial to observe a larger number of PNe in the outskirts of the Galaxy to verify this behavior.
It is interesting to compare the gradients of H II regions (−0.040 dex kpc−1) and PNe (−0.024 dex kpc−1) with other gradients provided by well measured indicators of different ages. Mollá et al. (2019) prepared a compilation of gradients for objects of different ages, computed by various authors, in order to compare them with results from their chemical evolution models. From this compilation we selected the gradients calculated by Mollá et al. for Cepheid stars, (which are young objects with ages of about 0.1 Gyr and show an O/H gradient of −0.049 dex kpc−1) and open clusters (OC) which span ages from 2 to more than 8 Gyr. The O/H gradient for OC younger than 2 Gyr is −0.030 dex kpc−1, and for ages between 2 and more than 8 Gyr, it is −0.027 dex kpc−1. It is clear that the gradients of H II regions and Cepheid stars are equal within uncertainties, indicating that in the Galaxy the chemical gradients have not changed significantly at least in the last 0.1 Gyr, while gradients of PNe (Type I’s and non-Type I’s) are equal to those of OC older than 2 Gyr. Therefore for objects of 2-8 Gyr the gradient is flatter (−0.027 dex kpc−1) than those for Cepheids and H II regions (−0.049 and −0.040 dex kpc−1). PNe and OC certainly could have been affected by migration, but not in as an extreme way as in M 31. Alternatively, PN and OC gradients could correspond to the true gradients present several Gyr ago.
Mollá et al. (2019) discussed the possible effects of migration in the MW. By analyzing models by different authors, their conclusion was that radial migration seems not to be important for stars younger than 4 Gyr. Only for objects older than 8 Gyr, radial migration may be important. Models by Mollá et al. of the time evolution of chemical gradients in the Milky Way (without considering migration, bar or spiral arms) predict a very smooth evolution of the radial gradient within the optical disk. Some models show a steepening of the gradient, from −0.02 to −0.04 dex kpc−1 over a time of 10 Gyr. Therefore the gradients shown by PNe and OC could be the gradients at the time of formation of these objects, not affected by migration.
5. CONCLUSIONS
From the analysis of abundance gradients of O, Ne, and Ar in PNe and H II regions in four galaxies, it is found that in NGC 300 (a late Hubble-type spiral of low metallicity) and the Milky Way, the abundance gradients for PNe are flatter than those of H II regions, by factors of 2. This result is less conclusive in the case of M 33, but there also slightly flatter gradients for PNe than for H II regions are found.
M 31 represents an extreme case, where the PN abundances are not related to the galactocentric distances and show the same values at any distance from the center, up to more than a 100 kpc. Merging, interactions with other galaxies and important radial migration of PNe are the cause of this behavior. It is worth to notice that considering H II regions, M 31 presents the shallowest gradients, which again is a possible consequence of merging and interactions.
In the four galaxies analyzed here, there is a large dispersion of the abundances at any galactocentric distance, larger for PNe than for H II regions. This is possibly caused by migration. PNe could have been churned in the galactic disk far from their birth places; thus, their abundances do not correspond to the place where they presently are. To understand this it is important to analyze the abundances of elements that have been not been modified by stellar nucleosynthesis, like Ar, since O and Ne can be modified depending on the metallicity and the stellar mass. However, Ar abundance determinations have large uncertainties; therefore, the results based on Ar only should be viewed with care.
Considering the PNe separated by Peimbert types, M 31 is a clear case where the gradients seem to be steepening with time, since Type I PNe, which correspond to the youngest objects, with ages smaller than 1 Gyr, show steeper slopes than non-Type I PNe, with ages between 2 to 9 Gyr. Type I PN gradients are more similar to, but still much flatter than, H II region slopes. The gradients for non-Type I PN are most probably altered by radial migration which has moved the old PNe from their initial position in the galaxy. Type I PNe, due to their youth, have had less time to migrate from their place of birth, but the flatness of their gradients also indicates perturbations due to migration.
In the Milky Way, H II region and PNe gradients can be compared to the gradients of objects of similar ages, such as Cepheid stars (younger than 0.1 Gyr) and open clusters (ages between 2 and more than 8 Gyr). H II regions and Cepheid stars show the same O/H gradients, which indicates that the chemical enrichment in the Galaxy has not increased in the last few hundreds of Myr. On the other hand PNe and open clusters (OC) show similar gradients, flatter than those of Cepheids and H II regions. This could indicate that the gradients steepen slowly with time (from −0.02 to −0.04 dex kpc−1 over several Gyr). Alternatively, it could indicate that radial migration could have perturbed the slopes shown by these relatively old disk objects. Chemical evolution models for the Galaxy by Mollá et al. (2019) seem to favor the first option.
In the Milky Way a break in the PN gradient seems to exist, in the sense that inside R ≈ 14 kpc there is a measurable gradient of about −0.024 dex kpc−1 for all the three elements. Out-side this galactocentric distance, PNe show a flat slope. Stanghellini & Haywood (2018) reported the same phenomenon, based on the same data for PNe in the outskirts. However, there are only a handful of objects observed in this zone, and a larger sample should be analyzed to confirm this break in the abundance gradients.
In general, the central abundances of O, Ne and Ar of PNe are similar to the central abundances of H II regions (the differences could be of about 0.2 dex), indicating that the central enrichment has not been important since the time of birth of PNe, and dust depletion of O in H II regions is not large. However, due to the flat gradients of PNe, at galactocentric distance larger than about 0.5 R/R25, the average abundances in PNe are larger than the average abundances in H II regions.
We found that in PNe formed in low metallicity environment (Z ≤ 0.004, like in NGC 300), with initial masses of about 3 M⊙ or larger, the oxygen abundance could have been modified by stellar nucleosynthesis and its value in the nebula does not represent the initial value at the time of stellar formation. This is not the case in higher metallicity environments, or for stars with smaller initial masses. In the former case we suggest to use Ar as an element that shows the initial abundance in the nebula, even though Ar abundance determinations have large un-certainties.
Our results are very useful for the computation of chemical evolution models in these galaxies, since the present ISM, represented by H II regions, and the older component, represented by PNe, can be used to constrain the models. Non-Type I PNe are very useful to study the effect of radial migration in disk galaxies.

