


 text new page (beta)
 English (pdf)
 Article in xml format
 Article references
 Send this article by e-mail
 Cited by SciELO
  Similars in
SciELO
Similars in
SciELO 
 Permalink
1.INTRODUCTION
When performing a detailed analysis of the chemical abundances, it is essential to estimate as accuratelly as possible the relevant physical parameters that will lead to the choice of the proper atmospheric models, i.e. effective temperature, surface gravity, and micro-turbulence velocity. This can be archieved with a variety of photometric (e.g. Arellano Ferro, Mendoza & Eugenio 1993; Schuster et al. 1996; Alonso et al. 1999; Mauro et al. 2013) and spectroscopic methods (e.g. Gray et al. 2001; Giridhar & Goswami 2002; Molina & Stock 2004; Soubiran et al. 2010; Wu et al. 2011, Chen et al. 2015; Teixeira et al. 2016).
A stellar atmosphere is characterized mainly by Teff, log g, ξt and [Fe/H], and the knowledge of these parameters is crucial in many research areas related to stellar and galaxy physics.
The traditional spectroscopic method proceeds to initially derive the effective temperature and gravity via the ionization equilibrium of a well represented species, such as that of FeI and FeII or TiI and TiII and a set of stellar models such as ODFNEW-ATLAS9 (Castelli & Kurucz 2003) and MARCS (Gustafsson et al. 2008).
Empirical calibrations to estimate the stellar parameters employ, besides equivalent widths, other quantifiable spectroscopic features such as the central residual intensities and pseudocontinuum peaks (Rose 1984), relative depth ratios (Kovtyukh et al. 2003) and photometric bandheads (árnadóttir et al. 2010). It is important to note that the stellar parameters derived from empirical calibrations have been one of the main sources of information for the selection and validation of the stellar model for any object under study.
The large data bases that have become available over the last decade, e.g. RAVE (Zwitter et al. 2008), APOGEE (Allende-Prieto et al. 2008), LAMOST (Zhao et al. 2012), to name a few, require automated processing methods that allow the characterization of high volumes of information (stellar spectra) in a relatively short time (Graff et al. 2013; Bellinger et al. 2016; Dafonte et al. 2016; Damiani et al. 2016; Ren et al. 2016).
Recently, automatic or semiautomatic methods for determining equivalent widths and stellar parameters have been developed, such as ROBOSPECT (Waters & Hollek 2013), GALA (Mucciarelli 2013), FAMA (Magrini et al. 2013), ISpec (Blanco-Cuaresma et al. 2014) and ARES+MOOG (Sousa 2014). These methods have been calibrated for a wide range of stars in different evolutionary stages, from dwarf stars to giant stars. Stellar parameters and elemental abundances estimated via these automated methods show some degree of reliability and efficiency (Teixeira et al. 2016). However, these methods have not been tested for highly evolved objects such as post-AGB stars (hereinafter PAGB) due to the peculiarities of their spectra, e.g. complex emission and absorption profiles, profiles of strong absorption distorted by emission and splitting, and metal emission features (Klochkova 2014).
This paper aims to estimate Teff, log g and [Fe/H] for a set of PAGB stars via empirical calibrations of equivalent widths of selected features. Such empirical calibrations to determine the stellar parameters in PAGB stars are scarce (e.g. Arellano Ferro 2010; Molina 2012) as they are sensitive to the fact that these stars may be variable and their extinction, which is commonly a combination of interstellar and circumstellar, significantly affects the estimations of temperature, gravity and distance of the central star.
This paper is organized as follows: § 2 describes the selection of the sample stars and how equivalent widths were determined. § 3 shows the spectroscopic calibrations that allow us to derive the stellar atmospheric parameters. § 4 is dedicated to discuss our results, and finally, § 5 gives the conclusions of the paper.
2. STELLAR SAMPLE
The sample used in this work was selected from the Suárez et al. (2006)’s PAGB list. The full sample contains a total of 103 PAGB stars with spectral types ranging from B to M.
For this work we select a set of 70 PAGB stars with spectral types ranging from A to early-K and luminosity classes I and Ie (where “e” means emission lines). The selected sample was divided in 50 warm (6000 ≤ Teff ≤ 8000 K) and 20 cold (4500 ≤ Teff ≤ 5500 K) PAGB stars.
Subsequently, we identified in the sample those stars that have stellar atmospheric parameters Teff, log g and [Fe/H] derived by spectroscopic methods. A total of 21 warm and 5 cold PAGB stars have data for these parameters determined in the literature, with the exception of IRAS08005-2356, which has only a temperature estimation. Some of the warm PAGB stars have temperatures that are not consistent with their spectral types (i.e. are misclassified). Table 3 provides the stellar atmospheric parameters collected from the literature and used as calibrators for the PAGB stars in this study.
Table 1 Equivalent widths for warm stars.
| IRAS number |
SpT | CaIIK 3933 (Å) |
Fe,Till 4172.9 (Å) |
FeI blend 4271 (Å) |
FeI 4383 (Å) |
OI 7771.5 (Å) | Ref. |
|---|---|---|---|---|---|---|---|
| 02143 + 5852 | F7Ie | 1.01 | 0.18 | 0.32 | 0.05 | … | 01 |
| 02528 - 4350 | 1.26 | 0.19 | 0.13 | … | … | ||
| 04296 + 3429 | F7I | … | … | … | … | … | 01 |
| 05341 + 0852 | F5I | … | 1.94 | 0.23 | 0.29 | 1.52 | 01 |
| 06530 - 0213 | F0Iab | … | 2.40 | 0.80 | 3.23 | … | 02 |
| 07134 + 1005 | F7Ie | … | 1.25 | 0.27 | 0.31 | … | 01 |
| 07253 - 2001 | F21 | … | … | … | 0.27 | … | 01 |
| 07430 + 1115 | G5Ia | … | … | … | 0.99 | … | 04 |
| 08005 - 2356 | F5Ie | 4.68 | 1.42 | … | 0.73 | 1.27 | 01 |
| 08143 - 4406 | F81 | 8.39 | 2.09 | 0.48 | 0.99 | … | 05 |
| 08187 - 1905 | F6Ib/II | … | … | … | 0.24 | … | 03 |
| 08213 - 3857 | F21e | … | 0.74 | 0.19 | 0.22 | … | 01 |
| 08281 - 4850 | F0I | 1.22 | 0.94 | 2.74 | 1.65 | 1.90 | 01 |
| 10215 - 5916 | A7Ie | 11.32 | 4.22 | 2.37 | 3.12 | 1.77 | 01 |
| 10256 - 5628 | F5I | 12.73 | 1.38 | 1.75 | 0.42 | 2.17 | 01 |
| 11201 - 6545 | A3Ie | … | … | … | 0.48 | … | 01 |
| 11387 - 6113 | A3Ie | … | 0.74 | 0.30 | 0.44 | … | 01 |
| 12067 - 4505 | F6I | … | … | … | 0.05 | … | 06 |
| 14325 - 6428 | A8I | 6.18 | 1.10 | 0.24 | 0.96 | … | 07 |
| 14429 - 4539 | A1I | 0.91 | 1.05 | 0.23 | 0.47 | 1.85 | 02 |
| 14482 - 5725 | A2I | … | … | … | 1.13 | … | 01 |
| 14488 - 5405 | A0I | … | … | … | 0.02 | … | 01 |
| 15039 - 4806 | A5Iab | 0.75 | 0.50 | 0.12 | 0.21 | 1.64 | 08 |
| 15310 - 6149 | A7I | … | … | … | 0.09 | … | 01 |
| 15482 - 5741 | F7I | … | 1.88 | 0.33 | 0.22 | … | 01 |
| 16283 - 4424 | A2Ie | 4.50 | 0.25 | 3.00 | 1.58 | 2.38 | 01 |
| 17106 - 3046 | F5I | 9.62 | 2.68 | 1.25 | 0.58 | 2.10 | 01 |
| 17208 - 3859 | A2I | … | 0.57 | 0.23 | 0.82 | … | 01 |
| 17245 - 3951 | F6I | 9.13 | 2.00 | 1.49 | 2.13 | 2.02 | 01 |
| 17287 - 3443 | 0.96 | 0.10 | 0.15 | 0.14 | 0.74 | ||
| 17310 - 3432 | A2I | … | 0.36 | 0.22 | … | 1.30 | 01 |
| 17376 - 2040 | F6I | … | … | … | … | … | 01 |
| 17436 + 5003 | F3Ib | 6.76 | 1.88 | 1.14 | 1.07 | … | 09 |
| 17441 - 2411 | F4I | 7.38 | 1.16 | 0.99 | 0.52 | 2.06 | 01 |
| 17488 - 1741 | F7I | … | … | … | … | … | 01 |
| 17576 - 2653 | A7I | 5.13 | 0.85 | 0.02 | 0.58 | 2.12 | 01 |
| 17579 - 3121 | F4I | … | 2.42 | 0.24 | 0.98 | … | 01 |
| 18025 - 3906 | G1I | 13.14 | 2.18 | 0.22 | 1.30 | … | 01 |
| 18044 - 1303 | F7I | … | … | … | … | … | 01 |
| 19114 + 0002 | G5Ia | 9.86 | 3.90 | 1.82 | 1.59 | … | 10 |
| 19207 + 2023 | F6I | … | 3.44 | … | 3.74 | … | 01 |
| 19386 + 0155 | F5I | 8.31 | 1.20 | 1.70 | 0.97 | 1.66 | 11 |
| 19422 + 1438 | F5I | … | … | … | … | … | 01 |
| 19500 - 1709 | F0Ie | 1.67 | 0.95 | 0.44 | 0.74 | 1.94 | 01 |
| 19589 + 4020 | F5I | … | … | … | … | … | 01 |
| 20160 + 2734 | F3Ie | 4.52 | 1.95 | 1.28 | 1.33 | … | 01 |
| 20259 + 4206 | F3I | … | … | … | … | … | 01 |
| 20572 + 4919 | F3Ie | 4.41 | 0.92 | 0.73 | 0.63 | … | 01 |
| 21289 + 5815 | A2Ie | 0.68 | 1.12 | 1.94 | 0.76 | … | 01 |
| 22223 + 4327 | F7I | 8.93 | 2.41 | 1.05 | 1.02 | … | 01 |
Table 2 Equivalent widths for cold stars
| IRAS number |
SpT | FeI 4063 (Å) |
SrII 4077 (Å) |
CaI 4226 (Å) |
G-band 4302 (Å) |
FeI 4383 (Å) |
OI 7771-5 (Å) |
Ref. |
|---|---|---|---|---|---|---|---|---|
| 01259 + 6823 | GIab: | 0.76 | 2.95 | 1.34 | 3.60 | 0.48 | … | 12 |
| 05113 + 1347 | G5I | … | … | … | 1.76 | 1.37 | … | 12 |
| 05381 + 1012 | G2I | 0.37 | 0.76 | 0.40 | 2.87 | 0.51 | … | 04 |
| 07331 + 0021 | G5Iab | … | 1.70 | 0.77 | 3.60 | 0.88 | … | 10,13 |
| 07582 - 4059 | G5I | … | 1.60 | 0.98 | 5.69 | 2.86 | … | 01 |
| 10215 - 5916 | … | … | 1.53 | 3.03 | 3.12 | 1.77 | 01 | |
| 13203 - 5917 | G2I | … | … | 5.02 | 6.31 | 4.94 | … | 01 |
| 13313 - 5838 | K5I | 2.86 | … | 2.31 | 4.07 | 1.94 | 0.06 | 01 |
| 15210 - 6554 | K2I | … | 3.28 | 1.54 | 7.65 | 1.87 | 0.98 | 01 |
| 16494 - 3930 | G2I | … | … | 1.13 | 2.54 | 0.82 | 1.38 | 01 |
| 17300 - 3509 | G2I | … | 1.18 | 1.08 | 5.21 | 1.30 | … | 01 |
| 17317 - 2743 | G4I | 2.66 | … | 1.59 | 2.06 | 1.68 | 2.07 | 14 |
| 17332 - 2215 | K2I | … | 1.20 | 1.72 | 5.35 | 3.93 | 0.46 | 01 |
| 17370 - 3357 | G3I | 0.27 | 0.27 | 0.67 | 2.53 | 2.39 | 1.88 | 01 |
| 17388 - 2203 | G0I | 1.34 | 1.34 | 0.30 | 3.52 | 0.99 | 1.78 | 01 |
| 18075 - 0924 | G2I | 1.21 | … | 0.91 | 1.66 | 1.86 | … | 01 |
| 18096 - 3230 | G3I | 1.69 | 0.16 | 1.57 | 6.02 | 1.68 | … | 01 |
| 18582 + 0001 | K2I | … | 1.51 | … | 4.62 | 2.64 | … | 01 |
| 19356 + 0754 | K2I | … | 2.90 | 1.62 | 6.51 | 2.90 | … | 01 |
| 19477 + 2401 | G0I | … | … | … | … | … | … | 14 |
(01) Suárez et al. (2006); (02) Hu et al. (1993); (03) Hrivnak et al.(1989); (04) Fujii et al. (2001); (05) Hrivnak & Bieging (2005); (06) Maas et al. (2002); (07) Reyniers et al. (2007); (08) Stephenson & Sanduleak (1971); (09) Min et al. (2013); (10) Omont et al. (1993); (11) Hrivnak, Lu & Nault (2015); (12) Kelly & Hrivnak (2005); (13) Klochkova (1997); (14) Sánchez-Contreras et al. (2008).
Table 3 Atmospheric parameters used as calibrators taken from literature.
| IRAS number |
SpT | Teffref±∆Teffref (K) |
Log gref ±∆log gref | [Fe/H]ref ±∆[Fe/H]ref (dex) | Ref. |
|---|---|---|---|---|---|
| Warm stars (6000≤Teff≤8000K | |||||
| 15039-4806 | A0I | 8000±200 | 1.25±0.25 | -0.85±0.10 | 07 |
| 14325-6428 | A8I | 8000±125 | 1.00±0.25 | -0.56±0.16 | 03 |
| 19500-1709 | F0Ie | 8000±125 | 1.00±0.25 | -0.59±0.10 | 03 |
| 08281-4850 | F0I | 7875±125 | 1.25±0.25 | -0.26±0.11 | 03 |
| 20572+4919 | F3Ie | 7500±200 | 2.00±0.50 | -0.01±0.10 | 13 |
| 15482-5741 | F7I | 7400±150 | 1.40±0.20 | -0.47±0.16 | 08 |
| 06530-0213 | F0Iab: | 7375±125 | 1.25±0.25 | -0.32±0.11 | 03 |
| 08005-2356 | F5Ie | 7300±250 | … | … | 06 |
| 07134+1005 | F7Ie | 7250±200 | 0.50±0.30 | -1.00±0.20 | 04 |
| 08143-4406 | F8I | 7150±100 | 1.35±0.15 | -0.39±0.12 | 15 |
| 17436+5003 | F3Ib | 7065±125 | 0.91±0.15 | -0.09±0.10 | 09 |
| 04296+3429 | F7I | 7000±250 | 1.00±0.50 | -0.69±0.20 | 02 |
| 19386+0155 | F5I | 6800±100 | 1.40±0.20 | -1.10±0.15 | 12 |
| 19114+0002 | G5Ia | 6750±200 | 0.50±0.25 | -0.45±0.20 | 11 |
| 05341+0852 | F5I | 6500±200 | 1.00±0.50 | -0.72±0.12 | 04 |
| 22223+4327 | F7I | 6500±125 | 1.00±0.25 | -0.30±0.11 | 03 |
| 08187-1905 | F6Ib | 6250±200 | 0.50±0.20 | -0.59±0.15 | 01 |
| 18025-3906 | G1I | 6250±100 | 0.25±0.25 | -0.45±0.16 | 10 |
| 20259+4206 | F3I | 6100±200 | 2.20±0.25 | -0.10±0.15 | 10 |
| 12067-4508 | F6I | 6000±250 | 1.50±0.50 | -2.00±0.12 | 16 |
| 07430+1115 | G5Ia | 6000±125 | 1.00±0.25 | -0.33±0.15 | 03 |
| Cool stars (4500 ≤ T eff ≤ 5500 K) | |||||
| 05113+1347 | G5I | 5500±125 | 0.50±0.25 | -0.54±0.17 | 03 |
| 05381+1012 | G2I | 5200±100 | 1.00±0.50 | -0.80±0.17 | 05 |
| 01259+6823 | GIab: | 5000±200 | 1.50±0.25 | -0.60±0.12 | 01 |
| 13313-5838 | K5I | 4540±150 | 2.20±0.30 | -0.09±0.05 | 14 |
| 07331+0021 | K3/K5I | 4500±200 | 1.00±0.25 | -0.16±0.16 | 01 |
We choose a total of 9 absorption features which have been widely used as criteria for the MK spectral classification system. The limitations of some spectra in the blue and near infrared region make it impossible to measure the total equivalent widths for all objects. Among warm-PAGB stars, for example, a total of 7 objects do not have measures of the equivalent widths, and another 8 of them only have a single measure (i.e. the Fe I feature at λ4383 Å) preventing the estimation of their fundamental parameters. Among cold-PAGB stars, on the other hand, only one object does not have measures of the equivalent width.
2.1. Determination of Equivalent Widths
The quantification of equivalent widths was done in an automatic manner. For this purpose we have developed a code that replaces the true continuum by a pseudo-continuum through the interpolation of a straight line that connects the peaks on both sides of an absorption line (see Figure 1).
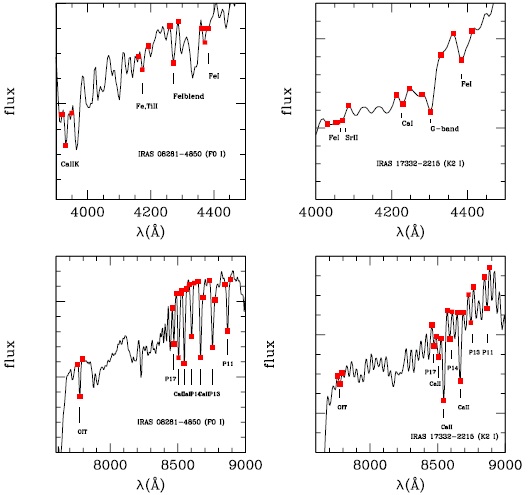
Fig. 1 Maximum and minimun points (red squares) that allow us to derive the equivalent widths for IRAS 08281 - 4850 (F0I) and IRAS 17332 - 2215 (K2I) using an automatic code. The location of different absorption lines selected are labeled by continuous lines. The color figure can be viewed online.
The equivalent width is then defined as the effective area occupied between the two maximum interpolated Wj= Σnj=1(Ic-Ij)Ic∆λ, where ∆λ is wavelength interval (or its dispersion). Tables 1 and 2 show the quantitative measures of 9 equivalent widths of absorption lines selected in this study.
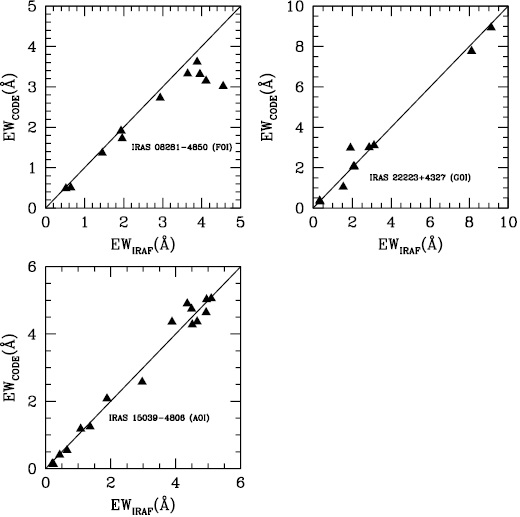
We can compare the measurements of equivalent widths from the automatic code with those done manually with the IRAF code. We use the quantifiable parameters of IRAS 01919 + 0373, IRAS 08281 4850, IRAS 22223 + 4327 with spectral types A0, F0 and G0 respectively. From Figure 2 we note that for weaker absorption lines (i.e. with low measures and intermediate equivalent widths) the values are in good agreement among themselves, while for stronger lines the values show slight systematic differences between them, which slightly increase the error. The outliers obtained with this method are usually due to poorly measured equivalent widths, caused by a poor maximum point determination.
2.2. MK Criteria
Our atmospheric parameters were estimated from features used by the MK system.
To determine the effective temperature we have used the equivalent width of the calcium line Ca IIK at λ3933 Å (warm stars) and the G-band at λ4302 Å (cool stars). The Ca IIK feature grows dramatically in strength from A-type toward late types (~F8); for cooler spectral types the equivalent widths remain flat. Other features, as the Ca I at λ4226 ̊A and the Mn I at λ4030 Å, are not useful to estimate the temperature in warm stars.
For G-type stars, the G-band characteristically dominates over other features. This feature increases in strength until about K2 and then decreases in intensity. Another feature, the MgI triplet at λ5167-72 Å shows some sensitivity to temperature for cold objects.
For the determination of surface gravity we employ ionized lines as criteria, the (λ4172-79 Å and λ4395-4400 Å blends, Sr II at λ4077 Å and Mg II at λ4481 Å). It is also possible to use the neutral oxygen triplet (λ7771-5 Å) located in the near IR-region. In warm stars, however, only the λ4172-79 Å blend of Fe II and Ti II is gravity sensitive, while the Sr II at λ4077 Å and the Ca I at λ4226 Å lines are sensitive to gravity in cold stars.
In order to obtain the stellar metallicity we used only the absorption lines of neutral iron, i.e. Fe I (λ4063 Å), the Fe I (λ4271 Å) blend and Fe I (λ4383 Å). We discarded any ionized iron lines because of their expected dependence on logg. For warm stars, we used as metallicity indicator the sum of the iron lines Fe I (λ4271 Å blend + λ4383 Å), while the Fe I lines (λ4063 Å and λ4383 Å) were employed for cool stars.
The lines of NaID at λ5889-95 Å and OIT at λ7771-5 Å were used as probable indicators for the determination of the stellar distance. The interstellar component of the Na ID lines at λ5889-95 Å showed sensitivity to luminosity in young stars. However, in evolved stars (as PAGB stars) both lines are affected by circumstellar material and therefore do not show a dependence on luminosity. The O IT lines at λ7771-5 Å, on the other hand, do show sensitivity to luminosity. In fact, Arellano Ferro et al.(2003) found accurate spectroscopic calibrations between visual absolute magnitudes and the OIT lines for a sample of 27 calibrator stars with spectral types A to G.
Because of the spectral range limitation in the near infrared region, the lines of the hydrogen Paschen series, and the oxygen and calcium triplets are very rare in the total sample. The equivalent widths of all features are presented in Tables 1 and 2, respectively.
2.3. Error in the Equivalent Widths
An accurate determination of systematic and random errors of the equivalent widths is not trivial, since these are a function of the magnitude, spectral type, the S/N ratio and the pseudo-continuum position. We also need common stars with the same spectral types and several measures of their stellar spectra. This sample has limitations for objects of the same spectral types and also for those with scarce measurements of equivalent widths, so that it is impossible to carry out a reliable statistics.
In this section we can estimate an approximation between the errors of the equivalent widths of the selected absorption lines and the spectral types. For this purpose, the spectral types were replaced by numerical values, as in the following sequence: A0 = 30, F0 = 40, G0 = 50 and K0 = 60, respectively. The intermediate values are taken between two successive classes. In view of the difficulties presented by the observational data (mentioned above), we decided to correlate the equivalent widths determined through the automatic code with those obtained from the IRAF code for both samples as shown in Figure 2.
A dispersion, σEW, is obtained for each spectral type (or an average σEW, if the spectral type is repeated), which varies from 0.02 to 0.47 for the warm stars and from 0.15 to 0.35 for the cold stars. In Figure 3 we observe that the dispersion shows a tendency to increase with increasing spectral type for both warm and cold stars. This dispersion results in an error in the effective temperature, ∆Teff, such that using equation 1 leads to a variation between 5 K and 68 K, and using equations 2 and 3 from 63K to 122K, respectively.
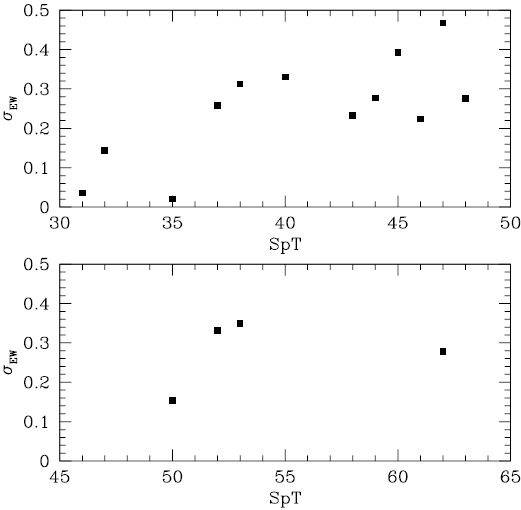
Fig. 3 Relation between the stellar atmospheric parameters as a function of equivalent widths for warm stars (top panel) and cold stars (bottom panel). The empty squares represent stars left out of the best fit.
With these arguments we can infer that the new spectroscopic calibrations for effective temperature, gravity and metallicity are not affected by the dispersion of the equivalent withs.
2.4. Sample for Calibration
Table 3 shows the PAGB stars that have been studied and reported in the literature. This table contains the number IRAS, the spectral type, the stellar atmospheric parameters obtained from different sources and their respective references. The stellar parameters were obtanied by different authors using spectroscopic methods.
We can observe that there are a total of 21 stars considered to be warm-PAGB stars and a very small number, only 5 objects, considered to be cold-PAGB stars. In spite of having a small number of stars as calibrators, it is possible to obtain a rapid and accurate determination of the fundamental parameters (effective temperature, surface gravity and metallicity) using only suitable spectral criteria, avoiding photometric indices which are often distorted by poorly known interstellar and circumstellar reddening.
In the recent past, two papers that involve photometric calibrations (Strömgren and 2MASS photometry) and that allow to estimate stellar parameters for a group of post-AGB and RV Tauri stars were published by Arellano Ferro et al. (2010) and Molina (2012).
2.5. Polynomial Fitting
The stellar atmospheric parameters can be determined by fitting a series of polinomials whose independent variables are the equivalent widths. Our goal is to analyze the actual dependence of the stellar parameters on one or two quantifiable features. The mathematical representation of the polynomial, in general, has the form
where V is any of the three stellar parameters (Teff, log g and [Fe/H]), aij are the coefficients to determine and x and y are the independent variables. When the number of independent variables is greater than one, we used the method adopted by Stock & Stock (1999), who developed a quantitative method to obtain stellar physical parameters such as absolute magnitude, intrinsic color, and a metallicity index using the equivalent widths of absortion features in stellar spectra by means of polynomials and a consistent algorithm (Molina & Stock 2004).
In order to determine the best coefficients we employ an algorithm based on least squares. This algorithm performs an initial fitting and removes those values of residuals greater than 2σ. The error of each coefficient is obtained from
where S(i, j) the diagonal matriz and σ2 is the mean square error.
3. STELLAR ATMOSPHERIC PARAMETERS
The main objective of this work is to build a set of spectroscopy calibrations to derive Teff, log g and [Fe/H] for PAGB stars. We employ the data contained in Tables 1, 2 and 3. In this section we will show the best fits when comparing the equivalent widths with the stellar atmospheric parameters taken from the literature.
3.1. Teff Calibration
For the determination of the effective temperature in warm-PAGB stars we use the equivalent widths of the Ca IIK at λ3933 Å. This line has been considered in the MK system as an indicator of temperature in warm stars (Gray & Corbally 2008). Particularly, for stars with temperatures between (6000 ≤ Teff ≤ 8000K), the equivalent widths show sensitivity to effective temperature. A code based on least squares that relates equivalent widths and effective temperatures taken from the literature (Teffref) leads to the following relationship
This calibration is valid for a range of equivalent widths between 0.76 ≤ Teff ≤ 13.15 Å. The standard deviation derived from equation (1) is ±91 K. Four stars were left out of the fit, i.e. IRAS 08143 - 4406, IRAS 08281 - 4850, IRAS 14325 - 6428 and IRAS 22223 + 4327. The stellar temperatures estimated by De Smedt et al. (2016) for IRAS08281- 4850, IRAS 14325 - 6428 and IRAS 22223 + 4327 are 7875 K, 8000 K and 6500 K, respectively and that estimated by Reyniers et al. (2004) for IRAS08143- 4406 is 7150 K, while the fit of equation (1) leads to values of 7674 K, 7211 K, 6809 K and 6856 K, respectively.
For late-PAGB stars (4500 ≤ Teff ≤ 5500 K), it is possible to determine the effective temperature from the G-band at λ4302 Å. In spite of only 5 stars being present in the fit, it is possible to determine the effective temperature applying a linear fit
Equation (2) is valid for a range of equivalent widths between 1.76 ≤ Teff ≤ 4.08 Å and the standard deviation achieved is ±207K. Two objects are left out of this relationship, IRAS 01259 + 6823 (5000 K), IRAS 22223 + 4327 (4500 K); the fit for both objects gives the same temperature value of 4788 K.
The stellar temperature for identified cold PAGB stars can be increased by using the resonance Ca I (λ4226 Å) line. This line is sensitive to temperature, since it grows gradually from G-type to early K-type stars, being stronger in stars of mid-K type. A linear relationship can be obtained by adjusting the temperature and the Ca I equivalent widths for four calibrating stars, this is
where the standard deviation reaches a value of ±175 K and the validation range for the equivalent widths can be found between 0.40 Å and 2.31 Å and for the temperatures between λ4550 Å and λ5200 Å. The results for the effective temperatures estimated by equations (1), (2) and (3) are shown in the third and fourth column of Tables 4 and 5. At the top of Figure 4, we note the dependence of the Ca IIK-line and the G-band on the effective temperature (see left and right panels).
Table 4 Atmospheric parameters estimated from equivalent widths for warm stars.
| IRAS number |
Teffphot (± 220K) |
Teffeq1 (±91K) |
Log gphot (±0.27) |
Log geq4 (±0.21) |
[Fe/H]eq7 (±0.19) |
|---|---|---|---|---|---|
| 02143+5852 | … | 7967 | … | … | -0.68 |
| 02528-4350 | … | 7981 | … | … | -0.71 |
| 07253-2001 | … | 7826 | 1.39 | 1.28 | -0.81 |
| 08005-2356 | … | … | 1.32 | 1.17 | -0.92 |
| 08213-3857 | … | 7872 | … | 1.28 | -0.67 |
| 10215-5916 | … | 6461 | … | … | … |
| 10256-5628 | … | 6257 | 0.85 | 1.18 | -0.42 |
| 11201-6528 | … | 7723 | … | 1.26 | -0.86 |
| 11387-6113 | 6209 | 7707 | 0.75 | 1.28 | -0.63 |
| 13245-50361 | 7077 | … | 0.77 | … | … |
| 14429-4539 | … | 7981 | 0.95 | 1.23 | -0.63 |
| 14482-5725 | … | 7402 | … | 1.13 | -0.01 |
| 14488-5405 | 7578 | 7950 | 0.86 | 1.28 | -0.75 |
| 15310-6149 | 5787 | 7915 | 0.98 | 1.35 | -0.77 |
| 16206-59561 | 7382 | … | 0.86 | … | … |
| 16283-4424 | 5699 | 7457 | 0.82 | … | -0.09 |
| 17106-3046 | … | 6709 | … | 0.97 | -0.47 |
| 17208-3859 | 5734 | 7856 | 0.96 | 1.31 | -0.58 |
| 17245-3951 | … | 6781 | 0.91 | 1.08 | -0.22 |
| 17287-3443 | … | 8024 | … | … | -0.69 |
| 17310-3432 | … | 7869 | … | … | … |
| 17376-20402 | … | … | … | … | … |
| 17441-2411 | 5404 | 7037 | 0.95 | 1.21 | -0.52 |
| 17488-17412 | 5860 | … | 0.73 | … | … |
| 17576-2653 | 7026 | 7365 | … | 1.26 | -0.64 |
| 175579-3121 | 5845 | 7790 | 0.78 | 1.01 | -0.56 |
| 18044-13032 | … | … | … | … | … |
| 19207+2023 | 4785 | 6638 | 0.71 | 0.85 | … |
| 19422+14382 | 6383 | … | 0.72 | … | … |
| 19589+40202 | 5231 | … | 0.78 | … | … |
| 20160+2734 | 6168 | 7454 | 0.80 | 1.09 | -0.36 |
| 21289+5815 | … | 8015 | … | 1.22 | -0.35 |
1Emission lines.
2Has no measured EWs.
Table 5 Atmospheric parameters estimated from equivalent widths for cold stars.
| IRAS number |
Teffphot (± 220K) |
Teffeq2 (±207K) |
Teffeq3 (±175K) |
Log gphot (±0.27) |
Log geq6 (±0.20) |
[Fe/H]eq8 (±0.30) |
|---|---|---|---|---|---|---|
| 07582-4059 | … | … | 5042 | … | 1.12 | … |
| 10215-5916 | … | 5027 | 4852 | … | … | … |
| 13203-5917 | 6355 | … | … | … | 1.23 | … |
| 15210-6554 | … | … | 4848 | 0.74 | … | -0.21 |
| 16494-3930 | 6227 | 5232 | 4990 | … | 1.15 | -0.61 |
| 17300-3509 | … | … | 5007 | 1.10 | 1.02 | -0.43 |
| 17317-2743 | … | 5432 | 4831 | … | 1.14 | -0.28 |
| 17332-2215 | … | … | 4786 | … | 1.03 | … |
| 17370-3357 | 4869 | 5236 | 5149 | … | … | -0.78a |
| 17388-2203 | 5267 | 4823 | … | … | 1.06 | -0.54 |
| 18075-0924 | 5517 | 5599 | 5066 | … | 1.23 | -0.21 |
| 18096-3230 | … | … | 4838 | 0.75 | … | -0.258 |
| 18582+0001 | … | … | … | … | 1.10 | … |
| 19356+0754 | … | … | 4820 | … | 1.44 | … |
| 19477+2401 | … | … | … | … | … |

3.2. Log g Calibration
For warm stars, we can estimate the surface gravity using the Fe,TiII blend at λ4172-9 Å. This blend is constituted mainly by ionized lines of Fe and Ti and has been considered as an indicator of luminosity in A-F type stars. A linear fit leads to the following relationship
The range of validation of this calibration for surface gravity spans 0.50 ≤log g ≤ 1.40, while the equivalent widths of the ionized line vary between 0.50 ≤ FeTi II ≤ 3.90 Å. The standard desviation has a value of σ=±0.21. Two stars fall out of the fit of equation (4), i.e. IRAS 07134 + 1005 and IRAS 18025 - 3906. According to the spectral types (or effective temperature) of IRAS 07134 + 1005 and IRAS 18025 - 3906 their equivalent widths would be expected to be slightly greater than 4 Å.
We can extend the range of surface gravity to higher values using the O I triplet lines. Due to the limitations of the spectral range to the near infrared region, the number of O I triplet lines is scarce. Their values are not reported in Table 4, and we will only show the functional relationship:
where the range of gravity varies from 1.00 to 2.20 and the equivalent widths vary from 0.07 to 1.95 Å. The standard desviation has a value of σ=±0.35.
The surface gravity of cold stars is estimated using the Sr II-line. This line has been considered as the principal luminosity discriminator for cool stars in MK classification. Unfortunately the functional relationship is built with only 3 stars and has the following form
The range of validation of this calibration in surface gravity spans 1.00 ≤log g ≤ 1.50, while the equivalent widths of the ionized line vary between 0.77 ≤ Sr II ≤ 2.95 Å. The standard desviation has a value of σ=±0.20. We can also estimate the gravity for additional cold PAGB stars: 13203−5917, 16494−3930, 17317−2743 and 17388−2203 when recovering the equivalent widths of the Sr II line from the Mg II line. An error of ±0.25 is introduced by this estimation.
The results for the surface gravity estimated by equations (4) and (6) are shown in the fifth and sixth columns of Tables 4 and 5. In the middle of Figure 4, we see the dependence of the Fe,TiII blend and the Sr II on surface gravity (see left and right panels).
3.3. [Fe/H] Calibration
For the calibration of metallicity we used only neutral Fe lines. For warm stars, we use the sum of Fe I (λ4271 Å + λ4383 Å). The best fit that recovers the metallicity is generated by a polinomial of the form
The range of validation of this calibration on metallicity covers −0.09 ≤ [Fe/H] ≤ −1.00 dex, while the equivalent widths of Fe lines vary between 0.34 ≤ Fe I ≤ 4.40 Å. The standard desviation for this relationship is ±0.19dex. Two outliers are present in this fitting; IRAS 19386 + 0155 of very low metallicity (−1.00 dex) and IRAS 20572 + 4919 of solar metallicity (−0.01 dex).
For cold stars, we employ the Fe I lines at λ4063 Å and λ4383 Å. Of the 17 cold-PAGB stars only 5 objects have identified stellar parameters. For the Fe I (λ4353 Å) line five objects are available for the calibration. The best fitting that recovers the metallicity within a range of −0.09 ≤ [Fe/H] ≤ −0.80 dex, involves a linear polynomial for Fe I line at λ4383 Å, that is,
where the equivalent widths vary between 0.48 and 1.94 Å and the standard desviation has a value of σ=±0.30 dex.
On the contrary, the best fitting for the Fe I line at λ4063 Å has the form
The equivalent widths vary between 0.48 and 2.86 Å and the standard desviation has a value of σ=±0.30 dex.
The results for the metallicity estimated by equations (7) and (8) are shown in the sixth and seventh columns of Tables 4 and 5. At the bottom of Figure 4 we observe the dependence of the Fe I lines on metallicity (see left and right panels).
4. RESULTS AND DISCUSSION
The results for the stellar parameters of the sample studied are shown in Table 4 (Columns 3, 5 and 6) and Table 5 (Columns 3, 4, 6 and 7). In general, the limitation of the spectral range and the small number of objects with identified stellar parameters imply that spectroscopic calibrations cannot be applied individually to the total sample studied.
For the warm-PAGB stars, we observe that the Ca IIK line shows a strong dependence on the effective temperature (see Figure 4). However, the equivalent widths have been measured only for 9 objects out of a total of 29 identified. In order to expand the number of objects with the new values of Teff , we estimated the equivalent widths of the Ca IIK line from the Fe,Ti II (λ4172-9 Å) blend and Fe I (λ4383 Å).
Clearly, this procedure introduces an uncertainty of ±220K to the temperature of the additional PAGB stars, i.e. 07253−2001, 08213−3857, 11201−6545, 11387−6113, 14482−5725, 14488−5405, 15310−6149, 17208−3859, 17310−3432, 17579−3121 and 19207+2023. A similar procedure has been applied to surface gravity and metallicity in order to add new values for those objects not studied.
For the surface gravity the equivalent width of the Fe,Ti II (λ4172-9 Å) blend is derived from the Mg II (λ4481 Å) line and 4 PAGB stars (07253−2001, 11201−6545, 14482−5725 and 14488−5405) were added with an uncertainty of ±0.30. The OI(λ7771-5 Å) triplet line can also be used to determine the surface gravity of those stars with 1.0 ≤ log g ≤ 2.2. According to the MK classification system the O I triplet is sensitive to luminosity (or gravity).
For the metallicity the neutral iron blend of Fe I (λ4271 Å) is determined from the Fe I (λ4383 Å) line. An uncertainty of ±0.31 dex is estimated for the additional PAGB stars; 07253−2001, 08005−2356, 11201−6545, 14482−5725, 14488−5405 and 15310−6149.
For cold-PAGB stars, however, the G-band and Fe I (4383 Å) line measures of equivalent widths are available for most objects, except for the SrII (4077 Å) and Ca I (λ4226 Å) line that is present only in 12 and 17 objects. Unfortunately, the number of objects with identified stellar parameters is very scarce, which means that the calibrations made are somewhat unreliable. The results on the metallicity that have a subindex “a” represent the values obtained from equation 9.
We can compare our results for Teff and logg with a source with values obtained from photometric calibrations for PAGB and RV Tauri stars (Molina 2012). The values of T eff and log g determined from the photometric calibrations are found in the second and fourth columns of Tables 4 and 5, respectively. In the top and bottom panels of Figure 5 we can see the comparison between the spectroscopic and photometric calibrations.
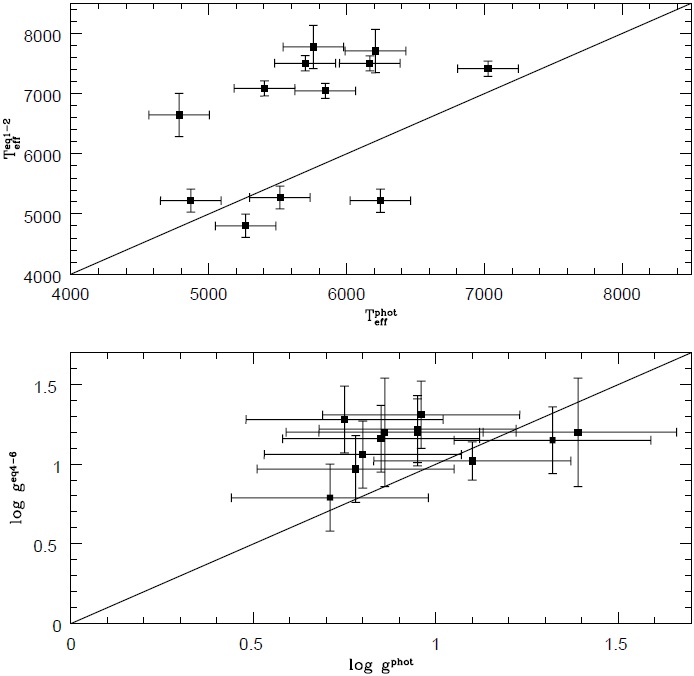
Fig. 5 Comparation between effective temperature and surface gravity obtained from 2MASS photometry by Molina (2012) and effective temperature and surface gravity estimated in this work (see upper and bottom panels). The solid straight line in each panel denotes perfect agreement between the sets of data.
In Figure 5 we can observe that the Tspeceff and log gspec obtained spectroscopically from equation (1) and (3) (warm stars) and from equations (2) and (5) (cold stars) are slightly higher than Tphoteff and log gphot obtained photometrically from Molina’s calibrations. PAGB stars with temperature close to 5000K seem to be adjusted satisfactorily, but at higher temperatures the dispersion increases. For the surface gravity, on the other hand, the spectroscopic values show agreement within their uncertainties with the photometric values. These results indicate that the interstellar and circumstellar reddening significantly affects the fundamental parameters when using photometric techniques.
Finally, the equivalent widths of the O IT line do not show dependence on distances derived by Vickers et al.(2015).
5. SUMMARY AND CONCLUSIONS
We presented a set of spectroscopic calibrations to obtain Teff, log g, and [Fe/H] from equivalent widths of stellar spectra. The criteria chosen for selection of the absorption features are similar to those employed by the MK classification system. Theequivalent widths for a total of 9 absorption features were measured.
We selected a total of 67 PAGB stars that include spectral types A and K, of which 48 have temperatures between 6000 and 8000 K (warm stars) and 19 have temperatures from 4500 to 5500 K (cold stars). For the determination of the spectroscopic calibrations we have identified literature stellar parameters of 21 warm-PAGB stars and 5 cold-PAGB stars.
We show the dependence of the stellar parameters on the equivalent widths, although the limitations present in the spectral ranges make it difficult to determine the temperature, gravity and metallicity for the stars in the sample without previous studies, i.e. 27 warm-and 14 cold-PAGB stars. These calibrations should be very useful to develop suitable criteria for the rapid and accurate determination of fundamental parameters of PAGB stars. The use of spectral criteria only is very important because it allows to define the parameters for such objects, while the photometric indexes are often distorted by poorly known interstellar and circumstellar reddening.
In future work it is possible to expand the spectral ranges and criteria in order to involve a greater number of absorption features and to improve our spectroscopic calibrations for warm-and cold-PAGB stars using high-resolution spectra.

