


 text new page (beta)
 English (pdf)
 Article in xml format
 Article references
 Send this article by e-mail
 Cited by SciELO
  Similars in
SciELO
Similars in
SciELO 
 Permalink
1. Introduction
Supernovae are known to be very luminous events of explosions of evolved stars that can shine as bright as a whole galaxy. They can be distinguished into different spectroscopic and physical types (Filippenko 1997). Type II supernovae are caused by a collapse of the iron core of a highly evolved massive star, which leads to the complete destruction of the star (Woosley & Janka 2005; Smartt 2009; Janka 2012). The SN types Ib and Ic also emerge from the collapse of a massive star, but it has lost its outer hydrogen and/or helium layer. Supernovae of the type Ia (Leibundgut 2000; Parrent et al. 2014) are of special interest due to their applications in cosmology showing that the expansion of the universe is actually accelerated (Riess et al. 1998; Perlmutter et al. 1999). Type Ia SNe are believed to be the explosion of a white dwarf (WD) in a binary system (Maoz et al. 2014). The WD accretes matter from a companion star and eventually approaches a critical mass leading to the complete disruption of the WD. However, many physical details about the event of a SNe Ia, like the progenitor or the explosion mechanism, are still unknown, which makes it important to study and model their spectra in detail.
While supernovae are explosions of entire stars, novae are bright eruptions that occur only on the surface of a white dwarf in a binary system (Starrfield et al. 2016). In a thermonuclear runaway hydrogen that has been accreted from the companion star is burned and causes an eruption of gas and a sudden and strong rise in brightness.
Both supernovae and novae have in common that their brightness coincides with the rapid ejection of stellar material. The spectra of both types of objects show lines with broad features, which have during the first days after the outbreak a clear P Cygni line profile caused by their expanding envelopes. Supernovae present the broader features due to higher expansion velocities of the envelope of up to 30,000 km s−1. Nova spectra also show broad features with expansion velocities of up to a few thousand km s−1. Late time spectra of both type of objects have emission lines which still show broad features when compared to the narrow absorption lines in the spectra of main sequence stars or when compared to the absorption features caused by the Earth’s atmosphere known as telluric lines.
Ground-based observations have to deal with the Earth’s atmosphere as a source for additional absorption and emission in the observed spectra. These telluric lines appear abundantly in the red and nearinfrared wavelength regions. Usually, low resolution spectra are taken of supernovae, which is sufficient because of their broad features and low apparent magnitudes. Spectral lines of novae have also broad features, and a lower resolution is sufficient to detect and study the spectral features. Because of the low resolution, the telluric lines cannot be identified specifically and will cause an unknown error in the measured flux. However, this error is usually small and may not be important for a general spectral analysis and for the modeling of synthetic spectra.
Thanks to newer observations with high resolution spectrographs, it is possible to study in detail the effects of telluric lines in the spectra of supernovae and novae. This will also quantify the error in the low resolution spectra and, therefore, the accuracy of fits obtained with theoretical models. This topic has not been studied in many details. It is known that telluric lines need to be considered as possible errors in the K-correction of near infrared observations (Boldt et al. 2014). High signal-tonoise ratio spectra of SN 1993J have been used to study the effects of telluric lines in supernova spectra (Matheson et al. 2000b). However, the observations presented in that study still had a quite low spectral resolution ranging from 2.5 to 15 Å (Matheson et al. 2000a).
In this paper, we will present in Section 2 a new method for how to eliminate the telluric lines from high resolution supernova and nova spectra. As an example, we applied the method to high resolution spectra of SN 2014J and present the results of the study of the effects of telluric lines in Section 3. In Section 4, we demonstrate the application of the new method on nova spectra, which have narrower features, but as we show our method is still quite efficient to remove the telluric lines as we demonstrate with the observed spectra of Nova V5668 Sgr. We close this paper with a short summary and conclusions in Section 5.
2. Methods for the removal of telluric lines
The absorption by telluric lines has a clear effect on high and low resolution spectra in observations by a ground-based telescope. There exist different methods and software packages to remove these lines from observed stellar spectra. In this section, we will present molecfit as a possible tool to remove telluric lines from supernova and nova spectra. In addition, we will introduce a new and more efficient method for telluric line removal and test it with theoretical type Ia supernova spectra and observed spectra of SN 2014J.
2.1. High Resolution Spectra
We obtained a time series of high resolution spectra of the type Ia supernova SN 2014J (Jack et al. 2015), which exploded in January 2014 in the M82 galaxy, with the TIGRE telescope situated near the city of Guanajuato in Central Mexico. The Nova V5668 Sgr (Jack et al. 2016), which erupted in March 2015, gave us a further opportunity to observe a time series of high resolution spectra. The telescope has an aperture of 1.2 m, and its HEROSéchelle spectrograph has a resolution of R ≈ 20, 000 and obtains optical spectra in the wavelength range between 3800 and 8800 Å in two different channels (red and blue). For a detailed description of the technical details of the TIGRE telescope and its equipment, see Schmitt et al. (2014). Because of TIGRE being a groundbased telescope, all observed spectra contain telluric lines, which are clearly present in the spectra of the red channel (5800 to 8800 Å) of the HEROS spectrograph.
To illustrate the effects of telluric lines on the spectra, we present a spectrum of SN 2014J obtained on January 31 in 2014, which was observed around maximum light of that supernova. Figure 1 shows the high resolution spectrum (red line) observed by the TIGRE telescope and a low resolution spectrum (R ≈ 200) (black line) that we obtained by binning our observation. The telluric lines can have an effect on the shapes of some of the supernova features in the spectrum as there are several drops in the flux of the low resolution spectrum in the various telluric line regions. A bit below 6000 Å a band of H2O telluric lines is affecting the observed spectrum. Broader telluric line bands like the B-band around 6900 Å and the A-band around 7600 Å are features of O2 lines. Water (H2O) is causing strong telluric absorption in several regions in the spectrum. The respective broad bands of telluric line absorption are labeled in Fig. 1. The narrow and deep lines observed a bit below 6000 Å are features of interstellar absorption of the Na I D doublet line. The spikes in the spectrum are due to cosmic-ray hits and other errors of the completely automatic data reduction process since the spectra have not been median filtered. Technical details about the data reduction pipeline can be found in Schmitt et al. (2014).
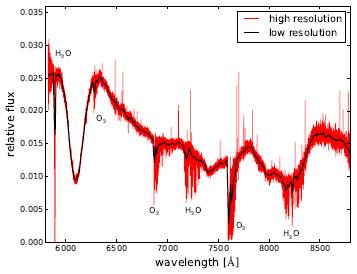
Fig. 1 High (R ≈ 20, 000) and low (R ≈ 200) resolution spectra of SN 2014J observed on January 31 in 2014. The regions with telluric lines are clearly visible and cause also drops in the low resolution spectra.
Obtaining a low resolution spectrum definitely improves the signal-to-noise ratio (S/N). However, the telluric lines are also binned and it is not possible to clearly identify them nor to quantify their effect on the spectrum and on the supernova features in the respective wavelength ranges. This is only possible with the full high resolution spectrum.
2.2. Telluric line removal with molecfit
molecfit is a software tool developed by the ESO to correct astronomical observations for atmospheric absorption features (Smette et al. 2015; Kausch et al. 2015). Usually, it is necessary to correct observations in the near-infrared wavelength range. However, the TIGRE spectra of the red channel are also affected by telluric lines. In the nearinfrared there is also emission from the sky, which can be corrected with Skycorr (Noll et al. 2014), but this is not necessary in the wavelength range of the HEROS spectrograph. molecfit has been adopted for observations with the TIGRE telescope (Kohl et al. 2016), and it is usually applied to correct stellar spectra. It creates a model spectrum with just the telluric lines. The observed spectrum is then divided by the telluric spectrum to obtain the corrected spectrum. molecfit requires a lot of information to run. These are the exact position of the object in the sky, location of the telescope, and detailed weather information, like air temperature and pressure among others. A simple Earth atmosphere structure during the time of observation is simulated in order to obtain the model spectrum with the telluric lines of molecfit.
We applied molecfit to correct our observed spectra of SN 2014J for telluric lines. For many wavelength ranges molecfit gives a reasonable fit and the telluric lines can be removed. However, the main problem seems to be the determination of the continuum in the supernova spectra. This becomes very clear in the wavelength range between 5880 and 6000 Å, although there are only very few telluric lines in that region. As Fig. 2 illustrates, the interstellar absorption features of the Na I D doublet cause a reduced flux in that wavelength range, which leads to a bad fit of the continuum. This is the best telluric model fit that we could obtain, and we are not sure why the flux goes down to 0. In general, supernova spectra have broad features which are not comparable to the usually much simpler continuum in stellar spectra. The small telluric lines are well represented in the model spectrum. The telluric lines at ≈ 5940 Å are also present in the molecfit model spectrum, but a division would lead to a big error in the continuum flux, which actually is the flux of the various supernova features.
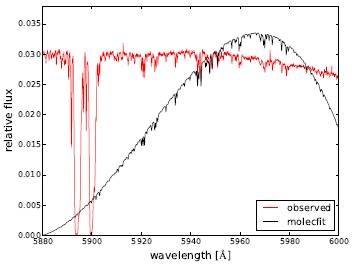
Fig. 2 Observed spectrum of SN 2014J (red) in comparison with the telluric line model spectrum of molecfit (black). The broad interstellar absorption features of the Na I D doublet line may cause problems in the continuum fit, which goes down to 0. The telluric lines have been modeled correctly.
We have tried to obtain a molecfit model spectrum for our observations of Nova V5668 Sgr, but nova spectra have smaller features and it was not possible to obtain any reasonable molecfit fit to the observed spectra due to the problem of determining the continuum. Because it was designed for stellar spectra, molecfit does not work well for supernova and nova spectra. One strategy might be to use shorter wavelength ranges to improve the fits and to be able to remove the telluric lines. In fact, molecfit fit has been successfully used for correcting high resolution supernova spectra, e.g. in a study where the focus was on the interstellar and intergalactic absorption features (Ferretti et al. 2016). However, to obtain the pure supernova spectrum, it is not necessary to apply a sophisticated model of the telluric line absorption. In fact, all small scale features need to be eliminated from the spectrum. This is the reason why we will present a new method for telluric line removal in the following section.
2.3. A new telluric line removal method
We developed a new method especially designed to remove telluric lines from high resolution supernova and nova spectra. The general idea is to try to eliminate all small scale features from the observed spectra. Therefore, this method will not only remove telluric lines but also get rid of all features of interstellar and intergalactic absorption as well as smoothen the noise of the observations and correct for errors in the data reduction or possible cosmicray hits. Looking directly at the spectra, it is obvious that one could by eye identify the continuum and all the narrow lines and in that way remove all telluric lines by hand. However, this is very time consuming and would not smoothen the spectrum. Thus, we present in the following a new method that is completely automatic. The script has been written in Python, takes only a few seconds to run, and obtains very good results.
What distinguishes a narrow line from the broad features in supernova and nova spectra is that a narrow line can be broadened by any broadening method while this will have no effect on the already very broad features. We will use this fact to identify the wavelength regions with the narrow features and to remove them from the spectrum.
In Fig. 3, we illustrate the method of how to remove all the small scale features from a high resolution spectrum of SN 2014J. The presented wavelength range of the observed spectrum (red) contains many telluric lines, and the peak around 7220 Å comes probably from a cosmic-ray hit. The first step is to broaden the spectrum using the Gaussian kernel broadening function of the PyAstronomy1 software package. The important parameter here is σ1, which represents the width or standard deviation of the Gaussian function. The whole spectrum is convoluted with the Gaussian kernel function, and this first broadening will get rid of the noise in the resulting spectrum (blue) and also of cosmic-ray hits as the one at about 7220 Å. In a next step, we broaden the spectrum a second time in order to obtain a spectrum (green) where the telluric lines are even broader using σ2 as another important parameter representing the standard deviation of the second Gaussian function. For the parameters we always use σ1 < σ2. Both broadening procedures have no effect on the supernova features. Having now the two broadened spectra, the following step is to erase the marked green areas from the first spectrum. These are the regions where the flux F1 is lower than a given factor f of the flux of the second F2 broadened spectrum. In these wavelength ranges we set the new flux to be the flux of the second broadened spectrum:
where
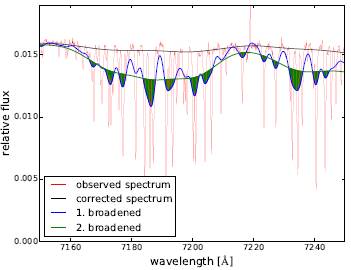
Fig. 3 Illustration of the first iteration of the new method. We broaden the observed spectrum (red) with two different widths (blue and green). The lower part gets remove (green area) and a new iteration starts eventually resulting in the corrected spectrum (black).
The factor f is lower but close to one. It needs to be introduced because of the noise in the spectra. For a spectrum with very high S/N, this factor could be set to one, while for a low S/N spectrum it needs to be adapted to a lower value. We now have as a result a new spectrum which will replace as the first broadened spectrum during the next iteration. This means that we will broaden the new spectrum a second time obtaining F2 and apply again the comparison with F1. Performing many iterations this will finally get rid of all small scale structures and give the final corrected spectrum (black line), where the telluric lines have been successfully removed from the observed spectrum. The cosmic-ray hit at a wavelength of ≈ 7220 Å has also been erased as well as all the noise in the observations.
The method has three parameters which need to be specified and tested in order to obtain the best result. These parameters are the widths or standard deviation of both Gaussian kernel functions (σ1 and σ2) as well as the factor f. For the here presented example we used the following values: σ1 = 0.8 Å, σ2 = 5.5 Å, and f = 0.994. In total we performed 75 iterations to obtain the final converged spectrum. The script takes about 70 s to run on a normal desktop computer for the whole spectrum of the red channel from 5800 to 8800 Å. The time consuming part is obviously the broadening procedure of a convolution with a Gaussian kernel function. We tried other broadening methods like just doing a simple binning of the data. However, the best results were obtained by using the Gaussian kernel function convolution with the observed spectrum. To further improve the method, we use a larger value of σ2 of 15 Å in two broader telluric bands between 6800 and 7400 Å and between 7500 and 7800 Å.
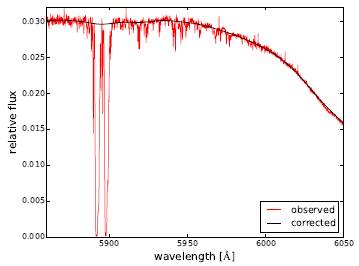
To demonstrate that not only the telluric lines get successfully removed with the new method, we present in Fig. 4 the spectrum of SN 2014J in the wavelength range of the Na I D doublet interstellar absorption features. The red line represents the observed and the black one the corrected spectrum. It is nicely illustrated that the new method also removes the interstellar absorption features, while for molecfit they actually just caused problems. In addition, the telluric lines in that wavelength range have been removed and the spectrum has been smoothened resulting in a spectrum that just contains the flux of the supernova.
2.4. Tests with synthetic SN Ia spectra
To test the new method in more detail we used a synthetic supernova spectrum calculated with the model atmosphere code PHOENIX (Jack et al. 2011, 2012). We selected a typical spectrum of a type Ia supernova around maximum light using the W7 explosion model. We used the respective wavelength range of the red channel and set the spectral resolution to the value of the TIGRE spectra (R = 20,000). We used a model of a telluric line spectrum calculated with molecfit and multiplied it with the PHOENIX spectrum to obtain a synthetic spectrum with telluric lines.
The advantage of using a synthetic spectrum is that it does not contain any noise or other errors like cosmic ray hits etc. In fact, for this free of noise spectrum it is possible to apply a simple asymmetric sigma clipping method. For sigma clipping the median of a small wavelength region is calculated and all points that are smaller or larger than a certain deviation from that median are eliminated. We applied here an assymetric sigma clipping method meaning that only the points with a smaller value are deleted, because the telluric lines are only in absorption. This erases efficiently the telluric lines since they present only thin absorption features. We compared the corrected spectrum with the original synthetic spectrum to see if the telluric line correction worked as expected. In Fig. 5, we present the errors after the correction in the upper plot. The error is defined as the corrected flux minus the original flux divided by the original flux. The maximal errors found are only of the order of 2% and are located in the broad telluric bands around 7600 Å and 8200 Å.
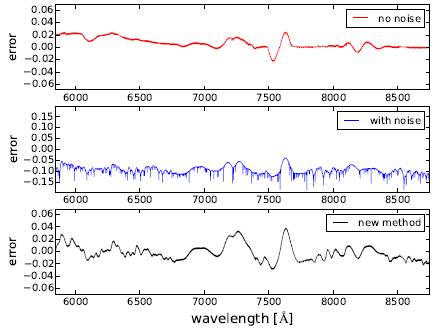
Fig. 5 Errors of the different methods. (top) Synthetic spectrum with no noise corrected with the asymmetric sigma clipping method (middle) The same but with added noise. (bottom) Spectrum with noise corrected with the new method.
Greater differences occur only when noise is added to the theoretical spectrum. In a further test, we added noise of 5% to the flux of the synthetic spectrum which corresponds to a signal-to-noise ratio of about 20. The plot in the middle of Fig. 5 shows the resulting errors when applying the asymmetric sigma clipping method to the synthetic spectrum with noise. Hence, this correction method does not work very well resulting in errors in some part of the spectrum of up to 15%. Please note the changing scales of the y-axis in the three different plots.
For the case of a synthetic spectrum with noise, it is absolutely necessary to perform the above described new method of telluric line removal using two broadened spectra. The lower plot of Fig. 5 shows the resulting errors of the new method when comparing the corrected with the original spectrum. The maximal error in the broad telluric bands is about 3%.
2.4.1. Determining the best parameters
We also used the synthetic spectrum to determine the best values for the parameters of the new method for the case of a spectrum with telluric lines and noise. All parameters of the new method were changed covering certain ranges, and we calculated the sum of the squared errors for every set of parameters. We eventually selected the set of parameters where the resulting sum of the squared errors had the lowest value.
We used this set of parameters to correct the SN 2014J spectra observed with the TIGRE telescope, because these spectra have the same resolution and a similar signal-to-noise ratio. For spectra observed with a different telescope it might be necessary to change the parameters due to the different resolution and signal-to-noise ratio of the spectra.
3. Application to supernova spectra
We applied the above presented new method of telluric line removal to our observed time series of spectra of SN 2014J. As has already been shown in Section 2, the method works very well with supernova spectra because of their naturally very broad features. We will now present a more detailed analysis about the effects of telluric line absorption in supernova spectra with low resolution, where the telluric lines cannot be identified and removed.
Figure 6 shows the observed (red) and corrected (black) spectrum of SN 2014J in the red channel between 5800 and 8800 Å. All telluric lines as well as the interstellar and intergalactic absorption features have been successfully removed, and the spectrum has been smoothened. There are several wavelength ranges where the telluric lines have reduced the flux of the original supernova features quite strongly. We used the best set of parameters as obtained in the previous section. However, it is still necessary to check the corrected spectrum with the eye. In Fig. 6, the corrected spectrum starts to differ at the bottom of the Si II feature around 6100 Å.
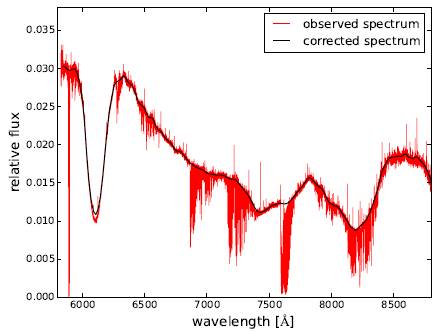
Fig. 6 Observed (red) and corrected (black) spectrum of SN 2014J in the red channel between 5800 and 8800 ̊A. The telluric lines have been successfully removed.
We calculated the flux differences between the observed and corrected spectrum to determine the effect of the telluric line absorption on supernova spectra. The total flux difference in the red channel is just 3.3%, meaning that the effects of the telluric lines are not important for the overall spectrum. However, there are several smaller regions where strong bands of telluric absorption affect the spectrum. In the A-band at a wavelength range between 7590 and 7705 Å, the flux of the observed spectrum has been reduced by 28.5% compared with the corrected spectrum. Therefore, the effect of telluric lines is significant and may have an effect on the modeling of spectra when fitting in this wavelength range. Possible O I and/or Mg II features have been found in this wavelength range around 7500 Å in the modeling of theoretical supernova spectra (Branch et al. 2005, 2006). In the B-band between 6865 and 6965 Å, the flux difference between observed and corrected spectra was found to be 8.4%. The telluric absorption lines between 8120 and 8380 Å cause a small difference in flux of about 8.4 %. This wavelength range contains features of the Ca II triplet, and hence they might be affected by telluric lines. For the band of telluric lines between 7150 and 7350 Å the flux difference between observed and corrected spectrum is about 7.9%.
This detailed study shows that there are certain wavelength ranges that are more affected than others. The post-maximum spectra of type Ia supernova are usually more complex and additional features like the ones of Fe II appear in the wavelength ranges that are affected by telluric line absorption (Branch et al. 2008). The differences calculated above will also be present in low resolution spectra of supernovae with no chance of correcting for them appropriately. This will introduce an error to the modeling of the respective features.
4. Application to nova spectra
With the TIGRE telescope we have obtained two dense time series of high resolution spectra of Nova V339 Del (De Gennaro Aquino et al. 2015) and Nova V5668 Sgr (Jack et al. 2016). In general, nova spectra show features that are significantly narrower than the ones of supernova spectra, but they are still much broader than the telluric lines or possible interstellar absorption features. Therefore, it is still feasible to identify telluric lines and interstellar absorption features and to erase them from the spectra. Thus, we applied the new method for telluric line removal with adapted parameters to the observed spectra of Nova V5668 Sgr.
In Fig. 7, we present a spectrum of Nova V5668 Sgr obtained on March 15 in 2015 in the wavelength range of the Hα line, which is usually the most prominent line in nova spectra. The observed spectrum (red) shows the small and narrow telluric lines that can be found in this wavelength range. For using the new telluric line removal method we adapted the parameters using for the widths of the two Gaussian kernel functions σ1 = 0.04 Å and σ2 = 0.4 Å. Because of the narrower features these two parameters need to have smaller values. For the factor we chose f = 0.994. With these parameters the telluric lines have been removed, although there are still some small dips seen in a few of the lines. At a wavelength of about 6550 Å one sees that the corrected spectrum (black) starts to deviate from the observed one. With higher values for the widths of the Gaussian functions, the nova spectra would be even more affected. Thus, one has to test different values for all of the parameters in order to obtain the best result for a certain spectrum or even certain wavelength ranges. However, the corrected spectrum now represents the nice P Cygni profile of the Hα line of Nova V5668 Sgr.
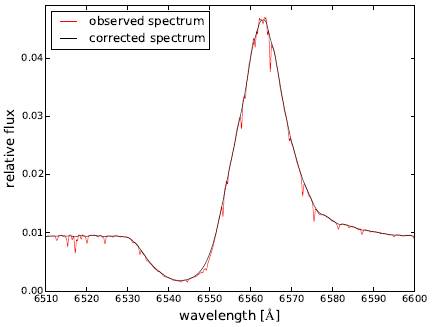
Fig. 7 Observed (red) and corrected (black) spectrum of Nova V5668 Sgr in the Hα wavelength range observed on March 20 in 2015.
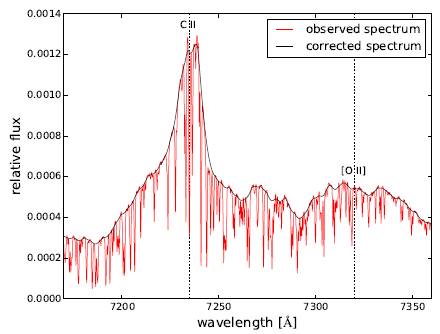
We applied the new telluric line correction method to a late time spectrum of Nova V5668 Sgr that only shows emission features. Figure 8 shows the observed (red) and corrected (black) spectrum observed on June 12 in 2015 in the wavelength range of a band of telluric lines between 7150 and 7350 Å. We had to change some of the parameters (σ1 =0.07 Å σ2 =0.7 Å) somewhat in order to more effectively eliminate the telluric lines. In the presented wavelength range of the spectrum there appear two clear emission features. One belongs to a line of C II at a rest wavelength of 7235.0 Å. The corrected spectrum shows the clear double peak structure of that feature which has been observed in many other lines (Jack et al. 2016). The second emission feature was identified as a forbidden line of [O II] at a rest wavelength of 7320.0 Å. This line is now also clearly visible in the corrected spectrum.
5. Summary and conclusions
We introduced a new method to eliminate telluric lines from high resolution supernova and nova spectra. This method removes all small scale or narrow features from the complete spectrum leaving behind just the spectrum with the broad features of the supernova or nova. Therefore, this method has the advantage of also eliminating all interstellar and intergalactic absorption features and, in addition, smoothens the spectra and erases errors like cosmicray hits. The method applies a Gaussian kernel function to broaden the spectra with two different widths (σ1 and σ2). Only the narrow lines will show a difference between the two broadened spectra while the supernova or nova features remain unchanged. This fact is used to eliminate all the small scale features from the observed spectrum.
We applied the new method to high resolution spectra (R ≈ 20,000) of the type Ia supernova SN 2014J observed with the TIGRE telescope. We demonstrated that the various features of interstellar absorption of the two Na I D doublet lines get successfully removed. We studied the effects of telluric line absorption on the resulting observed flux in low resolution spectra. The overall flux difference is with about 3% quite small. However, in the A-band the flux difference between observed and corrected spectrum is of up to 28.5%. This can definitely affect the results when modeling theoretical SN Ia spectra in that wavelength range, because features of O I and/or Mg II and during later phases Fe II have been observed. In other telluric line bands the flux difference was found to be lower at around 8%. Hence, telluric lines introduce an error into observed low resolution supernova spectra, since they cannot be identified and removed, but this study quantifies now the effect.
The new telluric line removal method can also be applied to high resolution nova spectra. The parameters (σ1, σ2, f) need to be adapted in order to obtain reasonable results, because the lines in novae show features that are narrower than the ones in supernova spectra. Therefore, the method will not work as well as for supernova spectra. However, with the observed spectra of Nova V5668 Sgr we demonstrated that the new method helps to obtain corrected spectra for the P Cygni feature of the most prominent hydrogen line Hα. During the later phase of pure emission spectra the new telluric line removal method can be applied to be able to identify the emission lines more easily as we demonstrated for a forbidden [O II] emission line in the observed high resolution spectrum of Nova V5668 Sgr.

