


 text new page (beta)
 English (pdf)
 Article in xml format
 Article references
 Send this article by e-mail
 Cited by SciELO
  Similars in
SciELO
Similars in
SciELO 
 Permalink
1. Introduction
DG CVn (GSC02003-00139) is an M4 star (Henry et al. 1994) which underwent a superflare on 2014 April 23rd. This event was detected in the X-ray/gamma-ray band by Swift/BAT (D’Elia et al. 2014; Xu et al. 2014; Drake et al. 2014a). Fender et al. (2015) measured a prompt radio flare associated with this X-ray/gamma-ray outburst, as well as a secondary radio flare about one day later. Multifrequency observations (optical, soft X-ray, hard X-ray) were published by Drake et al. (2014b) and Caballero-García et al. (2015). Caballero-García et al. (2015) showed that this superflare lasted for about four days in the optical band, with a peakto-peak amplitude of about 4mag (a steep rise and a very slow decay from a narrow peak). Various emission lines appeared, with irregular changes superimposed on a slow decline of this event. The multifrequency observations of this superflare were interpreted as the presence of a large and expanding active region on the star. This is similar to the most extreme solar flaring events (Caballero-García et al. 2015).
To place this unique superflare in the context of activity of late type stars, especially flaring stars (e.g. Mavridis & Avgoloupis 1986; Ishida et al. 1991; Melikian et al. 2011), it is necessary to investigate the nature of DG CVn.
DG CVn is a very fast rotator, as suggested by Robb et al. (1999) who discovered its optical variability and ascribed the modulation of brightness to a hot spot, whose projected area changes as the star rotates with a very short spin period of 2.6hours. Its peak-to-peak amplitude is less than 0.1mag(R). In addition, DG CVn is a binary, consisting of two similar components. The angular separation of both components of this binary is 0.17 arcsec and the orbital period Porb is 7years (Beuzit et al. 2004). A joint spectral type classification is M4.0V according to Riedel et al. (2014).
DG CVn displays activity but it is not known which of its stellar components (or both) is (are) active. DG CVn displayed the above-mentioned very strong X-ray outburst in 2014, but this star was known to display soft X-ray emission already in the years prior to this superflare (Bade et al. 1998). It has been identified with the X-ray source 1RXS J133146+291631 (Hünsch et al. 1999). Delfosse et al. (1998) also observed the hydrogen lines to be in emission, suggesting chromospheric activity. Beers et al. (1994) discovered DG CVn to have the Ca H&K lines in emission.
The very fast rotation (the short spin period of 2.6hours) (Robb et al. 1999) may be explained by its age. It is a very young star (≈ 150 million years) according to the evolution model in Caballero-García et al. (2015).
This paper reports a study of the long-term activity of DG CVn in the context of the activity of flaring stars.
2. Observations
The digitized photographic data of DG CVn and the reference stars were obtained from DASCH (Digital Access to a Sky Century @ Harvard1; Grindlay et al. 2012). This database provides SExtractor based photometry of every resolved object. Only the data which cover the blue spectral region were used for this analysis. The exposure time varied and was of the order of tens of minutes (longer than 30 minutes and sometimes longer than an hour). We will be referring to the brightness measured from these plates as magpg. The coverage of the light curve of DG CVn spans between the years 1895 and 1989. A single plate of the field of DG CVn was usually obtained per night.
To place the activity of DG CVn in the context of the long-term activity of flaring stars, CCD V -band observations of the ASAS-3 project2 (Pojmanski 1997) of the relatively bright objects, UV Cet and V371 Ori, were included. They were obtained with a 200/2.8 camera (field of view 8.5°×8.5°, exposure time of 180s and one CCD image of the field obtained per night). They mapped the fields of these flaring stars in a densely covered time segment during 2001-2009. (Nevertheless, the field of DG CVn was not observed). Only the observations with the assigned top quality A in the ASAS-3 file (Column 2 in the original data file) were included in this analysis. They represented 349 and 378 data points for UV Cet and V371 Ori, respectively. The error bars come from Column 7 in the original data file. A single CCD image of the field was usually obtained per night.
3. Data analysis
To assess whether the brightness variations of DG CVn, detected on the digitized DASCH plates, are intrinsic to this star or caused by artifacts, the brightness of DG CVn was compared to that of two reference stars. These stars, marked as C1 (TYC 2003-360-1) and C2 (13h 31m 25s ; 29◦19′26′′ (equinoctium 2000)), are shown in Figure 1. It displays the field of DG CVn in quiescence (JD 2 419 480.8182; Figure 1a) and during an intense flare (JD 2 433 774.6136; Figure 1b). Notice that Figure 1b contains less stars than Figure 1a because of a different plate limit. Also, C2 is below the plate limit in Figure 1b while DG CVn is the brightest star in this panel.

Fig. 1 The field of DG CVn in quiescence (JD 2419480.8182) ((a) left) and during a flare (JD 2433774.6136) ((b) right) on the digitized plates. Also the reference stars C1 and C2 are marked. C2 is below the plate limit in panel (b). North is up, East to the left. The field size is 19 arc min. See § 3 for details. The color figure can be viewed online.
Figure 2 shows the long-term light curve of DG CVn. Only the observations in which DG CVn was brighter by more than 0.5mag than the plate limit were used to suppress the noise. The same criterion was applied to the reference stars. All digitized plates in which DG CVn or the reference stars were influenced by plate defects were rejected. This led to the resulting 418 observations which were used for this analysis.
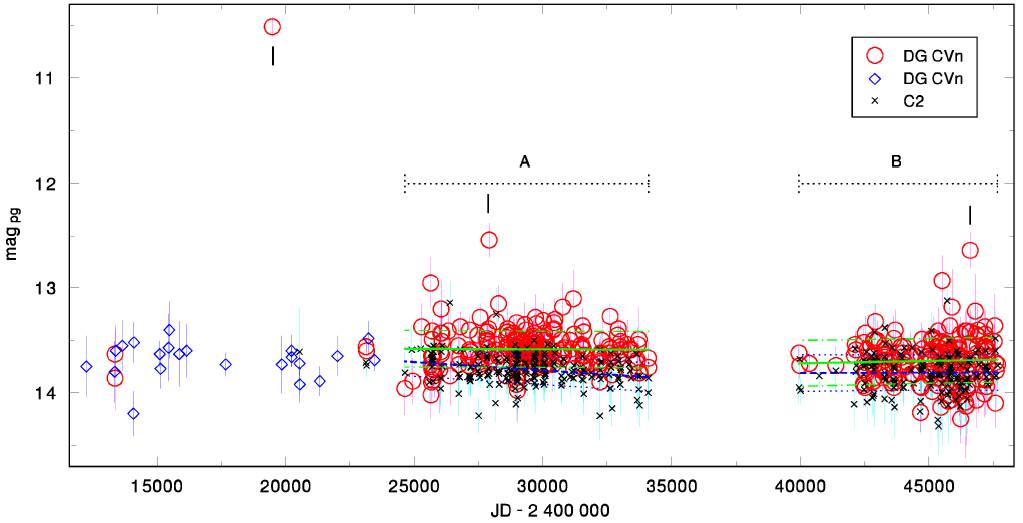
Fig. 2 Long-term light curve of DG CVn. The standard deviations of brightness, listed in the original data file, are displayed for each data point. The densely populated time segments are designated as A and B. The linear fits of brightness of DG CVn (green solid line) and the reference star C2 (blue dashed line) are shown for these time segments. Also the standard deviations of the fits are included. Notice that the scatter of brightness of DG CVn is larger than that of C2, of similar brightness. Three strongest brightenings of DG CVn are marked by the short vertical lines. See § 3 for details. The color figure can be viewed online.
I noticed that the data showed that DG CVn and C2 in JD 2432235.5 were remarkably faint (14.53 and 14.73magpg respectively), and in disagreement with other observations in the densely populated light curve. These two points were thus rejected from the analysis.
The DASCH database does not contain observations of DG CVn for a segment of several years, centered on JD 2437000. This gap corresponds to the so-called “Menzel gap” (e.g. Lund et al. 2016). Lund et al. (2016) noticed that many DASCH stars show apparent long-term trends in their light curves and these trends coincide with a systematic offset in the full set of DASCH light curves. This gap enables a natural division of the light curve of DG CVn into two densely populated parts, abbreviated as A (211 observations) and B (180 observations), as marked in Figure 2. Notice that the segment before JD 2424000 (the start of segment A) is much less densely populated and is used here to show that the activity of DG CVn is consistent with that in the later segments.
The linear fits to the brightness of DG CVn and the reference star C2 are shown for segments A and B, respectively (Figure 2). The standard deviations of the fits are also included. I conclude that the fits to the brightness of DG CVn in segments A and B can be considered to be parallel. The same is true for C2. This shows that the shift found by Lund et al. (2016) occurs also for DG CVn and C2.
Three events in which the brightness of DG CVn was higher by more than 1mag than the typical brightness in quiescence were observed. They are marked in Figure 2. To assess the reality of these flares and to exclude the influence of artifacts, the profiles of DG CVn and the reference stars in the brightest flares were determined by the code Aperture Photometry Tool (APT), version 2.4.9. The slices in two mutually perpendicular directions of DG CVn and the reference star C1 during the intense flare in JD 2 433 774.6136 are displayed in Figure 3. These profiles can be considered symmetric, regarding their comparison in the East-West direction. A similar result is obtained for the North-South direction, but the profile of each star is more narrow in this direction. This can be ascribed to a very small guiding error of the telescope during the plate exposure, not influencing the reliability of the event. The inspection of the profiles shows that this flare of DG CVn is a real phenomenon.
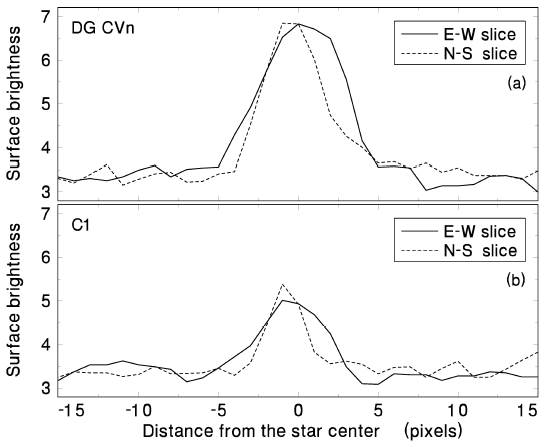
Fig. 3 Profiles of DG CVn and the reference star C1 during the bright flare on JD 2 433 774.6136. The solid line denotes the profiles in the East-West direction. The dashed line represents the profiles in the North-South direction. See § 3 for details.
The coverage of the light curve in Figure 2 is dense enough to confirm that any flares of DG CVn have durations of at most several days (corresponding to the time interval between the observations) and that their brightness does not differ by more than several tenths of mag.
The light curve of C2, whose brightness is quite similar to the typical brightness of DG CVn, is displayed for comparison in Figure 2. This enables to assess the scatter of brightness of both stars. The linear fits of brightness of DG CVn and C2 for the densely mapped time segments A and B show that the mean brightness of each star can be considered almost stable in each segment. The mean brightness of each of these stars is fainter by about 0.1magpg in segment B. For the above-mentioned time segments A and B marked in Figure 2, I obtain standard deviations of brightness of DG CVn of σDG = 0.18 and 0.22 magpg, respectively. For comparison, the standard deviations of brightness of C2 are σC2 = 0.13 magpg and 0.17 magpg, respectively. The scatter of brightness of DG CVn is thus always larger than that of C2 in a given segment. This comparison speaks in favor of fluctuations of brightness of DG CVn on short timescales (from night to night).
To assess the brightness variations of DG CVn and C2, I made their histograms for the densely populated segments A and B (Figure 4). The mean brightness of C2 remained stable both in segment A and segment B, as suggested by the mutually very similar positions of the peaks in the histograms in Figure 4. The histogram of DG CVn is broader and more asymmetric than that of C2, especially in segment B. This asymmetry with a tail toward the fainter magnitudes in segment B is caused by DG CVn being often fainter than in segment A.

Fig. 4 Histograms of brightness of DG CVn and the reference star C2 in the densely populated time segments. (a) Time segment A. For comparison, the arrow marks a flare shown in Figures 1b, 2, and 3a. (b) Time segment B. The horizontal dashed lines represent the level of 1 percent of observations in both panels. See § 3 for details.
The histograms of brightness of DG CVn have more extended tails toward larger brightness than the ones for C2. Both histograms for DG CVn display a bump near 13.4 magpg. This bump is not present in the histograms for C2. This indicates that the presence of this bump is intrinsic to DG CVn. The horizontal dashed lines in Figure 4 represent a level of 1 percent in the number of observations. The strongest flares (brightenings by more than about 0.5 magpg from the peak of the histogram in Figure 4) of DG CVn populate a weak tail of the histogram. It emerges that these flares represent less than 1 percent of the total number of observations.
To place the brightness variations of DG CVn in the context of the long-term activity of flaring stars, two other such objects with observed flares, UV Cet (Luyten 1949) and V371 Ori (Luyten & Hoffleit 1954) were included. The light curves, consisting of data of top quality A listed in the original data files, are displayed in Figure 5. To assess the quality of these data, the star TYC 5855-1883-1 was used as the reference star for UV Cet. In Figure 5a, the brightness of this star was shifted by +0.3 mag to better distinguish it from that of UV Cet. The brightness of this reference star is very similar to that of UV Cet in quiescence. This suggests that its uncertainties can be used as a measure of the uncertainties of the brightness of the flaring star. For the same purpose, HD 28826 was used for V371 Ori. These reference stars also show the stability of the detector in time, since there is no long-term trend in the brightness of these stars.
The histograms of UV Cet, V371 Ori, and their reference stars are displayed in Figures 5b and 5d. Note that all of these objects (UV Cet, V371 Ori, and their reference stars) display several points deviating toward fainter brightness. These reference stars are not listed as variable stars. To assess the influence of such deviating points (probably caused by instrumental effects), the level of 1 percent of observations is marked in the histograms in Figures 5b and 5d. This shows that these deviating points represent at most 1 percent of observations. I ascribe these deviating points to the observational uncertainties, which very rarely occur in CCD data of the highest quality A, assigned in the original ASAS-3 file. I therefore paid attention to the parts of the histograms which contain more than 1 percent of the observations.
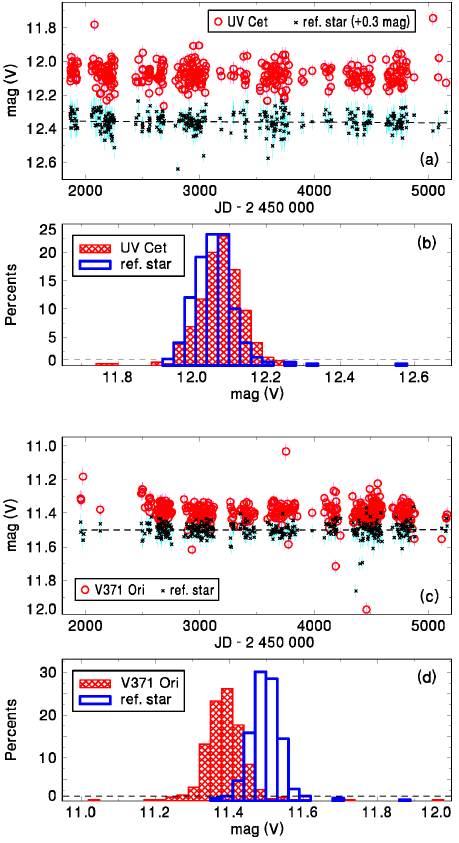
Fig. 5 (a) The light curve of UV Cet and the reference star in ASAS-3 data (V mag, one CCD image per night). A linear fit to the brightness of the reference star is marked by the dashed line. (b) Histograms of the brightness of UV Cet and the reference star. (c) The light curve of V371 Ori and the reference star in ASAS-3 data. (d) Histograms of the brightness of V371 Ori and the reference star. The horizontal dashed lines in panels (b) and (d) represent the level of 1 percent of the observations. See § 3 for details.
The height of the peak of the histogram of UV Cet is very similar to that of the reference star, but the symmetries of these peaks differ. The left side of the histogram of UV Cet is less steep than the right side. The histogram of V371 Ori displays a peak lower than that of the reference star. Any flares brighter than ≈ 0.3 mag(V) from the peak of the histogram represent less than 1 percent of the observed ASAS-3 data of both UV Cet and V371 Ori.
To reduce the influence of the most deviating points, I rejected both the four faintest/brightest points of each reference star. This reduced the scatter of their brightness significantly. For the sake of consistency, I did the same also for UV Cet and V371 Ori, although this removed some flares. I then searched for the relations between such ‘trimmed’ magnitudes. For the whole set, I obtained the standard deviation of brightness of UV Cet σUV = 0.0522 mag(V). For comparison, the standard deviations of brightness of TYC 5855-1883-1 is only σTYC = 0.0457 mag(V). I also obtained σV371 = 0.0459 mag(V ) for V371 Ori and σHD = 0.0345 mag(V) for HD 28826. The scatter of brightness of UV Cet and V371 Ori is thus always larger than that of their reference stars.
4. Discussion
This paper presents results regarding the longterm activity of DG CVn which underwent a superflare in 2014. I analyzed the photographic data recording almost 100 years of activity of this source, and assessed the variability of DG CVn by a method which does not rely on the profile of the light curve. I found that the standard deviation of the brightness, σDG, of DG CVn is larger by tens of percent than that of the reference star with a similar brightness. This suggests the presence of brightness fluctuations in DG CVn on short timescales (days). I ascribe the bump near 13.4 magpg in the histograms of Figure 4 to a new population of faint flares. In addition, I detected three large brightenings (by more than 1 mag) in these data. Although each of these three events is recorded only by a single data point, the time coverage suggests that the duration of such flares is at most several days (given by the separation of the observations), which is comparable to the superflare observed in 2014. These flares represent less than one percent of the photographic observations and are widely separated. The superflare, observed in a very broad range of frequencies, i.e. from gammaray through optical (Caballero-García et al. 2015) and radio-wavelengths (Fender et al. 2015 in 2014), is thus part of the activity which DG CVn displays only once every 100 years approximately.
The separation of the observations of DG CVn into segments A and B enabled me to remove the inconsistency in the DASCH data, found by Lund et al. (2016) who noted that many DASCH stars show apparent long-term trends in their light curves and that these trends coincide with a systematic offset caused by the so-called “Menzel gap”. The fits to the brightness of DG CVn in segments A and B (before and after this gap) can be considered parallel, with the shift caused by the instrumental effects. A comparison of segments A and B shows that the brightness of DG CVn really decreased more than that of C2. This suggests that the blue band brightness of DG CVn really decreased on timescales of years and decades. This fading of the brightness, present also in the histograms in Figure 4, can be caused by a decrease of the effective temperature of DG CVn, e.g. an increase in the number of spots. This change occurred on timescale considerably longer than the cycle-lengths observed in some M type dwarfs, as discussed below. For DG CVn, a much longer cycle-length of several decades is observed, which has been only partially recorded by the DASCH observations. Hosey et al. (2015) presented several types of the long-term variability of M dwarfs. The above-mentioned dimming of DG CVn is consistent with that of e.g. LHS1610AB, which showed a decrease of the V-band brightness superimposed on fluctuations during the observations spanning 14years (Hosey et al. 2015). Similar trends in the brightness evolution (instead of cycles) of M dwarfs might be more common. For example, GL 682 (spectral type M4) and GL388 (M5) in the set of Kafka (2012) displayed a trend of brightening on a timescale of about 7 years (the length of the observing campaign).
I placed the brightness variations of DG CVn in the context of the long-term activity of flaring stars. Although the observations of DG CVn are in a bluer band than the V -band used for the flaring stars UV Cet and V371 Ori, the same phenomenon (the standard deviations of their magnitudes, σUV and σV371, larger than those of their reference stars) is observed for all of them. This suggests that their brightnesses vary on timescales of days or shorter (given the fact that usually only a single observation per night was obtained). A typical time interval between the flares in flaring stars analyzed by Pazzani & Rodono (1981) is less than 30-60 min, Melikian et al. (2011) found it to be slightly less than 60 min in UV Cet. Although the data set in this paper uses only one observation per night, this short recurrence time of the flares could explain the large values of the standard deviation of the brightness observed for these flaring stars.
The histograms of all three flaring stars contain only a single peak. This bump possesses wings which are more complex than those of the reference stars (particularly regarding the wing toward the higher brightness). The flares with a rise larger than 0.35mag from the peak level of the histogram populate only the weak tails. In these histograms, the number of flares constitutes less than one percent of the observations in all three flaring stars (Figures 4 and 5bd). This suggests that the large-amplitude flares influence the properties of these histograms only slightly. The different width of the histogram and the large standard deviation of the brightness of the flaring star and the reference star are in favor of small-amplitude flares and possibly also of spin modulation. UV Cet is known to be a binary with a Porb of 26.52 years (Geyer et al. 1988), and its flaring activity varies with this period according to Melikian et al. (2011). The activity in Figure 5a therefore corresponds to the phases near the apastron when the flaring activity is near its minimum, and can be roughly one flare per two hours. Considering this variation of the flaring activity with the orbital phase also for DG CVn shows that the decrease of the mean brightness in segment B with respect to that in segment A occurred on a considerably longer timescale than the Porb of 7 years determined by Beuzit et al. (2004). DG CVn consists of two similar components, with a joint spectral type of M4.0V (Riedel et al. 2014), and it is not known which of them (or if both) cause the observed flaring activity.
I conclude that none of these three flaring stars shows any significant gradual cyclic variations of their baseline brightness on a timescale of years, as is observed in some late-type stars and ascribed to the solar-type cycle of activity (Vida et al. 2013). If present in DG CVn, UV Cet and V371 Ori, the variations would have very small amplitudes, and would be lost in the flaring activity and the noise. Such a cycle of the quiescent brightness with a length of about 5 years and a peak-to-peak amplitude of about 0.25 mag(B) was observed in the flaring star EV Lac of spectral type dM4.5e by Mavridis & Avgoloupis (1986). Also, two M dwarfs Gl 229 A (spectral type M1/2) and Gl752A (M2.5) show cyclic variations with cycle-lengths of about 5 and 7years, respectively, but with a peak-to-peak amplitude of only about 0.05 mag(V) (Buccino et al. 2011). By using the DASCH and ASAS data we would be able to detect the cycles in DG CVn, UV Cet, and V371 Ori if they had an amplitude comparable to that observed in EV Lac. A possible reason for the absence of a detectable cycle in DG CVn, UV Cet, and V371 Ori is that their spectral type is too late (mid-M). Such stars are expected to be fully convective. Nevertheless, the ability of very late-type stars to generate such cycles is controversial and may change for individual cases. According to Donati & Landstreet (2009), very-low-mass fully-convective stars (about M4V and later) are strongly active although they obviously lack the interface layer where conventional dynamo processes are expected to concentrate. Hosey et al. (2015) showed that the amplitude of the optical variability of M dwarfs, including the cycles on a timescale of years really varies from one star to another since some stars even later than M4V do display such cycles.

