


 text new page (beta)
 English (pdf)
 Article in xml format
 Article references
 Send this article by e-mail
 Cited by SciELO
  Similars in
SciELO
Similars in
SciELO 
 Permalink
Introduction
Unhealthy diets are an important risk factor for obesity, type 2 diabetes, cardiovascular disease, certain types of cancer, and mortality.1,2,3 In Mexico, the leading risk factors for the total burden of disease in 2013 were high plasma glucose, high BMI, and dietary risks, accounting for 11.7, 11.1 and 11% respectively, of the country’s disability-adjusted life-years lost.4 According to data from the Encuesta Nacional de Salud y Nutrición de Medio Camino 2016 (Ensanut-MC 2016), 72.5% of Mexican adults and over 30% of children and adolescents are currently overweight or obese. Furthermore, 9.4% of adults were diagnosed by a doctor with type 2 diabetes prior to the survey.5 These figures prompted the Ministry of Health to declare Mexico under an epidemiological emergency due to overweight, obesity and diabetes.6 Improving the diets of the Mexican population is urgent in order to reduce diet-related diseases and to improve health outcomes.
The Mexican authorities have implemented several policy measures, recognizing the enormous challenges that obesity and non-communicable diseases represent for the country’s welfare.7 Among these, the Instituto Nacional de Salud Pública (INSP) led the effort to develop the Mexican Dietary and Physical Activity Guidelines in the Context of Overweight and Obesity (MDPAG).8 The main objective of the guidelines is to promote a diet that improves the health of all Mexicans by preventing overweight, obesity, non-communicable diseases, and the most relevant vitamin and mineral deficiencies. The guidelines also emphasize the importance of food production sustainability and the recovery of Mexican traditional food ways.8
Using the MDPAG as a reference, analyses from the Ensanut 2012 showed that energy contribution from sugar-sweetened beverages (SSBs) and processed foods high in saturated fat and/or added sugars (HSFAS) was 13 percentage points above the maximum recommended intake, and only 10-22% of the population did not exceed the upper limit for SSBs.9,10 In comparison, energy contribution from two healthy food groups: legumes, and fruits and vegetables were 8.2 and 6.3 percentage points below recommendations.9 These previous analyses also pointed to important differences between population subgroups.
In the context of a changing food supply, continued research is necessary to track consumption patterns of major food groups relative to dietary recommendations, particularly among population subgroups of interest in order to identify challenges and opportunities to improve dietary intake of the Mexican population. Therefore, the aim of this analysis is to examine energy contribution of food groups both in the general Mexican population sand by population subgroups, using the most recent survey of 2016, and to compare it with the MDPAG using data from the last Ensanut that collected 24-hour recalls. Moreover, taking advantage of the use of the same methodology in both surveys, this study also aims to examine changes in energy contribution of food groups from 2012 to 2016, bearing in mind that these surveys were collected in different seasons. Ensanut 2012 was conducted between October and May, corresponding to the second half of autumn, winter and spring, whereas Ensanut-MC 2016 was conducted between May and September, corresponding to late spring, summer and the beginning of autumn in Mexico. Therefore, we anticipate that some of the observed changes, especially for fruits and vegetables, and SSBs will be partially explained by seasonal variation.11
Materials and methods
Design and sample
Ensanut-MC 2016 and Ensanut 2012 are probabilistic population-based surveys with a multistage, stratified sampling design, representative at the national and regional levels and for rural and urban areas. Detailed sampling procedures for both surveys are described elsewhere.12,13 Briefly, Ensanut-MC 2016 was conducted between May and September of 2016 and collected information from 9 479 households with a household response rate of 77.9%.12 Ensanut 2012 was conducted between October 2011 and May 2012, and collected information from 50 528 households, with a household response rate of 87%.13 Detailed dietary information was obtained for random subsamples in both surveys using 24-hour recalls (n=4 341 for Ensanut-MC 2016 and n=10 886 for Ensanut 2012). For both surveys, a second 24-hour recall on a non-consecutive day was collected for a subsample (»7% for Ensanut-MC 2016 and »9%). For the present analysis, we only used the first 24-hour recall and excluded children younger than 5y (n=3 190), pregnant and lactating women (n=245), and individuals with implausible intake (n=152). Plausible intake was defined as energy intakes between ±3 standard deviations from the ratio of energy intake and energy requirement, estimated using the Institute of Medicine equations for body weight maintenance. A thoroughly detailed description of the methods used to identify implausible intake is described elsewhere.14,15 Thus, the study sample included school-aged children (5-11y), adolescent (12-19y) and adult (≥20y) men, and non-pregnant, non-lactating adolescent and adult women with complete socioeconomic information (n=3 661 for Ensanut-MC 2016 and n=7 979 for Ensanut 2012).
Dietary assessment
The 24-hour recall was collected through an interview to ≥15-year old individuals by trained personnel between Monday and Sunday, using an automated 5-step multiple-pass method.16 Participants were asked to report all foods and beverages consumed the previous day. The person responsible for food preparation in the household provided information of food intake of children and adolescents <15y old. Children or adolescents complemented the interview by reporting food eaten away from home. Intake could be reported as individual foods or beverages (e.g. apple or soda) or mixed dishes (e.g. sandwich or smoothie). Mixed dishes could be then disaggregated to its ingredients if the participant knew the amounts used in its preparation. Otherwise, the mixed dish was recorded as a standard preparation. Tortilla and other typical foods of specific regions were weighted to capture the variability between different regions of the country. The energy content was estimated using the 2016 food composition table compiled by the INSP.*
Food group classification
Foods reported as disaggregated and standard recipes were analyzed at their ingredient level, while beverages were kept as a single unit. For example, a sandwich was disaggregated to bread, cheese, ham, avocado, tomato, etc., whereas beverages prepared with different ingredients (e.g. coffee with sugar) were maintained as a single unit. Milk and dairy beverages were the exception and were treated as disaggregated foods in order to avoid underestimating milk intake.
Foods and beverages were then classified into 24 specific food groups, which in turn were aggregated into eight major food groups as follows: 1) whole grains, refined grains and tubers, grouped as ‘cereals and tubers’; 2) legumes, seeds and nuts, grouped as ‘legumes and nuts’; 3) low-fat dairy, high-fat dairy, and dairy with added sugar, grouped as ‘milk and dairy’; 4) eggs, red meat, processed meat, poultry, and fish and seafood, grouped as ‘meat and animal products’, 5) fruits, vegetables, and 100% fruit or vegetable juices, grouped as ‘fruits and vegetables’, 6) fats and oils, 7) manufactured sugar-sweetened beverages (SSBs), homemade SSBs and alcoholic beverages, grouped as ‘SSBs’, and 8) grains with added sugar, sweets and sweeteners, desserts, and snacks, grouped as ‘products high in saturated fat and/or added sugar (HSFAS)’. The energy contribution from the abovementioned food groups accounted for 99.0% of the total energy intake. Foods and beverages not included were condiments, baby foods, beverages used for cooking (beer or juices), and non-dairy non-sweetened beverages.
Whole grains were defined as grains with ≥10g of total fiber per 100g of carbohydrates, and refined grains were classified otherwise.17 Grain products with ≥13% of total energy from saturated fat or added sugar, regardless of their fiber content, were classified into the HSFAS products group. Low-fat dairy included milk and dairy with <3.5g of fat per 100 kcal, while high-fat dairy included milk and dairy with ≥3.5g of fat per 100 kcal. Dairy with ≥10g of sugar per 100 kcal was classified as dairy with added sugar, regardless of the fat content. The SSBs group included non-dairy beverages with added sugar and all alcoholic beverages. Within the SSBs group, manufactured SSBs included soft drinks, fruit beverages, flavored water, iced teas, soy drinks, and sports and energy drinks; and homemade SSBs included aguas frescas (traditional Mexican beverages usually prepared with water, fruit, and sugar), atole (a corn meal beverage) prepared with water and sugar, and homemade coffee or tea with sugar. The HSFAS products group included processed non-basic foods with 13% or more of total energy from saturated fat and/or added sugars. The HSFAS products group included salty snacks, grain-based desserts, ready-to-eat cereals, and other processed products with >13% of total energy from saturated fat and/or added sugars. The 13% cutoff point for saturated fats and/or added sugar was based on the International Choices Program.18
Given that food groups 1 through 6 contribute to the intake of essential nutrients, they were considered basic foods; whereas groups 7 and 8 (SSBs and HSFAS products), which provide a high amount of energy with low nutrient density, were considered discretionary foods.
Food groups recommendations
In order to document the adequacy of the population’s mean intake, we used the same recommendations as the previously mentioned analysis from 2012 based on the MDPAG.9 The MDPAG present thirteen specific and detailed dietary plans for different population groups that range from 1 000 kcal/d to 2 600 kcal/d, based on age and activity level. Each dietary plan suggests a set amount of daily servings for eight food groups (vegetables, fruits, cereals, legumes, meat and animal products, milk and dairy, sugars and fats). In order to compare intake against the dietary plans, we estimated the percentage of energy contribution (EC) from each food group for dietary plans included in the range between 1 300 and 2 600 kcal/day (nine dietary plans), corresponding to plans for school-aged children, adolescents and adults. Then, we estimated the average EC for each food group of the abovementioned plans. For the present analysis, the EC from vegetables and fruits was added. The MDPAG recommend decreasing intake of SSBs, pastries, cookies and desserts, and foods high in sugar, fat and sodium; and recommend a maximum 6-9% EC from added sugars. Nevertheless, they do not provide a maximum recommended EC for discretionary foods beyond added sugars. Thus, to be able to allocate products like salty snacks and cookies into a specific food group, this analysis combined non-essential foods and beverages into a “discretionary foods” category with a maximum EC of 13%, of which up to 3% can be supplied by SSBs and up to 10% by HSFAS products. The 3% cut-off point for SSBs was selected to be in line with the American Heart Association recommendation.19 This 13% maximum is not to be interpreted as a dietary guideline, but can be rather interpreted as a short-term dietary goal suggested by the authors of this paper, and could be further reduced in a longer term.
The recommended EC of food groups used in this analysis were as follows: 33% from cereals, 12% from legumes, 10% from milk and dairy, 10% from meat and animal products, 12% from fruit and vegetables, 10% from fats and oils, and no more than 3% from SSBs and 10% from HSFAS products.
Sociodemographic characteristics
The place of residence was categorized into rural and urban areas with locations of ≤2 500 inhabitants classified as rural, and otherwise, as urban. The geographical region was classified as North, Central, or South. The socioeconomic status (SES) index was assessed using principal components analysis based on household characteristics and assets; households were then categorized into tertiles. An individual was classified as having indigenous ethnicity if he/she lived in a household where the head of household or his/her spouse spoke an indigenous language. Education level (only for adults ≥20y) was categorized into four groups: lower than elementary school, finished elementary school, finished middle school, finished high school or higher (including normal and technical high school).
Statistical analysis
All analyses were conducted in Stata version 14.2‡ and were weighted to be nationally representative and to account for the complex survey design. Means and 95% confidence intervals for the percent EC from the eight major food groups and 24 specific food groups were estimated for the overall population, whereas the EC from the eight major food groups and a key selection of specific food groups (whole grains, refined grains, red meat, processed meat, fruits, vegetables, manufactured SSBs and homemade SSBs) was stratified by population subgroups. Differences in EC among subgroups were compared using bivariate linear regression models. No further adjustments were made for multiple comparison, but p-values and confidence intervals are presented in all tables. In order to compare between the percent ECs of 2012 and 2016, we estimated multivariate linear regression models using pooled data from both surveys; estimating one model per food group and adjusted by age group, sex, residence area, geographical region, tertiles of socioeconomic level, indigenous ethnicity, and weekend days (Friday through Sunday). Given that education level was only relevant for adults, we favored including all age groups and excluded the education level as a covariate. Predicted means were estimated using Stata’s -margins- command.
Informed consent was obtained from individuals aged ≥18y, and from the father, mother, or guardian of participants aged <18y. Informed assent was obtained for children and adolescents (5-17y). Both surveys were approved by the Research, Biosafety, and Ethics Committees of the INSP in Cuernavaca, Mexico.
Results
In both surveys, close to 75% of participants lived in urban areas, and 50% in the Central region of the country. A higher proportion of participants had higher education level in 2016 compared to 2012 (table I).
Table I Sociodemographic characteristics of participants by survey year. Mexico, Ensanut MC-2016 and Ensanut 2012*
|
2016 |
2012 |
p-value‡ |
||||
|
n |
% (95%CI) |
n |
% (95%CI) |
|||
|
n=3 661 |
n=7 979 |
|||||
|
Age group§ |
||||||
|
School-aged children |
1 085 |
15.9 (14.5,17.5) |
2 751 |
17.4 (16.4,18.5) |
0.02 |
|
|
Adolescents |
1 230 |
18.4 (16.7,20.2) |
2 055 |
15.7 (14.8,16.6) |
||
|
Adults |
1 346 |
65.7 (63.1,68.2) |
3 173 |
66.9 (65.5,68.3) |
||
|
Sex |
||||||
|
Men |
1 629 |
48.4 (44.8,52.1) |
3 803 |
49.4 (47.5,51.4) |
0.6 |
|
|
Women |
2 032 |
51.6 (47.9,55.2) |
4 176 |
50.6 (48.6,52.5) |
||
|
Residence area |
||||||
|
Urban |
1 725 |
75.1 (72.1,77.8) |
5 013 |
73.1 (71.5,74.7) |
0.3 |
|
|
Rural |
1 936 |
24.9 (22.2,27.9) |
2 966 |
26.9 (25.3,28.5) |
||
|
Geographical region |
||||||
|
North |
812 |
19.7 (16.5,23.3) |
1 910 |
19.8 (18.6,21.0) |
0.9 |
|
|
Central |
1 536 |
49.6 (45.3,53.9) |
3 307 |
48.7 (46.8,50.6) |
||
|
South |
1 313 |
30.7 (26.9,34.7) |
2 762 |
31.5 (29.9,33.3) |
||
|
Socioeconomic status |
||||||
|
Low |
1 262 |
21.2 (18.4,24.3) |
2 886 |
30.2 (28.4,32.1) |
<0.001 |
|
|
Medium |
1 309 |
29.3 (25.9,32.9) |
2 759 |
31.7 (29.9,33.7) |
||
|
High |
1 090 |
49.5 (44.7,54.3) |
2 334 |
38.0 (35.9,40.2) |
||
|
Indigenous ethnicity |
||||||
|
Yes |
524 |
8.2 (6.1,10.8) |
1 028 |
10.4 (9.1,12.0) |
0.1 |
|
|
No |
3 137 |
91.8 (89.2,93.9) |
6 951 |
89.6 (88.0,90.9) |
||
|
Education Level# |
||||||
|
Lower than elementary school |
418 |
20.8 (17.5,24.6) |
1 224 |
28.1 (25.9,30.4) |
0.02 |
|
|
Finished elementary school |
303 |
20.7 (16.9,25.1) |
685 |
21.9 (19.6,24.3) |
||
|
Finished middle school |
384 |
27.2 (22.9,31.9) |
656 |
24.3 (22.0,26.7) |
||
|
Finished high school or higher |
241 |
31.3 (25.5,37.7) |
608 |
25.8 (23.4,28.3) |
||
* Values are unweighted sample size, weighted percentages and 95% confidence interval (in parentheses). Data are from the Encuesta Nacional de Salud y Nutrición de Medio Camino 2016 (Ensanut-MC 2016), and the Encuesta Nacional de Salud y Nutrición 2012
‡Pearson’s chi2 corrected for the survey design
§School-aged children: 5 to 11 years; adolescents: 12 to 19 years; adults: ≥20 years
#Educational level is only from adults (>20 y)
Major food groups in 2016
Overall, cereals had the highest percent of EC of the total daily energy intake (30.1%), followed by meat and animal products (15.9%), HSFAS products (15.5%), and SSBs (10.5%) (table II). Fats and oils had an EC of 8.7%, while milk and dairy contributed 8% to the total daily energy intake. Fruits and vegetables, and legumes had the lowest contribution to the total daily energy intake, with 6.4 and 3.8%, respectively. HSFAS products and SSBs, considered discretionary foods, contributed with 26% to the total daily energy intake. Legumes had the lowest intake relative to the recommendations, with 8.2 percentage points (pp) of EC below the percentage suggested by the MDPAG; followed by fruits and vegetables (5.6 pp lower than recommended). The highest intake relative to recommendations was for SSBs, being 7.5 pp above the maximum percent suggested. Intake of meat and animal products, and HSFAS products also diverged significantly from the recommendations (5.9 and 5.5 pp above, respectively). In other words, SSBs, meat and animal products and HSFAS were 250, 59 and 55% above the recommended intake, respectively, whereas legumes, and fruits and vegetables were 68 and 47% below the recommended intake.
Table II Percent energy contribution from major food groups to total daily energy intake in 2016 by population subgroups. Mexico, Ensanut-MC 2016*
|
Cereals and tubers |
Legumes and nuts |
Milk and dairy |
Meat and animal products |
Fruits and vegetables |
Fats and oils |
SSBs |
HSFAS products |
||||||||||
|
Mean (95%CI) |
p-value‡ |
Mean (95%CI) |
p-value |
Mean (95%CI) |
p-value |
Mean (95%CI) |
p-value |
Mean (95%CI) |
p-value |
Mean (95%CI) |
p-value |
Mean (95%CI) |
p-value |
Mean (95%CI) |
p-value |
||
|
Overall |
30.1 (28.8, 31.4) |
3.8 (3.3, 4.2) |
8 (7.4, 8.7) |
15.9 (14.8, 16.9) |
6.4 (5.9, 7.0) |
8.7 (7.6, 9.8) |
10.5 (9.7, 11.2) |
15.5 (14.5, 16.6) |
|||||||||
|
Age group |
|||||||||||||||||
|
School-aged children |
27.2 (25.3, 29.2) |
ref |
3.1 (2.4, 3.7) |
ref |
12.3 (11.1, 13.5) |
ref |
14.2 (13.1, 15.3) |
ref |
6.0 (5.4, 6.7) |
ref |
8.9 (8.0, 9.8) |
ref |
7.8 (6.9, 8.6) |
ref |
19.9 (17.9, 21.8) |
ref |
|
|
Adolescents |
29.1 (27.8, 30.5) |
0.09 |
3.3 (2.7, 3.9) |
0.6 |
8.3 (7.1, 9.5) |
<0.001 |
15.2 (13.7, 16.7) |
0.3 |
5.3 (4.3, 6.2) |
0.1 |
9.4 (8.2, 10.5) |
0.5 |
10.3 (9.1, 11.6) |
0.002 |
18.1 (16.6, 19.6) |
0.1 |
|
|
Adults |
31.1 (29.4, 32.8) |
0.001 |
4.1 (3.5, 4.7) |
0.02 |
6.9 (6.0, 7.8) |
<0.001 |
16.5 (14.9, 18.0) |
0.02 |
6.8 (6.1, 7.6) |
0.05 |
8.5 (7.0, 10.0) |
0.6 |
11.2 (10.1, 12.2) |
<0.001 |
13.8 (12.4, 15.2) |
<0.001 |
|
|
Sex |
|||||||||||||||||
|
Men |
30.3 (28.5, 32.2) |
ref |
3.6 (3.0, 4.1) |
ref |
7.4 (6.6, 8.3) |
ref |
16.1 (14.6, 17.5) |
ref |
6.0 (5.2, 6.9) |
ref |
8.2 (7.4, 9.1) |
ref |
11.7 (10.6, 12.8) |
ref |
15.6 (14.1, 17.0) |
ref |
|
|
Women |
29.9 (28.4, 31.4) |
0.7 |
4.0 (3.4, 4.6) |
0.3 |
8.6 (7.7, 9.6) |
0.1 |
15.7 (14.3, 17.1) |
0.7 |
6.8 (6.1, 7.4) |
0.2 |
9.2 (7.3, 11.1) |
0.4 |
9.3 (8.4, 10.3) |
0.002 |
15.5 (14.0, 17.0) |
0.97 |
|
|
Residence area |
|||||||||||||||||
|
Urban |
28.0 (26.5, 29.5) |
ref |
3.3 (2.8, 3.8) |
ref |
8.4 (7.6, 9.3) |
ref |
16.8 (15.5, 18.2) |
ref |
6.6 (6.0, 7.3) |
ref |
8.9 (7.5, 10.3) |
ref |
10.6 (9.7, 11.5) |
ref |
16.2 (15.0, 17.5) |
ref |
|
|
Rural |
36.5 (34.5, 38.6) |
<0.001 |
5.2 (4.6, 5.9) |
<0.001 |
6.9 (6.0, 7.7) |
0.01 |
12.9 (11.9, 14.0) |
<0.001 |
5.8 (5.2, 6.3) |
0.1 |
8.2 (7.4, 9.1) |
0.4 |
10.1 (9.1, 11.0) |
0.5 |
13.5 (12.0, 14.9) |
0.005 |
|
|
Geographical region |
|||||||||||||||||
|
North |
22.7 (20.1, 25.4) |
ref |
3.6 (2.8, 4.4) |
ref |
8.0 (5.8, 10.2) |
ref |
18.2 (15.8, 20.6) |
ref |
5.6 (4.6, 6.7) |
ref |
11.1 (6.6, 15.7) |
ref |
13.3 (11.2, 15.5) |
ref |
16.2 (13.9, 18.5) |
ref |
|
|
Central |
29.5 (27.7, 31.3) |
<0.001 |
3.3 (2.7, 3.8) |
0.5 |
9.1 (8.2, 10.0) |
0.4 |
16.1 (14.5, 17.7) |
0.1 |
6.9 (5.9, 7.8) |
0.1 |
7.9 (7.1, 8.8) |
0.2 |
9.7 (8.7, 10.8) |
0.003 |
16.6 (15.1, 18.2) |
0.8 |
|
|
South |
35.8 (34.0, 37.7) |
<0.001 |
4.8 (3.7, 5.8) |
0.1 |
6.4 (5.4, 7.4) |
0.2 |
14.0 (12.7, 15.4) |
0.003 |
6.2 (5.5, 6.9) |
0.4 |
8.5 (7.5, 9.4) |
0.3 |
9.8 (8.7, 10.9) |
0.004 |
13.4 (11.8, 15.0) |
0.05 |
|
|
Socioeconomic level |
|||||||||||||||||
|
Low |
40.0 (37.8, 42.1) |
ref |
5.5 (4.6, 6.3) |
ref |
5.6 (4.8, 6.4) |
ref |
13.2 (11.9, 14.4) |
ref |
4.9 (4.3, 5.5) |
ref |
7.3 (6.5, 8.1) |
ref |
10.8 (9.6, 12.1) |
ref |
11.8 (10.4, 13.1) |
ref |
|
|
Medium |
31.1 (29.4, 32.7) |
<0.001 |
3.5 (2.9, 4.1) |
<0.001 |
7.9 (7.0, 8.8) |
<0.001 |
15.3 (14.0, 16.6) |
0.02 |
6.5 (5.4, 7.6) |
0.01 |
8.8 (8.0, 9.6) |
0.008 |
10.3 (9.3, 11.2) |
0.4 |
15.8 (14.2, 17.4) |
<0.001 |
|
|
High |
25.3 (23.6, 27.1) |
<0.001 |
3.2 (2.5, 4.0) |
<0.001 |
9.2 (8.0, 10.4) |
<0.001 |
17.3 (15.5, 19.2) |
<0.001 |
7.0 (6.2, 7.8) |
<0.001 |
9.3 (7.3, 11.4) |
0.1 |
10.4 (9.1, 11.7) |
0.7 |
17.0 (15.3, 18.7) |
<0.001 |
|
|
Indigenous ethnicity |
|||||||||||||||||
|
Yes |
41.7 (37.5, 45.8) |
ref |
6.0 (4.5, 7.6) |
ref |
5.5 (4.0, 7.0) |
ref |
11.3 (8.8, 13.9) |
ref |
6.8 (5.7, 7.9) |
ref |
5.5 (4.6, 6.4) |
ref |
8.2 (6.8, 9.6) |
ref |
13.3 (10.7, 15.9) |
ref |
|
|
No |
29.1 (27.8, 30.4) |
<0.001 |
3.6 (3.1, 4.0) |
0.003 |
8.3 (7.6, 9.0) |
0.001 |
16.3 (15.2, 17.4) |
<0.001 |
6.4 (5.8, 7.0) |
0.5 |
9.0 (7.9, 10.2) |
<0.001 |
10.7 (9.9, 11.5) |
0.003 |
15.7 (14.7, 16.8) |
0.1 |
|
|
Education level§ |
|||||||||||||||||
|
Lower than elementary school |
40.6 (36.8, 44.5) |
ref |
6.7 (5.3, 8.1) |
ref |
5.4 (4.2, 6.7) |
ref |
12.3 (10.4, 14.2) |
ref |
8.0 (6.0, 9.9) |
ref |
6.7 (5.6, 7.9) |
ref |
9.3 (7.8, 10.8) |
ref |
9.8 (7.7, 11.9) |
ref |
|
|
Finished elementary school |
34.3 (30.9, 37.6) |
0.01 |
3.5 (2.5, 4.4) |
<0.001 |
6.9 (5.3, 8.6) |
0.2 |
15.1 (12.8, 17.4) |
0.06 |
5.6 (4.4, 6.7) |
0.03 |
7.4 (5.8, 9.0) |
0.5 |
11.9 (10.0, 13.8) |
0.04 |
13.9 (11.2, 16.7) |
0.02 |
|
|
Finished middle school |
27.5 (24.2, 30.9) |
<0.001 |
4.4 (3.2, 5.6) |
0.009 |
7.3 (5.1, 9.5) |
0.2 |
17.6 (14.5, 20.8) |
0.005 |
7.0 (5.9, 8.2) |
0.4 |
9.2 (7.9, 10.5) |
0.003 |
12.6 (10.7, 14.6) |
0.006 |
13.2 (10.5, 16.0) |
0.1 |
|
|
Finished high school or higher |
25.7 (23.3, 28.2) |
<0.001 |
2.5 (1.8, 3.2) |
<0.001 |
7.6 (6.1, 9.1) |
0.04 |
19.1 (15.9, 22.4) |
<0.001 |
6.8 (5.5, 8.1) |
0.3 |
9.8 (5.4, 14.1) |
0.2 |
10.6 (8.3, 13.0) |
0.3 |
16.8 (13.9, 19.7) |
<0.001 |
|
SSBs: sugar-sweetened beverages; HSFAS: high in saturated fat and/or added sugar; ref: Reference category
* Values are unadjusted weighted means (95%CIs). Data are from the Encuesta Nacional de Salud y Nutrición de Medio Camino 2016 (Ensanu-MC 2016); n=3 661
‡p-values compare unadjusted weighted mean vs. category of reference (school-aged children, men, urban, north region, low SES, indigenous ethnicity, and lower than elementary school)
§Educational level is only from adults (>20 y)
There were important differences in EC among population subgroups. Within age groups, the average EC of the diet of adolescents and adults was lower in milk and dairy, and higher in SSBs, compared to school-aged children. Also, the EC percentages of cereals, legumes, and meat and animal products were higher in adults compared to school-aged children, whereas the EC of HSFAS products was higher in school-aged children compared to adults. Discretionary foods contributed 27.7% to total daily energy intake in school-aged children; 28.4%, in adolescents, and 25%, in adults; in other words, EC was the 14.7, 15.4 and 12 pp above the recommended intake, respectively.
Between men and women, the only observed difference was for SSBs, with a higher EC for men vs. women. The diets of individuals living in rural areas, in the Central and South regions of the country, of low-SES, of indigenous ethnicity, and who did not complete elementary school had higher EC from cereals and legumes, and lower EC for milk and dairy, meat and animal products, and HSFAS products relative to their respective counterparts (individuals living in urban areas, in the North region, of medium- and high-SES, of non-indigenous ethnicity, and who had completed elementary, middle, or high school). Exceptions being legumes, milk and diary, and HSFAS products that did not differ between regions, and HSFAS products that did not differ by indigenous ethnicity. Moreover, the diets of individuals of medium- and high-SES had a higher EC from fruits and vegetables, relative to individuals from low-SES. The percentage of EC from SSBs was higher in the North region compared to the Central and South regions; and lower among individuals of indigenous ethnicity compared to their counterparts.
Specific food groups in 2016
Among the cereals, whole grains had the highest EC, with 21.5% of total daily energy intake. In the meat and animal products group, red meat had the highest EC (6.4%), and fish and seafood, the lowest (0.7%). Within the SSBs group, manufactured SSBs contributed 6.0% to the total daily energy intake, followed by homemade SSBs, with 3.9%. Pastries and ready-to-eat cereals with added sugar had the highest EC within the HSFAS products group, with 9.4% of the total daily energy intake (table III).
Table III Percent energy contribution to total daily energy intake and grams consumed from specific food groups in 2016. Mexico, Ensanut-MC 2016*
|
Energy contribution (%) |
Grams |
||
|
Mean (95%CI) |
Mean (95%CI) |
||
|
Cereals and tubers |
Whole grains |
21.5 (20.4, 22.7) |
179 (167, 191) |
|
Refined grains |
7.6 (7.0, 8.2) |
43 (39, 47) |
|
|
Tubers |
1.0 (0.8, 1.2) |
22 (17, 27) |
|
|
Legumes and nuts |
Legumes |
3.6 (3.2, 4.0) |
21 (18, 24) |
|
Nuts |
0.2 (0, 0.4) |
1 (0, 1) |
|
|
Milk and dairy |
Low-fat dairy |
0.4 (0.3, 0.6) |
12 (8, 16) |
|
High-fat dairy |
6.8 (6.2, 7.4) |
135 (121, 150) |
|
|
Dairy with added sugar |
0.9 (0.7, 1.0) |
19 (15, 23) |
|
|
Meat and animal products |
Eggs |
2.8 (2.4, 3.1) |
33 (29, 37) |
|
Red meat |
6.4 (5.3, 7.4) |
52 (43, 61) |
|
|
Poultry |
4.0 (3.5, 4.6) |
46 (38, 53) |
|
|
Fish and seafood |
0.7 (0.5, 0.9) |
11 (7, 15) |
|
|
Processed meat |
2.0 (1.7, 2.3) |
16 (13, 19) |
|
|
Fruits and vegetables |
Fruits |
3.7 (3.2, 4.2) |
105 (92, 118) |
|
Vegetables |
2.4 (2.2, 2.6) |
127 (118, 137) |
|
|
100% Juices |
0.3 (0.1, 0.4) |
15 (4, 25) |
|
|
Fats and oils |
Fats and oils |
8.7 (7.6, 9.8) |
30 (25, 35) |
|
SSBs |
Manufactured SSBs |
6.0 (5.3, 6.6) |
271 (237, 306) |
|
Homemade SSBs |
3.9 (3.3, 4.4) |
269 (229, 309) |
|
|
Alcoholic beverages |
0.6 (0.4, 0.9) |
74 (53, 95) |
|
|
HSFAS products |
Pastries and ready-to-eat cereals with added sugars |
9.4 (8.6, 10.2) |
47 (42, 51) |
|
Sweets and sweeteners |
2.1 (1.6, 2.6) |
12 (8, 15) |
|
|
Desserts |
1.7 (1.3, 2.0) |
17 (12, 22) |
|
|
Salty snacks |
2.4 (1.9, 2.9) |
13 (9, 16) |
SSBs: sugar-sweetened beverages; HSFAS: high in saturated fat and/or added sugar
* Values are unadjusted weighted means (95%CIs). Data are from the Encuesta Nacional de Salud y Nutrición de Medio Camino 2016 (Ensanut-MC 2016); n=3 661
Differences in EC between population subgroups were also observed for the specific food groups selected. Among age groups, the diets of adolescents and adults had a higher EC from whole grains and manufactured SSBs, and a lower EC from refined grains, compared to school-aged children (table IV). Individuals living in rural areas, in the Central and South regions of the country, from low-SES, of indigenous ethnicity, and who did not complete elementary school had a higher EC from whole grains compared to their respective counterparts. Red meat and processed meat had a higher EC among individuals from urban areas, of high-SES and of non-indigenous ethnicity, compared to their respective counterparts. EC from fruits differed by SES, with lower intake among low-SES individuals, whereas EC from vegetables differed between regions, with the North region having the lowest. Manufactured SSBs had a higher EC among men, individuals from urban areas, living in the North region, of high-SES, of non-indigenous ethnicity, or who completed elementary and middle school, relative to their respective counterparts; whereas homemade SSBs had a higher EC among individuals living in rural areas, in the South region, and from low-SES individuals, compared to their counterparts.
Table IV Percent energy contribution from specific food groups to total daily energy intake in 2016 by population subgroups. Mexico, Ensanut-MC 2016*
|
Whole grains |
Refined grains |
Red meat |
Processed meat |
Fruits |
Vegetables |
Manufactured SSBs |
Homemade SSBs |
||||||||||
|
Mean (95%CI) |
p-value‡ |
Mean (95%CI) |
p-value |
Mean (95%CI) |
p-value |
Mean (95%CI) |
p-value |
Mean (95%CI) |
p-value |
Mean (95%CI) |
p-value |
Mean (95%CI) |
p-value |
Mean (95%CI) |
p-value |
||
|
Overall |
21.5 (20.4, 22.7) |
7.6 (7.0, 8.2) |
6.4 (5.3, 7.4) |
2 (1.7, 2.3) |
3.7 (3.2, 4.2) |
2.4 (2.2, 2.6) |
6 (5.3, 6.6) |
3.9 (3.3, 4.4) |
|||||||||
|
Age group |
|||||||||||||||||
|
School-aged children |
17.0 (15.4, 18.7) |
ref |
9.1 (7.8, 10.5) |
ref |
4.5 (3.6, 5.5) |
ref |
2.7 (2.0, 3.3) |
ref |
3.9 (3.3, 4.4) |
ref |
2.1 (1.8, 2.4) |
ref |
4.7 (4.0, 5.4) |
ref |
3.1 (2.5, 3.6) |
ref |
|
|
Adolescents |
21.0 (19.4, 22.6) |
0.001 |
7.3 (6.4, 8.3) |
0.04 |
6.0 (4.2, 7.8) |
0.198 |
2.6 (1.9, 3.3) |
0.95 |
2.9 (2.0, 3.9) |
0.07 |
2.1 (1.9, 2.4) |
0.8 |
6.8 (5.8, 7.8) |
0.001 |
3.2 (2.4, 3.9) |
0.8 |
|
|
Adults |
22.7 (21.2, 24.3) |
<0.001 |
7.3 (6.5, 8.1) |
0.01 |
6.9 (5.5, 8.3) |
0.009 |
1.7 (1.2, 2.1) |
0.01 |
3.9 (3.3, 4.6) |
0.9 |
2.6 (2.3, 2.8) |
0.012 |
6.1 (5.2, 6.9) |
0.02 |
4.2 (3.6, 4.9) |
0.005 |
|
|
Sex |
|||||||||||||||||
|
Men |
22.0 (20.2, 23.7) |
ref |
7.5 (6.5, 8.5) |
ref |
6.4 (5.1, 7.7) |
ref |
2.1 (1.6, 2.7) |
ref |
3.5 (2.8, 4.3) |
ref |
2.3 (2.1, 2.6) |
ref |
6.6 (5.7, 7.5) |
ref |
3.9 (3.2, 4.6) |
ref |
|
|
Women |
21.1 (19.7, 22.5) |
0.4 |
7.7 (6.9, 8.5) |
0.8 |
6.4 (4.9, 7.8) |
0.98 |
1.9 (1.5, 2.2) |
0.4 |
3.9 (3.4, 4.5) |
0.4 |
2.5 (2.3, 2.7) |
0.4 |
5.4 (4.6, 6.1) |
0.03 |
3.8 (3.1, 4.5) |
0.8 |
|
|
Residence area |
|||||||||||||||||
|
Urban |
19.1 (17.8, 20.4) |
ref |
7.9 (7.1, 8.7) |
ref |
7.0 (5.7, 8.4) |
ref |
2.2 (1.8, 2.6) |
ref |
3.9 (3.3, 4.5) |
ref |
2.4 (2.2, 2.7) |
ref |
6.4 (5.6, 7.2) |
ref |
3.5 (2.9, 4.2) |
ref |
|
|
Rural |
28.8 (27.0, 30.7) |
<0.001 |
6.6 (5.8, 7.4) |
0.02 |
4.3 (3.7, 4.9) |
<0.001 |
1.5 (1.1, 2.0) |
0.033 |
3.2 (2.7, 3.8) |
0.1 |
2.4 (2.2, 2.6) |
0.9 |
4.8 (4.0, 5.5) |
0.006 |
4.9 (4.1, 5.7) |
0.006 |
|
|
Geographical region |
|||||||||||||||||
|
North |
16.0 (13.5, 18.5) |
ref |
5.8 (4.9, 6.7) |
ref |
6.8 (4.3, 9.2) |
ref |
2.8 (1.9, 3.7) |
ref |
3.0 (2.1, 4.0) |
ref |
2.0 (1.7, 2.3) |
ref |
8.5 (6.8, 10.2) |
ref |
3.2 (1.9, 4.5) |
ref |
|
|
Central |
21.1 (19.6, 22.6) |
0.001 |
7.5 (6.6, 8.3) |
0.007 |
7.3 (5.7, 9.0) |
0.7 |
2.0 (1.5, 2.4) |
0.1 |
4.1 (3.2, 4.9) |
0.1 |
2.6 (2.3, 2.9) |
0.008 |
6.1 (5.2, 7.1) |
0.02 |
3.1 (2.5, 3.7) |
0.9 |
|
|
South |
25.7 (23.4, 28.1) |
<0.001 |
8.9 (7.7, 10.2) |
<0.001 |
4.5 (3.8, 5.3) |
0.1 |
1.5 (1.0, 2.1) |
0.02 |
3.6 (3.1, 4.2) |
0.3 |
2.4 (2.1, 2.7) |
0.046 |
4.1 (3.4, 4.8) |
<0.001 |
5.4 (4.4, 6.5) |
0.009 |
|
|
Socioeconomic level |
|||||||||||||||||
|
Low |
32.0 (29.7, 34.3) |
ref |
6.8 (5.9, 7.7) |
ref |
4.5 (3.7, 5.3) |
ref |
1.4 (0.9, 1.9) |
ref |
2.6 (2.0, 3.1) |
ref |
2.3 (2.0, 2.5) |
ref |
4.9 (4.2, 5.7) |
ref |
5.2 (4.3, 6.2) |
ref |
|
|
Medium |
22.5 (20.9, 24.1) |
<0.001 |
7.8 (6.7, 8.8) |
0.2 |
5.4 (4.5, 6.4) |
0.1 |
1.8 (1.4, 2.1) |
0.2 |
3.9 (2.9, 4.8) |
0.02 |
2.5 (2.2, 2.8) |
0.2 |
5.8 (4.9, 6.7) |
0.1 |
3.9 (3.2, 4.6) |
0.02 |
|
|
High |
16.5 (15.1, 17.9) |
<0.001 |
7.8 (6.7, 9.0) |
0.2 |
7.7 (5.8, 9.6) |
0.002 |
2.4 (1.8, 2.9) |
0.01 |
4.1 (3.4, 4.9) |
0.001 |
2.4 (2.1, 2.8) |
0.4 |
6.5 (5.4, 7.6) |
0.02 |
3.2 (2.4, 4.0) |
0.003 |
|
|
Indigenous ethnicity |
|||||||||||||||||
|
Yes |
33.2 (28.5, 37.8) |
ref |
7.3 (5.8, 8.8) |
ref |
2.8 (2.0, 3.6) |
ref |
1.0 (0.2, 1.8) |
ref |
4.3 (3.2, 5.4) |
ref |
2.5 (2.1, 2.8) |
ref |
3.2 (2.1, 4.3) |
ref |
4.8 (3.7, 5.9) |
ref |
|
|
No |
20.5 (19.3, 21.6) |
<0.001 |
7.6 (7.0, 8.3) |
0.7 |
6.7 (5.6, 7.8) |
<0.001 |
2.1 (1.7, 2.4) |
0.02 |
3.7 (3.2, 4.2) |
0.3 |
2.4 (2.2, 2.6) |
0.9 |
6.2 (5.5, 6.9) |
<0.001 |
3.8 (3.2, 4.3) |
0.09 |
|
|
Education level§ |
|||||||||||||||||
|
Lower than elementary school |
30.7 (27.4, 34) |
ref |
8.4 (6.4, 10.5) |
ref |
3.8 (2.8, 4.8) |
ref |
1.0 (0.5, 1.5) |
ref |
4.7 (2.8, 6.6) |
ref |
3.2 (2.7, 3.8) |
ref |
4.3 (3.1, 5.4) |
ref |
4.6 (3.4, 5.9) |
ref |
|
|
Finished elementary school |
25.9 (22.4, 29.5) |
0.06 |
7.1 (5.6, 8.6) |
0.3 |
5.3 (3.7, 6.9) |
0.1 |
2.1 (0.9, 3.2) |
0.08 |
2.7 (1.8, 3.6) |
0.1 |
2.7 (2.2, 3.2) |
0.2 |
6.7 (5.2, 8.2) |
0.01 |
4.2 (2.4, 6.0) |
0.6 |
|
|
Finished middle school |
19.6 (17, 22.1) |
<0.001 |
7.1 (5.9, 8.4) |
0.3 |
7.8 (4.8, 10.8) |
0.01 |
1.9 (1.1, 2.8) |
0.06 |
4.2 (3.2, 5.2) |
0.7 |
2.5 (2.1, 2.9) |
0.04 |
7.7 (6.0, 9.4) |
0.001 |
4.2 (3.2, 5.1) |
0.5 |
|
|
Finished high school or higher |
18.1 (15.7, 20.4) |
<0.001 |
6.8 (5.3, 8.4) |
0.2 |
9.3 (6.0, 12.6) |
0.002 |
1.6 (0.9, 2.3) |
0.2 |
4.0 (2.9, 5.0) |
0.5 |
2.2 (1.7, 2.6) |
0.005 |
5.4 (3.7, 7.1) |
0.3 |
4.1 (2.7, 5.4) |
0.6 |
|
SSBs: sugar-sweetened beverages
* Values are unadjusted weighted means (95%CIs). Data are from the Encuesta Nacional de Salud y Nutrición de Medio Camino 2016 (Ensanut-MC 2016); n=3 661
‡p-values compare unadjusted weighted mean vs. category of reference (school-aged children, men, urban, north region, low SES, indigenous ethnicity, and lower than elementary school)
§Educational level is only from adults (>20 y)
Changes from 2012 to 2016
The changes in EC from 2012 to 2016 were small, with average intakes of food group remaining similar in the four-year span. EC from cereals, and milk and dairy had statistically significant decreases, while EC from meat and animal products had a statistically significant increase (figure 1).
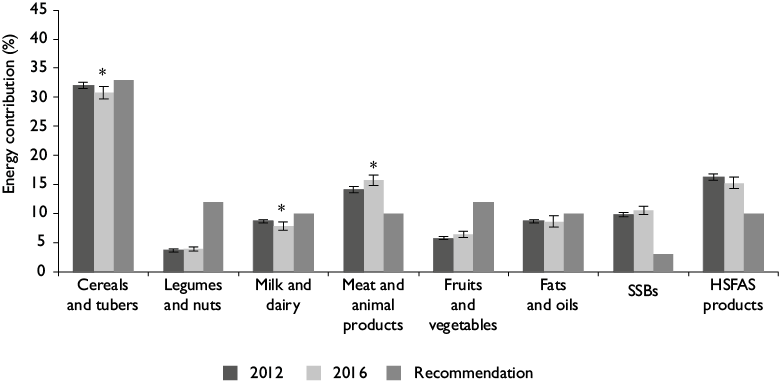
Data are from the Encuesta Nacional de Salud y Nutrición de Medio Camino 2016 (Ensanut-MC 2016), and the Ensanut 2012; n=11 640
Values are predicted means ± 95%Cis obtained with - margins - command from Stata from models adjusted by age group, sex, residence area, geographical region, socioeconomic level, indigenous ethnicity and weekend days
* p-values <0.05 comparing food group percent energy contribution of 2012 vs. 2016
SSBs: sugar-sweetened beverages; HSFAS: high in saturated fat and/or added sugar
Figure 1 Percent energy contribution from major food groups to total daily energy intake by survey year. Mexico, Ensanut 2012 and Ensanut-MC 2016
Discussion
The present analysis of nationally representative dietary intake data collected in the Mexican Halfway Health and Nutrition Survey from 2016 showed, similarly to the findings of 2012, that the food group intake diverged meaningfully from the MDPAG recommendations. The food groups that deviated the most from the recommendations were SSBs, meat and animal products, and HSFAS products, with a mean EC 7.5, 5.9, and 5.5 pp above the recommended intake, respectively; whereas legumes and fruits and vegetables had an EC 8.2 and 5.6 pp below the recommendation. In terms of percentages, SSBs, meat and animal products, and HSFAS products were 250, 59 and 55% above the recommended intake, respectively; while legumes, and fruits and vegetables were 68 and 47% below the recommended intake. Intake of discretionary foods provided more than a quarter of the total daily energy (26% of EC), doubling the suggested EC threshold of 13%. Cereals provided the highest EC contribution to the total daily energy intake, followed by meat and animal products, HSFAS products, and SSBs, while fruits and vegetables, and legumes contributed the lowest EC.
Analysis by population subgroups confirmed that food group consumption differed substantially between subgroups. The diets of rural, low-SES, indigenous and low education level subgroups had higher EC from cereals (particularly whole grain cereals) and legumes, and lower EC from milk and dairy, meat and animal products, compared to urban, medium- and high-SES, non-indigenous subgroups, and subgroups with a high educational level, respectively. Thus, some segments of the Mexican population still consumed a significant proportion of their total daily energy intake from whole grain cereals ―mainly corn tortilla―, and legumes. These food groups are considered part of the traditional Mexican diet. Corn domestication was essential for the development of Mesoamerican cultures, being part of the cultural heritage and identity of Mexicans, and it continues to be one of the most important staple foods in the current Mexican diet, particularly for certain subgroups.20 Individuals of indigenous ethnicity consumed close to 48% of their total daily energy intake from cereals and legumes, with corn tortilla contributing 32% to total daily energy intake (the EC of corn tortilla for the overall population was 19.9%, data not shown). However, it is noteworthy that the EC of non-basic discretionary foods was still high among all subgroups, with ECs ranging from 19.1 to 29.5%.
The diet of the indigenous population was based on whole grain cereals and legumes, and lower in meat and animal products (including red and processed meats), fats and oils, and manufactured SSBs, relative to the diets of non-indigenous individuals. Although not ideal when compared to the recommendations (higher EC from SSBs, and HSFAS products, and lower EC from legumes, and fruits and vegetables than the recommendations), the average diet from indigenous populations seems to have higher compliance with the MDPAG. Thus, this suggests that the indigenous population still maintains a traditional diet, which might be related to lower intakes of fat, sugar and sodium. We acknowledge that this analysis of the dietary intake is not comprehensive, since we are only assessing compliance with the guidelines that emphasize the prevention of obesity and chronic diseases, and not of undernutrition, recognizing that Mexico still faces the double burden of malnutrition with very high levels of obesity, but still some presence of stunting in young children and iron deficiency anemia in children and women.21,22,23 We did not assess intake of micronutrients and it is possible that the Mexican population of indigenous ethnicity is not meeting their requirements for certain vitamins and minerals, considering the health and nutrition inequities that have been historically present in these communities.24,25,26 We thus consider that further analyses are needed to study micronutrient adequacy and other nutritional outcomes in the indigenous population and to look at trends over time, whereby we would obtain information on how the diet of this subgroup has been affected by changes in the food systems.
This study finds that the high intake of SSBs is still an important public health problem in Mexico. In 2016, the mean EC from SSBs was 10.5% for the overall population and was the food group with the highest intake above the recommendation, with 7.5 pp above the recommended intake. That is, the Mexican population consumed 250% more of the EC from SSBs than the recommended threshold. While all population subgroups had excessive consumption of SSBs, their EC differed between subgroups, with higher EC among adults (11.2%), men (11.7%) and individuals from the Northern region (13.3%). However, EC from SSBs did not differ between urban and rural areas or by SES. This is opposite to what is seen in the US, where low- and middle-income subgroups have a higher intake of SSBs.27 Still, we observed differences by type of SSBs, with urban and high-SES subgroups having a higher EC from manufactured SSBs and a lower EC from homemade SSBs than their rural and low-SES counterparts. Because SSBs are a major driver of long-term weight gain, increased risk of type 2 diabetes, and increased cardiometabolic risk factors,28,29 and given the high prevalence of these conditions among the Mexican population,30 reducing SSBs intake has been the target of several policy measures. These include the development of recommendations on beverage intake, banning sodas and other packaged SSBs from elementary schools, the implementation in 2014 of an excise tax of 1 peso per liter (10% price increase approximately) on manufactured non-dairy and non-alcoholic beverages with added sugar, and the recent implementation of front-of-pack warning labels on packaged products with added sugar, fat or sodium in 2020.31,32,33,34 Analysis of the SSB tax showed decreases of around 7.6% in purchases of taxed SSBs, with higher impact among low-income households.33 As mentioned previously, the 2012 and 2016 Ensanut surveys were collected in different seasons, affecting the comparability of intake data due to seasonal variations.11 Analysis using data from Nielsen Mexico’s Consumer Panel Services -a dataset from Mexican households that collects bimonthly purchased data and allows seasonal trends estimation- showed that per capita SSBs purchases during warmer months (April to August) were 7% higher than during colder months (October to March).35 This could explain why we did not find a statistically significant difference in SSBs EC between 2012 and 2016. Yet, based on the previously described documented tax effects on purchases, a decrease of SSB intake would have been expected if the surveys were collected during the same season.
The evidence linking legumes, and fruits and vegetable intake to prevention of chronic disease outcomes is robust.36,37,38,39 Still, the EC from these food groups was considerably lower relative to the recommendations. Similarly to what is observed in high-income countries, the average EC from fruits and vegetables was associated with SES.40,41,42 By looking at the EC from the specific food groups, we observed that this association was given by differences in the EC from fruits, whereas the EC from vegetables did not differ between SES subgroups. Thus, it is possible that prices in Mexico are more accessible for vegetables than for fruits. The intake of fruits and vegetables was far from meeting the MDPAG recommendations, and it did not differ by age group, sex, urban/rural areas, regions, or indigenous ethnicity. Therefore, policies and programs to promote and increase fruit and vegetable intake are necessary for all population subgroups.
The EC from meat and animal products was considerably higher relative to the recommendation, with red meat contributing the most to this food group. Moreover, this food group had the biggest increase from 2012 to 2016. There is strong evidence linking red and processed meat intake with increased risk of diabetes, cardiovascular disease, cancer mortality, and total mortality.43,44 Furthermore, it is well known that food production places an enormous demand on natural resources and is a major source of greenhouse gas emissions, with meat and dairy accounting for almost half of all food-related emissions.45,46 Thus, considering the emphasis placed by MDPAG in a healthy eating pattern that supports environmentally sustainable food systems, reducing red meat consumption is advisable, particularly for adults. Still, red meat recommendations for children under 5 y where micronutrient deficiencies are prevalent should be carefully considered, given that red meat is a good source of nutrients like iron and zinc.
There are several limitations in this study. As with any data that relies on self-report, estimates may be affected by measurement errors. Misreporting between population subgroups could be differential if the healthfulness perception regarding specific foods differed between subgroups, since foods perceived as unhealthy tend to be underreported.47 Also, different stratifications probably reflect similar sociodemographic populations. That is, there is a higher concentration of indigenous population in rural areas and in the South region of the country, and these populations also tend to have a lower SES. Similarly, education and SES are also highly correlated. Yet, the aim of this analysis is to describe the intake in order to guide interventions and not to imply any type of causality. We did not account for the intra-individual variability based on the second 24-hour recall of the subsamples since we focused the analysis on the mean intake.
We consider as one of the main strengths of this study the survey’s representativeness of subpopulations, which enabled comparisons between population subgroups. Likewise, the categorization of foods that accounted for 99% of the total daily energy intake allowed us to compare food group intake with the MDPAG, highlighting the high EC of discretionary foods. Given the similitudes between the findings obtained from both analyses using independent samples, it is evident that the 24-hour recall method used in the last two the Mexican Health and Nutrition surveys is a robust method to estimate the dietary intake of the population.
Conclusion
In summary, the present analysis confirms the main conclusions from Ensanut of 2012, which draw attention to important deviations from the recommendations in regard to food group intake by the general Mexican population. Although subgroup analyses revealed among certain populations dietary patterns that are still heavily influenced by the traditional Mexican culture, all subgroups were adversely affected by a high intake of discretionary foods. And even though there are several policies in place aiming to improve the dietary quality among the population, there is still substantial room for improvement.

