


 text new page (beta)
 English (pdf)
 Article in xml format
 Article references
 Send this article by e-mail
 Cited by SciELO
  Similars in
SciELO
Similars in
SciELO 
 Permalink
Introduction
Primary liver cancer, the majority of which are hepatocellular carcinomas (HCC),1 is the sixth mostly occurring common cancer and the third leading cause of cancer mortality worldwide.2 The International Agency for Research on Cancer (IARC) estimates there were over 900 000 new cases and more than 800 000 liver cancer deaths globally in 2020.2 Most of the liver cancer burden falls on countries in Africa and Eastern Asia with China alone bearing over 45% of the total burden.2 Recent reports have noted that liver cancer rates are declining in Eastern Asia, but increasing in other parts of the world including North America.3,4
It has been suggested that the changing trends in liver cancer rates reflects the epidemiological transition of this disease.5 Major risk factors for liver cancer include hepatitis B virus (HBV), hepatitis C virus (HCV), excessive alcohol consumption, and aflatoxin B1 (AFB1) exposure.6 In addition, the metabolic cascade of metabolic syndrome, obesity, diabetes, and non-alcoholic fatty liver diseases (NAFLD) are now recognized as important risk factors for HCC in both high- and low-rate areas.1
Mexico is a country with heterogeneous urban-rural economic development, where geographic differences in liver cancer risk factors have been observed. While the overall prevalence of HBV and HCV infection is reported to be low in the country (<1.5%),7,8 aflatoxin exposure appears to be prevalent, particularly in rural regions. For example, our previous work found detectable levels of AFB1 in ~85% (n=100) of individuals aged 40-59 years old from Chiapas in southern Mexico, recruited from the National Health and Nutritional Survey 2018-19 (Encuesta Nacional de Salud y Nutrición, Ensanut).* In addition, obesity and related metabolic conditions have increased dramatically in Mexico.9 Moreover, the leading causes of deaths in the country are associated with obesity, including cardiovascular disease, cancer, diabetes, and chronic liver diseases.10
Previous reports have found that liver-related mortality increased in Mexico in the 2000s.11,12 In particular, a study that examined liver cancer mortality rates in the early 2000s reported that deaths increased from 2000 to 2006, with regional differences.13 To our knowledge, a new assessment of liver cancer mortality has not been conducted. Therefore, the purpose of the current study was to examine overall, as well as sex- and state-specific, liver cancer mortality trends in Mexico.
Materials and methods
Data sources
Numbers of liver cancer deaths (1998-2018) by age, gender, state of residence, and year of death were retrieved from the mortality databases of the Instituto Nacional de Estadística y Geografía (Inegi). Topography codes C22.0-C22.9 of the International Classification of Disease, tenth revision (ICD-10) were used to identify all liver cancer deaths. Population denominators were obtained from the respective census reported by the Inegi. For the remaining years, estimations were obtained from Consejo Nacional de Población (Conapo) census and estimates.14
Statistical analysis
Liver cancer age-specific mortality rates (ASMR), adjusted to the World standard Segi population,15 were estimated for 21 calendar years between 1998-2018 (1-year intervals) and 19 different age groups (e.g. 0, 1-4, 5-9, 10-14,…,85+). In addition to overall rates, mortality was examined by sex and states of Mexico (31 states and Mexico City). Furthermore, the male:female (M:F) ratio of rates was calculated by state.
Trend analysis: Joinpoint
Overall and sex-specific trends in liver cancer by states of Mexico were plotted for the entire period (1998-2018). Joinpoint regression analysis was used to obtain the estimated annual percent change (EAPC), the average annual percent change (AAPC), and 95% confidence intervals (95%CI) using the National Cancer Institute’s Joinpoint Regression Program (version 4.8.0.1; Information Management Services; Silver Spring, Maryland). Joinpoint regression identifies statistically significant trend change points (joinpoints) and the rate of change in each trend segment using a Monte Carlo permutation method.16 A maximum number of three joinpoints was allowed. A segment was considered significant if the slope of the regression line was statistically different from zero (p<0.05).
Age-Period-Cohort analysis
Age-period-cohort (APC) models were used to evaluate the effects of age, period (calendar year), and birth cohort. The APC method fits a log-linear model with a Poisson distribution to the observed data to estimate age, period, and cohort effects in a multiplicative APC model.17 This method is known as the “classical” approach and it is represented by the formula below:
This formula assumes that the expected log-mortality rates λa,p is equal to a linear combination of time-related variables or effects that adjust for age (a), calendar year (p) and birth cohort (c), where c=p-a.17 In order to address non-identifiability due to the linear dependency of each time-related variable of the two, two-effect models age-period (AP-C), and age-cohort (AC-P) were first selected and the remaining effect (cohort or period) was then fit to the respective model’s residual using natural splines to reduce random variation.17 Three degrees of freedom/knots for age, six for cohort, and two for period were used for the models. The best-fitted models were determined on the basis of the Akaike information criterion (AIC). The analysis of APC was performed using the Epi package in the R statistical software version 4.0.3.
Results
Over 100 000 liver cancer deaths were registered between 1998-2018, and nearly 32 000 deaths occurred in the last 5-year period. Figure 1 shows state-specific liver cancer mortality rates for the most recent time period 2014-2018. The ASMR ranged from 3.34 (in Aguascalientes) to 7.96 per 100 000 person-years (py) (in Chiapas). The highest rates were seen in the south eastern states and the Yucatan peninsula, including Chiapas (7.96 per 100 000 py), Veracruz (7.94 per 100 000 py), Yucatan (7.24 per 100 000 py), and Tabasco (7.05 per 100 000 py). In contrast, the rates in northern and several central states were lower than five per 100 000 py.

Figure 1 Age-adjusted liver cancer mortality rates per 100 000 by state in Mexico, all ages, 2014-2018
Figure 2 presents the age-adjusted male and female mortality rates by state during the most recent time period 2014-2018. Overall, sex-specific rates were nearly equal. The nationwide mortality rates were 5.39 per 100 000 py among men and 4.75 per 100 000 py among women (male:female [M:F] ratio=1.1). The highest M:F ratios were seen in northern states (e.g. Baja California Sur [M:F ratio=2.0], Nuevo Leon [M:F ratio=1.6], Sonora and Tamaulipas [M:F ratio=1.5]).
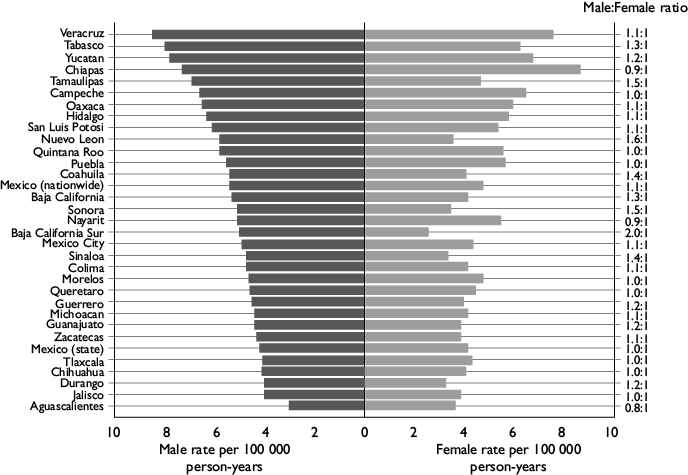
Figure 2 Age-adjusted male and female liver cancer mortality rates by state in Mexico, all ages, 2014-2018
Over the entire 21-year period, liver cancer mortality rates statistically significantly decreased at an EAPC of -0.8% (95%CI: -1.0, -0.6; p<0.05) (table I). The ASMR decreased from 5.77 per 100 000 py in 1998 to 4.76 per 100 000 py in 2018. The decline occurred in both sexes but was statistically significant only among women (AAPC -1.2, 95%CI: -1.5, -1.0; p<0.05) (table I and figure 3). State-specific trends varied across the country. A decline in liver cancer deaths was statistically significant in several states, including Sinaloa (-2.3%, 95%CI: -2.9, -1.6; p<0.05), Baja California Sur (-2.2%, 95%CI: -4.2, -0.1; p<0.05), and Aguascalientes (-2.1%, 95%CI: -3.4, -0.9, p<0.05) (table I and figure 3). In contrast, there were statistically significant increases in mortality rates in Oaxaca but only among men (AAPC: 1.4%, 95%CI: 0.7, 2.1; p<0.05), where the ASMR increased from 5.22 per 100 000 py in 1998 to 6.14 per 100 000 py in 2018. In other states, mortality rates remained stable for the entire period.
Table I Age-standardized mortality rates (ASMR), estimated annual and average annual percent changes in liver cancer rates by sex and state in Mexico, all ages, 1998-2018
|
Population |
Segment 1 |
Segment 2 |
Segment 3 |
Segment 4 |
AAPC, 1998-2018 |
ASMR |
ASMR |
|||||||||
|
Years |
EAPC, % |
95%CI |
Years |
EAPC, % |
95%CI |
Years |
EAPC, % |
95%CI |
Years |
EAPC, % |
95%CI |
% |
95%CI |
1998 |
2018 |
|
|
Mexico (nationwide) |
||||||||||||||||
|
All |
1998-2018 |
-0.8 |
(-1.0, -0.6) |
-0.8 |
(-1.0, -0.6) |
5.77 |
4.76 |
|||||||||
|
Men |
1998-2004 |
0.5 |
(-0.9, 1.9) |
2004-2008 |
-2.5 |
(-6.3, 1.4) |
2008-2016 |
0.7 |
(-0.3, 1.6) |
2016-2018 |
-3.6 |
(-9.8, 3.2) |
-0.5 |
(-1.5, 0.6) |
5.84 |
5.14 |
|
Women |
1998-2018 |
-1.2 |
(-1.5, -1.0) |
-1.2 |
(-1.5, -1.0) |
5.74 |
4.43 |
|||||||||
|
Aguascalientes |
||||||||||||||||
|
All |
1998-2018 |
-2.1 |
(-3.4, -0.9) |
-2.1 |
(-3.4, -0.9) |
4.00 |
2.40 |
|||||||||
|
Men |
1998-2018 |
-2.0 |
(-3.2, -0.8) |
-2.0 |
(-3.2, -0.8) |
5.08 |
2.56 |
|||||||||
|
Women |
1998-2018 |
-2.4 |
(-4.3, -0.4) |
-2.4 |
(-4.3, -0.4) |
3.18 |
2.27 |
|||||||||
|
Baja California |
||||||||||||||||
|
All |
1998-2018 |
-0.1 |
(-1.1, 0.9) |
-0.1 |
(-1.1, 0.9) |
3.65 |
4.58 |
|||||||||
|
Men |
1998-2018 |
0.4 |
(-0.9, 1.7) |
0.4 |
(-0.9, 1.7) |
4.18 |
5.74 |
|||||||||
|
Women |
1998-2018 |
-0.6 |
(-1.9, 0.8) |
-0.6 |
(-1.9, 0.8) |
3.20 |
3.56 |
|||||||||
|
Baja California Sur |
||||||||||||||||
|
All |
1998-2018 |
-2.2 |
(-4.2, -0.1) |
-2.2 |
(-4.2, -0.1) |
5.04 |
3.31 |
|||||||||
|
Men |
1998-2018 |
-0.6 |
(-2.4, 1.3) |
-0.6 |
(-2.4, 1.3) |
10.72 |
8.52 |
|||||||||
|
Women |
1998-2018 |
-3.7 |
(-6.5, -0.8) |
-3.7 |
(-6.5, -0.8) |
4.35 |
2.68 |
|||||||||
|
Campeche |
||||||||||||||||
|
All |
1998-2018 |
0.0 |
(-1.6, 1.6) |
0.0 |
(-1.6, 1.6) |
8.87 |
7.34 |
|||||||||
|
Men |
1998-2018 |
-0.6 |
(-2.4, 1.3) |
-0.6 |
(-2.4, 1.3) |
10.72 |
8.52 |
|||||||||
|
Women |
1998-2018 |
0.6 |
(-1.4, 2.5) |
0.6 |
(-1.4, 2.5) |
6.96 |
6.22 |
|||||||||
|
Colima |
||||||||||||||||
|
All |
1998-2018 |
-0.5 |
(-1.9, 0.9) |
-0.5 |
(-1.9, 0.9) |
4.41 |
4.87 |
|||||||||
|
Men |
1998-2018 |
-0.6 |
(-2.1, 1.0) |
-0.6 |
(-2.1, 1.0) |
5.71 |
5.67 |
|||||||||
|
Women |
1998-2018 |
-0.5 |
(-2.3, 1.4) |
-0.5 |
(-2.3, 1.4) |
3.26 |
4.24 |
|||||||||
|
Chiapas |
||||||||||||||||
|
All |
1998-2014 |
0.4 |
(-0.5, 1.2) |
2014-2018 |
-3.9 |
(-9.5, 1.9) |
-0.5 |
(-1.8, 0.8) |
9.32 |
7.30 |
||||||
|
Men |
1998-2018 |
0.1 |
(-0.7, 1.0) |
0.1 |
(-0.7, 1.0) |
8.32 |
7.13 |
|||||||||
|
Women |
1998-2018 |
-0.5 |
(-1.2, 0.2) |
-0.5 |
(-1.2, 0.2) |
10.34 |
7.47 |
|||||||||
|
Chihuahua |
||||||||||||||||
|
All |
1998-2011 |
-3.4 |
(-4.9, -1.8) |
2011-2018 |
3.0 |
(-0.6, 6.7) |
-1.2 |
(-2.6, 0.3) |
5.07 |
3.98 |
||||||
|
Men |
1998-2018 |
-1.3 |
(-2.4, -0.2) |
-1.3 |
(-2.4, -0.2) |
4.69 |
3.96 |
|||||||||
|
Women |
1998-2018 |
-1.7 |
(-2.9, -0.4) |
-1.7 |
(-2.9, -0.4) |
5.41 |
4.01 |
|||||||||
|
Durango |
||||||||||||||||
|
All |
1998-2018 |
-1.8 |
(-2.6, -1.0) |
-1.8 |
(-2.6, -1.0) |
4.25 |
3.32 |
|||||||||
|
Men |
1998-2018 |
-0.9 |
(-1.9, 0.1) |
-0.9 |
(-1.9, 0.1) |
4.72 |
3.52 |
|||||||||
|
Women |
1998-2018 |
-2.7 |
(-3.9, -1.4) |
-2.7 |
(-3.9, -1.4) |
3.85 |
3.14 |
|||||||||
|
Guanajuato |
||||||||||||||||
|
All |
1998-2018 |
-0.7 |
(-1.4, -0.0) |
-0.7 |
(-1.4, -0.0) |
4.68 |
4.48 |
|||||||||
|
Men |
1998-2008 |
-3.7 |
(-6.2, -1.1) |
2008-2018 |
3.1 |
(0.8, 5.5) |
-0.3 |
(-1.9, 1.3) |
4.76 |
5.08 |
||||||
|
Women |
1998-2018 |
-1.2 |
(-2.1, -0.4) |
-1.2 |
(-2.1, -0.4) |
4.64 |
3.97 |
|||||||||
|
Guerrero |
||||||||||||||||
|
All |
1998-2018 |
-0.4 |
(-1.3, 0.6) |
-0.4 |
(-1.3, 0.6) |
4.03 |
3.82 |
|||||||||
|
Men |
1998-2018 |
0.1 |
(-1.0, 1.2) |
0.1 |
(-1.0, 1.2) |
3.91 |
4.53 |
|||||||||
|
Women |
1998-2018 |
-0.8 |
(-2.1, 0.6) |
-0.8 |
(-2.1, 0.6) |
4.12 |
3.2 |
|||||||||
|
Hidalgo |
||||||||||||||||
|
All |
1998-2018 |
0.0 |
(-0.8, 0.8) |
0.0 |
(-0.8, 0.8) |
5.81 |
5.86 |
|||||||||
|
Men |
1998-2018 |
0.7 |
(-0.4, 1.9) |
0.7 |
(-0.4, 1.9) |
5.76 |
5.49 |
|||||||||
|
Women |
1998-2018 |
-0.7 |
(-1.5, 0.2) |
-0.7 |
(-1.5, 0.2) |
5.90 |
6.21 |
|||||||||
|
Jalisco |
||||||||||||||||
|
All |
1998-2018 |
-1.6 |
(-2.1, -1.1) |
-1.6 |
(-2.1, -1.1) |
5.07 |
3.69 |
|||||||||
|
Men |
1998-2018 |
-1.3 |
(-2.0, -0.6) |
-1.3 |
(-2.0, -0.6) |
5.00 |
3.87 |
|||||||||
|
Women |
1998-2018 |
-1.8 |
(-2.3, -1.3) |
-1.8 |
(-2.3, -1.3) |
5.17 |
3.52 |
|||||||||
|
Mexico City |
||||||||||||||||
|
All |
1998-2018 |
-1.6 |
(-1.9, -1.2) |
-1.6 |
(-1.9, -1.2) |
5.95 |
4.42 |
|||||||||
|
Men |
1998-2018 |
-1.3 |
(-1.8, -0.8) |
-1.3 |
(-1.8, -0.8) |
6.19 |
4.90 |
|||||||||
|
Women |
1998-2018 |
-1.9 |
(-2.2, -1.5) |
-1.9 |
(-2.2, -1.5) |
5.91 |
4.04 |
|||||||||
|
Mexico (state) |
||||||||||||||||
|
All |
1998-2018 |
-1.1 |
(-1.4, -0.7) |
-1.1 |
(-1.4, -0.7) |
4.88 |
3.98 |
|||||||||
|
Men |
1998-2018 |
-0.3 |
(-0.7, 0.2) |
-0.3 |
(-0.7, 0.2) |
4.26 |
3.97 |
|||||||||
|
Women |
1998-2018 |
-1.7 |
(-2.2, -1.2) |
-1.7 |
(-2.2, -1.2) |
5.38 |
3.98 |
|||||||||
|
Michoacan |
||||||||||||||||
|
All |
1998-2012 |
-1.7 |
(-3.0, -0.5) |
2012-2015 |
5.6 |
(-17.2, 34.7) |
2015-2018 |
-11.4 |
(-21.9, 0.5) |
-2.2 |
(-5.9, 1.6) |
4.94 |
3.33 |
|||
|
Men |
1998-2012 |
-1.9 |
(-3.8, 0.1) |
2012-2015 |
11.4 |
(-23.2, 61.7) |
2015-2018 |
-17.1 |
(-32.0, 1.1) |
-2.5 |
(-8.1, 3.4) |
4.57 |
3.01 |
|||
|
Women |
1998-2018 |
-1.6 |
(-2.4, -0.9) |
-1.6 |
(-2.4, -0.9) |
5.27 |
3.61 |
|||||||||
|
Morelos |
||||||||||||||||
|
All |
1998-2018 |
-0.7 |
(-1.5, 0.1) |
-0.7 |
(-1.5, 0.1) |
5.91 |
3.93 |
|||||||||
|
Men |
1998-2018 |
-0.4 |
(-1.3, 0.6) |
-0.4 |
(-1.3, 0.6) |
5.76 |
3.90 |
|||||||||
|
Women |
1998-2018 |
(-2.0, -0.1) |
(-2.0, -0.1) |
6.01 |
3.90 |
|||||||||||
|
Nayarit |
||||||||||||||||
|
All |
1998-2018 |
-1.6 |
(-2.5, -0.6) |
-1.6 |
(-2.5, -0.6) |
6.67 |
4.58 |
|||||||||
|
Men |
1998-2018 |
-1.9 |
(-3.5, -0.2) |
-1.9 |
(-3.5, -0.2) |
5.54 |
3.21 |
|||||||||
|
Women |
1998-2018 |
-1.3 |
(-2.4, -0.2) |
-1.3 |
(-2.4, -0.2) |
7.76 |
5.91 |
|||||||||
|
Nuevo Leon |
||||||||||||||||
|
All |
1998-2018 |
(-1.7, -0.3) |
(-1.7, -0.3) |
6.22 |
3.96 |
|||||||||||
|
Men |
1998-2018 |
-0.5 |
(-1.2, 0.1) |
-0.5 |
(-1.2, 0.1) |
7.28 |
5.00 |
|||||||||
|
Women |
1998-2018 |
-1.7 |
(-2.6, -0.7) |
-1.7 |
(-2.6, -0.7) |
5.39 |
3.09 |
|||||||||
|
Oaxaca |
||||||||||||||||
|
All |
1998-2018 |
0.5 |
(0.0, 0.9) |
0.5 |
(0.0, 0.9) |
5.68 |
5.79 |
|||||||||
|
Men |
1998-2018 |
1.4 |
(0.7, 2.1) |
1.4 |
(0.7, 2.1) |
5.22 |
6.14 |
|||||||||
|
Women |
1998-2018 |
-0.4 |
(-1.2, 0.4) |
-0.4 |
(-1.2, 0.4) |
6.06 |
5.5 |
|||||||||
|
Puebla |
||||||||||||||||
|
All |
1998-2018 |
0.5 |
(-0.1, 1.1) |
0.5 |
(-0.1, 1.1) |
5.05 |
5.71 |
|||||||||
|
Men |
1998-2018 |
0.7 |
(-0.1, 1.6) |
0.7 |
(-0.1, 1.6) |
4.59 |
5.89 |
|||||||||
|
Women |
1998-2018 |
0.3 |
(-0.3, 0.9) |
0.3 |
(-0.3, 0.9) |
5.48 |
5.56 |
|||||||||
|
Queretaro |
||||||||||||||||
|
All |
1998-2018 |
0.3 |
(-1.0, 1.5) |
0.3 |
(-1.0, 1.5) |
3.38 |
4.37 |
|||||||||
|
Men |
1998-2018 |
0.5 |
(-0.9, 1.9) |
0.5 |
(-0.9, 1.9) |
3.90 |
4.26 |
|||||||||
|
Women |
1998-2018 |
0.0 |
(-1.7, 1.7) |
0.0 |
(-1.7, 1.7) |
3.24 |
4.47 |
|||||||||
|
Quintana Roo |
||||||||||||||||
|
All |
1998-2016 |
-0.7 |
(-2.1, 0.6) |
2016-2018 |
24.3 |
(-5.6, 63.6) |
1.5 |
(-1.2, 4.4) |
5.93 |
7.67 |
||||||
|
Men |
1998-2009 |
-3.1 |
(-6.8, 0.9) |
2009-2013 |
12.9 |
(-9.7, 41.1) |
2013-2016 |
-13.4 |
(-41.7, 28.5) |
2016-2018 |
31.3 |
(-5.9, 83.1) |
1.3 |
(-5.9, 9.1) |
5.72 |
7.69 |
|
Women |
1998-2016 |
-1.7 |
(-3.7, 0.3) |
2016-2018 |
29.7 |
(-13.9, 95.2) |
1.0 |
(-3.1, 5.3) |
6.16 |
7.7 |
||||||
|
San Luis Potosi |
||||||||||||||||
|
All |
1998-2018 |
-0.5 |
(-1.2, 0.2) |
-0.5 |
(-1.2, 0.2) |
6.56 |
5.21 |
|||||||||
|
Men |
1998-2018 |
-0.4 |
(-1.3, 0.5) |
-0.4 |
(-1.3, 0.5) |
7.88 |
5.69 |
|||||||||
|
Women |
1998-2018 |
-0.6 |
(-1.6, 0.4) |
-0.6 |
(-1.6, 0.4) |
5.33 |
4.78 |
|||||||||
|
Sinaloa |
||||||||||||||||
|
All |
1998-2018 |
-2.3 |
(-2.9, -1.6) |
-2.3 |
(-2.9, -1.6) |
5.41 |
3.78 |
|||||||||
|
Men |
1998-2018 |
-2.1 |
(-3.3, -0.9) |
-2.1 |
(-3.3, -0.9) |
6.52 |
4.42 |
|||||||||
|
Women |
1998-2018 |
-2.4 |
(-3.5, -1.3) |
-2.4 |
(-3.5, -1.3) |
4.31 |
3.18 |
|||||||||
|
Sonora |
||||||||||||||||
|
All |
1998-2018 |
-0.9 |
(-1.8, 0.0) |
-0.9 |
(-1.8, 0.0) |
5.03 |
3.93 |
|||||||||
|
Men |
1998-2018 |
-0.5 |
(-1.4, 0.5) |
-0.5 |
(-1.4, 0.5) |
5.47 |
4.67 |
|||||||||
|
Women |
1998-2018 |
-1.5 |
(-3.0, 0.0) |
-1.5 |
(-3.0, 0.0) |
4.56 |
3.25 |
|||||||||
|
Tabasco |
||||||||||||||||
|
All |
1998-2018 |
-0.7 |
(-1.3, -0.1) |
-0.7 |
(-1.3, -0.1) |
8.71 |
6.8 |
|||||||||
|
Men |
1998-2018 |
0.3 |
(-0.5, 1.1) |
0.3 |
(-0.5, 1.1) |
7.63 |
8.11 |
|||||||||
|
Women |
1998-2018 |
-1.8 |
(-2.8, -0.8) |
-1.8 |
(-2.8, -0.8) |
9.77 |
5.52 |
|||||||||
|
Tamaulipas |
||||||||||||||||
|
All |
1998-2018 |
-1.5 |
(-2.4, -0.7) |
-1.5 |
(-2.4, -0.7) |
7.65 |
4.63 |
|||||||||
|
Men |
1998-2018 |
-1.6 |
(-2.5, -0.6) |
-1.6 |
(-2.5, -0.6) |
9.91 |
6.2 |
|||||||||
|
Women |
1998-2018 |
-1.5 |
(-2.5, -0.5) |
-1.5 |
(-2.5, -0.5) |
5.62 |
3.28 |
|||||||||
|
Tlaxcala |
||||||||||||||||
|
All |
1998-2018 |
-0.4 |
(-1.8, 1.0) |
-0.4 |
(-1.8, 1.0) |
5.55 |
3.74 |
|||||||||
|
Men |
1998-2018 |
0.0 |
(-1.8, 1.9) |
0.0 |
(-1.8, 1.9) |
3.05 |
2.62 |
|||||||||
|
Women |
1998-2018 |
-0.8 |
(-2.8, 1.2) |
-0.8 |
(-2.8, 1.2) |
7.78 |
4.74 |
|||||||||
|
Veracruz |
||||||||||||||||
|
All |
1998-2004 |
2.7 |
(1.0, 4.3) |
2004-2007 |
-5.6 |
(-13.4, 2.9) |
2007-2016 |
0.3 |
(-0.6, 1.2) |
2016-2018 |
-7.1 |
(-14.1, 0.5) |
-0.7 |
(-2.1, 0.8) |
8.36 |
7.19 |
|
Men |
1998-2018 |
-0.3 |
(-0.8, 0.2) |
-0.3 |
(-0.8, 0.2) |
8.65 |
7.68 |
|||||||||
|
Women |
1998-2018 |
-1.2 |
(-1.7, -0.6) |
-1.2 |
(-1.7, -0.6) |
8.13 |
6.61 |
|||||||||
|
Yucatan |
||||||||||||||||
|
All |
1998-2018 |
-0.6 |
(-1.3, 0.1) |
-0.6 |
(-1.3, 0.1) |
8.92 |
6.28 |
|||||||||
|
Men |
1998-2009 |
-2.6 |
(-4.4, -0.7) |
2009-2012 |
13.9 |
(-12.3, 47.8) |
2012-2018 |
-3.9 |
(-7.6, -0.2) |
-0.7 |
(-4.4, 3.2) |
8.8 |
7.45 |
|||
|
Women |
1998-2018 |
-1.5 |
(-2.5, -0.4) |
-1.5 |
(-2.5, -0.4) |
9.05 |
5.26 |
|||||||||
|
Zacatecas |
||||||||||||||||
|
All |
1998-2018 |
-1.1 |
(-2.3, 0.1) |
-1.1 |
(-2.3, 0.1) |
5.13 |
4.2 |
|||||||||
|
Men |
1998-2018 |
-0.3 |
(-1.8, 1.2) |
-0.3 |
(-1.8, 1.2) |
3.44 |
4.48 |
|||||||||
|
Women |
1998-2018 |
-2.0 |
(-3.5, -0.5) |
-2.0 |
(-3.5, -0.5) |
6.71 |
3.95 |
|||||||||
In bold denotes that the trend was statistically significant different from 0 at the alpha= 0.05 level
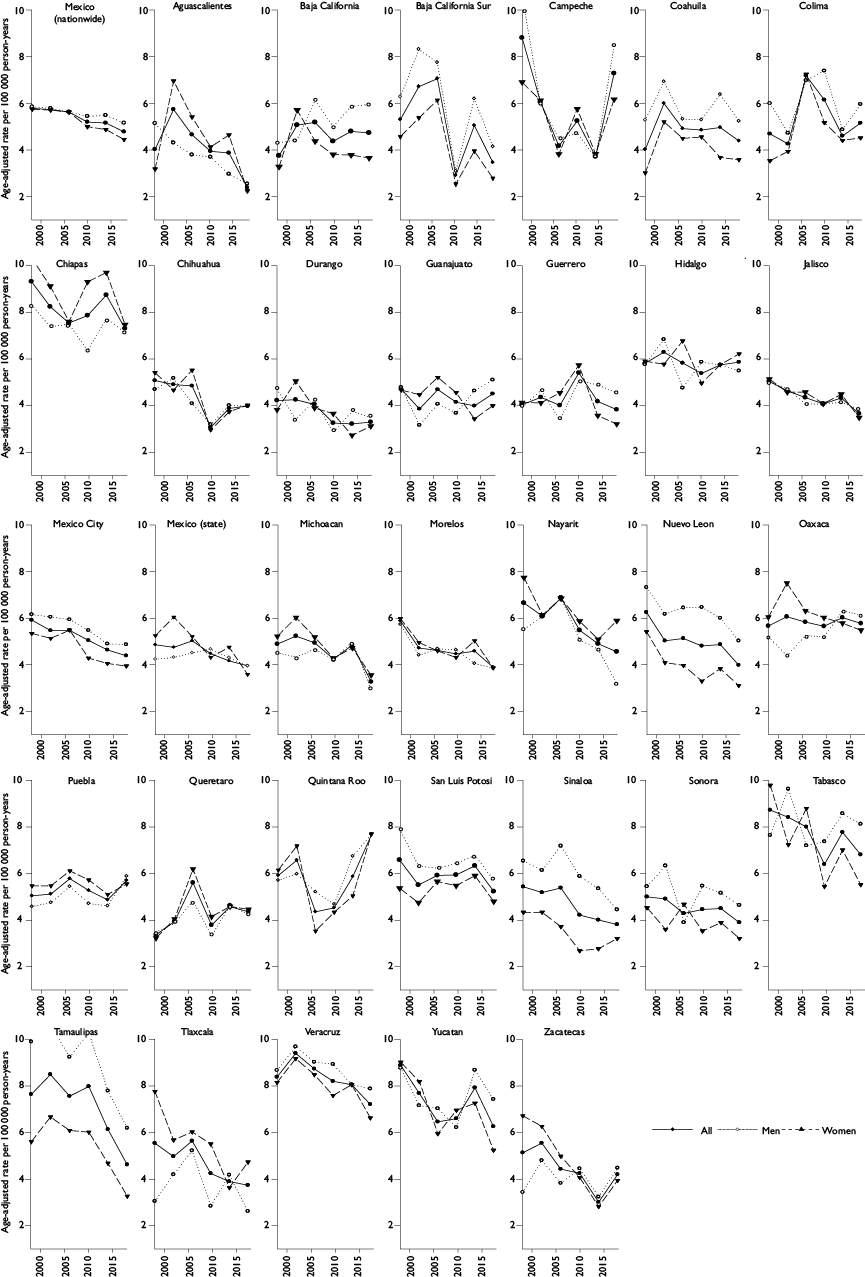
Figure 4 shows the results of the overall and sex-specific APC analysis for each of the models (APC, AC-P [age-cohort model] in blue, and AP-C [age-period model] in red). The liver cancer mortality rates increased exponentially (linear in log-scale) with age (figure 4 (a) (b) and (c) left lines). The cohort analysis found that younger birth cohorts had a lower risk of liver cancer mortality than did the older birth cohorts (figure 4 (a) (b) and (c) middle lines in blue), which was more pronounced among women (figure 4 (c) middle line in blue). For example, the risk of liver cancer mortality was 52% lower (95%CI: 48.9, 55.8) among women born in 1970 as compared to those born in 1930 (data not shown). In addition, the risk of liver cancer mortality slightly decreased with calendar year, particularly among women (figure 4 (c) right line in red). The AC-P model provided the best fit, and with the greatest difference of deviance residual is observed after the cohort is removed from the full APC models for the overall and sex-specific analysis suggesting that birth cohort was the most important factor driving the decrease in liver cancer mortality.

Note: Relative values that weight the goodness of fit of the model to empirical data. A better model fit is indicated by lower AIC values
AIC: Akaike information criteria
* -2 x log (likelihood) + 2 x number of estimated parameters
In each graph: Age effect (left), cohort effect (middle) and period effect (right). In order to see the cohort effect (AC-P Model [blue lines]), the AC-P model constrains the period effect to be 0 (right). In contrast, to examine the period effect (AP-C Model [red lines]), the AP-C model constrains the cohort effect to be 0 (middle)
The thin lines above and below the three effects represent their 95%CI
Cohort effect- refence birth-cohort: 1940. Period effect- reference calendar-year: 2005
Figure 4: Age-period-cohort trend analysis and AIC values for mortality of liver cancer in Mexico (nationwide) by sex, all ages, 1998-2018
Finally, the APC analysis of mortality by state shown that results for most states were similar to those observed for the entire country (data not shown). An exception, however, was noted in Oaxaca among men, where calendar period was the most important factor driving the increase in mortality (AP-C model, AIC: 211.73). The liver cancer mortality risk was approximately 23% (95%CI: 4, 45) higher in 2018 compared to 2005.
Discussion
Over the 21-year interval examined, a decline of nearly 1% in liver cancer mortality rates was observed nationwide, likely driven by a birth cohort effect. An analysis by state found that mortality rates statistically significantly decreased or remained stable in the majority of the states, but rates statistically significantly increased in Oaxaca among men. In the most recent five-year period (2014-2018), sex-specific rates were roughly equal nationwide. In addition, wide disparities in liver cancer mortality by state were evident, with the highest mortality rates observed in southern Mexico.
Similar to our findings, a recent study of global liver cancer mortality trends from 1990 to 2017, estimated between 0% and 25% reduction of liver cancer mortality in Mexico.18 Similarly, reductions in mortality have been reported recently in other Latin American countries, such as Colombia (EAPC: -2.8%, 95%CI: -4.0, -1.7 in men; EAPC: -3.6, 95%CI: -4.6, -2.5 in women) and Ecuador (EAPC= -2.7, 95%CI: -4.6, -0.8).4 Previous reports from Mexico, however, indicated that liver cancer mortality statistically significantly increased from 2000-2007.11,13 In addition, these studies described state variations in the liver cancer trends across the country, with non-statistically significant decreasing rates in a number of states.11 In concert with the liver cancer mortality findings, a recent study reported a statistically significant decrease in alcohol-related liver cirrhosis mortality in Mexico from 2000-2017.19 The manuscript suggested that the reduction could be explained by a decrease in alcohol consumption from 1996 to 2004.19 Despite this decline, cirrhosis remains of Mexico’s leading causes of death.10
Our findings indicate that birth cohort may partially explain the overall reduction of liver cancer mortality. These findings are consistent with those of a U.S. study that reported that liver cancer incidence in younger male cohorts was lower than cohorts born before 1960.20 The manuscript hypothesized that their finding could be related to a higher prevalence of hepatitis C virus (HCV) infection in cohorts born between 1945-1964.20 It is unknown if similar changes in HCV infection prevalence occurred in Mexico, though the overall prevalence of HCV is low. It is possible that competing risks may have also contributed to the overall decline in liver cancer mortality, given the heavy burden of other chronic conditions, including ischemic heart disease, diabetes, chronic kidney disease and cirrhosis.10 In addition, the decline may be related to the improvement in the quality of death registration. The liver is a common site of cancer metastasis, as a result, some secondary liver cancers may have been erroneously counted as primary liver cancers in the past.
Our study found that the burden of liver cancer was not equally distributed across the Mexican population, perhaps reflecting the heterogeneous prevalence of risk factors. The major risk factors for liver cancer in Mexico are not well characterized. The prevalence of HBV and HCV appears to be low (<1.5%),7,8 as well as the prevalence of heavy alcohol consumption (3%).21 On the other hand, several studies have reported aflatoxin contamination in foodstuffs, including maize.22,23,24 However, the evidence of AFB1 exposure in human biomarkers is scarce. Our previous work found detectable serum levels of AFB1 in nearly 85% of individuals from Chiapas,‡ where liver cancer mortality was the highest in the entire country. In addition, the study found that the AFB1-signature mutation in TP53 gene (R249S), was found in liver cancers of persons who resided in rural regions (e.g., Oaxaca and Veracruz). Similarly, a study in Guatemala (the country with the highest liver cancer rates in the Western Hemisphere) found detectable serum levels of AFB1 in 100% of the participants, and those AFB1 levels were higher in individuals from rural versus urban areas of Guatemala.25 It is noteworthy to mention that in cancer risk assessment there is the assumption of a no threshold level that constitutes “safe” level of exposure. AFB1-lys adducts is a biomarker of internal dose that reflect the formation of mutagenic AFB1-DNA adducts and the risk of liver carcinogenesis increases with the level of aflatoxin exposure determined by AFB1-lys adducts.25 In the hepatocytes, AFB1 is transformed into an epoxide via activation of p450 enzymes. The AFB1 7,8 epoxide binds to N7-guanine, where it exerts its carcinogenic effect.26 NAFLD and related metabolic conditions such as obesity, diabetes, and metabolic syndrome are becoming recognized as important risk factors for liver cancer in both high- and low- rate regions.27 The prevalence of these conditions has dramatically increased in Mexico, and they are expected to continue increasing particularly in rural areas.9,28,29 Whether these conditions are related to liver cancer in Mexico deserves further investigation.
The strengths of the current study include the use of a robust approach to assess the effect of age, calendar year and birth cohort on liver cancer mortality. In addition, the study included a long period of analysis (21 calendar years). In comparison, the study also had some limitations. The mortality data were based on information obtained from death certificates, which may be inaccurate. For example, death certificates may erroneously code secondary liver cancer as primary liver cancer. However, it has been reported that the completeness and coding characteristics of the official death registration in Mexico has a good quality.30 In addition, a recent study reported an 85% agreement between death certificates and medical records, particularly for neoplasia.31 Finally, another limitation is that the study was unable to examine trends by liver cancer histology, thus was unable to determine if different trends in histologic types occurred.
In conclusion, there was an overall decline in liver cancer mortality in Mexico between 1998 and 2018, but there is notable geographic variability in rates. The regional variability should be used to inform future studies of liver cancer etiology across the country.

