


 text new page (beta)
 Spanish (pdf)
 Article in xml format
 Article references
 Send this article by e-mail
 Cited by SciELO
  Similars in
SciELO
Similars in
SciELO 
 Permalink
Introduction
Globally, one third of reproductive age women are anemic and almost one half are iron deficient (ID).1,2,3 A surveillance system at population level is recommended to meet evolution of the global burden of anemia, according to the sustainable development goals (SDG-2.2).4,5
In México, ID changed very little (24.8 to 29.4%) from 2006 to 2012, in non-pregnant population (20-49 years of age).6 Nevertheless, the prevalence of anemia in non-pregnant women at the national level fluctuated from 2006 (15.5%) trough 2012 (11.6%) and 2016 (18.3%); worsening in very poor non-pregnant women in 2018 (34.3%), although this was a national survey examining the lower tertile of socioeconomic level.1,7,8,9,10 These results are annoying, since the Federal Government was running at the same time several programs that included a micronutrient supplement: Prospera (a conditional cash transfer program with a nutritional component) and Liconsa, (a program that distributes a micronutrients fortified milk at subsidized prices), both including one RDA of iron. Also a Food Aid Program (PAL, cash transfer), all of them reported positive results for iron status indicators.11,12,13
The most relevant consequences of anemia and iron deficiency anemia (IDA) in women are increments in infection episodes, maternal and fetal mortality, especially in those without access to medical services, multiple pregnancies and older than 35 years.11,12,13,14 Because this surprising bounce in the prevalence of anemia the objective of this paper is to study the proportion of women 20-49 years of age with IDA, ID with non-anemia (IDNA), and non-ID anemia (NIDA) in comparison with woman non-ID with non-anemia (NIDNA) during 2006, 2012 and 2018, and their associations with sociodemographic characteristics and nutritional status. This information will help decision-makers to reevaluate the national strategies to tackle it.7,15,16,17,18,19
Materials and methods
Study design
The Encuesta Nacional de Salud y Nutrición (Ensanut) 2006, 2012, 2018-19 are originally designed as a polyetapic, population-based-, probabilistic surveys of national representativeness, by urban and rural, and four regions: North, Center, Mexico City and South. The methodological details of all Ensanut´s and sampling characteristics and procedures related to these surveys have been previously described.20,21,22
Demographic and socioeconomic information was collected using ad hoc questionnaires. 20,21,22 We analyzed the information of non-pregnant women aged 20-49 years participating in Ensanut of 2006, 2012, 2018-19, who had available data on hemoglobin (Hb) and serum ferritin (sferritin). These serum data come from 30% of the samples of non-pregnant women and were distributed as follows: 2 049 (2006), 3 649 (2012) and 1414 (2018-19) women.20,21,22
Capillary hemoglobin
Hb concentration was measured in capillary blood, using a HemoCue Hb301+ (Angelholm, Sweden) in Ensanut 2006, and Hb201+ in Ensanut 2012 and 2018-19.23
Biochemical analysis of serum ferritin and C - reactive protein
Venous blood samples were obtained from an antecubital vein directly into an evacuated tube, and spin down “in situ” at 3 000 g in a portable centrifuge (Hettingen Tuttlingen, Germany).23 Serum samples were stored in cryoviales and frozen immediately into liquid nitrogen (-169°C) Dewar’s until delivery to the Biochemistry Nutrition Laboratory within Instituto Nacional de Salud Pública (INSP), Cuernavaca, Morelos where they were stored in a -75°C freezer until determinations.23 The ferritin concentrations were measured in Ensanut 2006 using commercial kits in an inmunoanalyzer spectrometer (Opus BN100, Dade Behring Inc, Germany), and in Ensanut 2012 and 2018-19 in an chemoluminescence microparticle immunoassay autoanalyzer Architect (Abbott Lab, Michigan, III USA).24 C-Reactive Protein (CRP) was measured using ultrasensitive monoclonal antibodies in the same Opus BN100 immunoanalyzer and Architect equipment. Quality control of measurements used the Reference Standard Serum NIST 968E of the National Institute of Standards and Technology. The variability of sferritin in 2006, 74.6±4.9mg/L, (c.v.=4.9%); in 2012 76.4±4.7mg/L, (c.v.=6.0%); and 2018=48.3±7.3ug/dL, (c.v.= 8.9%); for CRP in 2006= 1.2±0.05mg/dL, (c.v.=2.2%); in 2012= 1.2±0.05mg/dL, and 2018= 4.87±6.23 mg/L, (c.v.=0.77)
Definition of anemia and iron deficiency
Anemia was defined when Hb concentration was <12.0 g/dL, adjusted by altitude above sea level (>1 000 m) as by Cohen-Hass.25,26 Pregnant women were excluded, because sample size was insufficient for national representation. ID was defined when sferritin was <15ug/dL, after adjusting for inflammation using CRP concentrations as by Thurham.27,28
By combining anemia and ID status, four groups mutually exclusive resulted: 1) iron deficiency anemia (IDA); 2) iron deficiency with non-anemia (IDNA); 3) non-iron-deficiency anemia (NIDA) and 4) non-irondeficiency non-anemia (NIDNA).
Health, sociodemographic, and anthropometric variables
Age was stratified into 20-34 and 35-49 years categories. Indigenous ethnicity was defined if the head of the household self-reported as a speaker of an indigenous language. Dwelling was classified as urban for localities ≥2 500 habitants and rural otherwise. The height was measured in a stadimeter (Seca model-206, Hamburg, Germany), with a 220 cm and a precision of 1 mm. The body weight was measured using an electronic balance (Seca model-874, Hamburg, Germany; 200kg and a precision of 100g).29,30 The body mass index (BMI) was calculated as weight/height2 and categorized by WHO criteria.31,32
One household wellbeing index (HWB), was calculated, through a principal component analysis including household characteristics.20,21,22,33 The first component, with a 51% of total variability and a lambda value of 4.08, was categorized into tertiles representing the poorer people (#1) and the better off layer of the population (#3).33 Affiliation to a medical service were: Mexican Institute of Social Security (Instituto Mexicano del Seguro Social, IMSS); National Institute of Security and Social Services for State workers (Instituto de Seguridad y Servicios Sociales de los Trabajadores del Estado, ISSSTE), Medical Services for workers of a Mexican Oil Company (Petróleos Mexicanos, Pemex), Ministries of Army (Secretaría de la Defensa Nacional, Sedena), Marine (Secretaría de Marina, Semar), People Insurance, IMSS-Prospera and private insurance. All food assistance programs including women as their targets were included.
Ethical considerations
Ensanut 2006, 2012 and 2018-19 were approved by the Ethical, Research and Biosecurity, Committees. Participation of individuals was voluntary and registered under an informed consent letter.
Statistical análisis
Means and prevalence were tabulated with 95% confidence intervals (95%CI) and estimates based on contingency tables. The associations of IDA, IDNA and NIDA with dependent variables had as reference the women NIDNA through multinomial regression models and relative risk ratio (RRR) was calculated. Significance was set at alpha=0.05. All analysis considered the survey design, and was done using the statistical software Stata SE, v15.1 (Stata Corp) 2017.
Results
General characteristics
More than 70% of women had overweight obesity; between 20.6% and 29.4% lived in rural dwelling and ~30% lived in the South (table I). In 2006, 40.3% were beneficiaries of Prospera and 24.6% in 2018-19 (table I). In 2012, 13 and 22.2% of women received iron and folate supplement, and 4.9% and 9.5% in 2018-19, respectively (table I).
Table I: Proportion of characteristics of interest in non-pregnant women aged 20 to 49 years.* México, Ensanut 2006, 2012 and 2018-19
|
Characteristics |
n (sample) |
2006 |
n (sample) |
2012 |
n (sample) |
2018-19 |
||||||
|
Expansion |
Expansion |
Expansion |
||||||||||
|
N (Thousands) |
% |
(95%CI) |
N (Thousands) |
% |
(95%CI) |
N (Thousands) |
% |
(95%CI) |
||||
|
Age (years) |
||||||||||||
|
20 to 34 |
1 240 |
12 327.4 s |
51.8 |
(48.5-55.1) |
1734 |
12 721.8 |
56.7 |
(53.4-59.9) |
704 |
14 644.4 |
54.3 |
(49.9-58.5) |
|
35 to 49 |
1 223 |
11 451.7 |
48.2 |
(44.8-51.4) |
1916 |
9 713.7 |
43.3 |
(40.0-46.5) |
710 |
12 344.6 |
45.7 |
(41.4-50.0) |
|
Indigenous |
||||||||||||
|
Yes |
578 |
5 158.5 |
21.7§ |
(18.5-25.2) |
329 |
1 101.2 |
4.9 |
(3.9-6.0) |
120 |
1 497.2 |
5.5 |
(4.1-7.3) |
|
No |
1 885 |
18 620.6 |
78.3 |
(74.7-81.4) |
3 321 |
21 334.4 |
95.1 |
(93.9-96.0) |
1 294 |
25 491.9 |
94.5 |
(92.6-95.8) |
|
BMI (kg/m2) |
||||||||||||
|
<18.5 |
32 |
439.2 |
1.9 |
(0.9-3.4) |
49 |
287.8 |
1.3 |
(0.8-2.0) |
15 |
366.4 |
1.4 |
(0.7-2.6) |
|
18.5 to 24.9 |
649 |
6 594.1 |
27.9 |
(24.7-31.3) |
944 |
6 244.2 |
28.2 |
(25.1-31.3) |
302 |
6 638.7 |
24.9 |
(21.2-28.9) |
|
25 to 29.9 |
895 |
8 728.4 |
36.9 |
(33.5-40.5) |
1 274 |
7 521.0 |
33.9 |
(30.6-37.3) |
498 |
9 054.2 |
33.9 |
(29.8-38.3) |
|
>=30 |
871 |
7 861.6 |
33.3 |
(30.0-36.7) |
1 359 |
8 122.0 |
36.6 |
(33.5-39.8) |
580 |
10 615.6 |
39.8 |
(35.3-44.4) |
|
Household wealth index‡ | ||||||||||||
|
T I |
1 085 |
8 872.3 |
37.4 |
(34.0-40.9) |
1 289 |
5 413.7 |
24.1§ |
(21.8-26.5) |
558 |
8 369.9 |
31.0 |
(27.4-34.7) |
|
T II |
884 |
8 226.4 |
34.7 |
(31.4-38.0) |
1 288 |
7 265.4 |
32.4 |
(29.3-35.6) |
507 |
9 136.0 |
33.9 |
(29.9-37.9) |
|
T III |
485 |
6 610.3 |
27.9 |
(24.4-31.6) |
1 073 |
9 756.5 |
43.5§ |
(39.8-47.2) |
349 |
9 483.2 |
35.1 |
(30.6-39.9) |
|
Number of pregnancies |
||||||||||||
|
None |
281 |
4 097.1 |
17.2 |
(14.3-20.4) |
538 |
3 948.9 |
17.6 |
(15.2-20.2) |
250 |
6495.3 |
24.1 |
(19.9-28.7) |
|
1 to 3 |
1 219 |
11 839.6 |
49.8 |
(46.2-53.2) |
2 013 |
13 284.8 |
59.2§ |
(55.9-62.4) |
853 |
15 618.3 |
57.9 |
(53.1-62.4) |
|
4 to 6 |
749 |
6 128.1 |
25.8 |
(23.1-28.5) |
952 |
4 651.1 |
20.7 |
(18.4-23.2) |
283 |
4 538.9 |
16.8 |
(13.9-20.1) |
|
>7 |
214 |
1 714.3 |
7.2 |
(5.7-9.0) |
147 |
550.7 |
2.5 |
(1.9-3.2) |
28 |
336.5 |
1.2 |
(0.8-2.0) |
|
Number of abortions |
||||||||||||
|
None |
1 733 |
15 571.8 |
79.4 |
(76.3-82.0) |
2 451 |
14 780.3 |
79.9 |
(76.8-82.5) |
912 |
16 123.3 |
78.7 |
(74.6-82.2) |
|
1 |
347 |
3 230.2 |
16.5 |
(13.9-19.3) |
512 |
2 831.1 |
15.3 |
(12.8-18.1) |
198 |
3 264.0 |
15.9 |
(12.9-19.4) |
|
>2 |
100 |
819.6 |
4.2 |
(3.1-5.5) |
149 |
893.6 |
4.8 |
(3.7-6.3) |
54 |
11 06.4 |
5.4 |
(3.5-8.1) |
|
Locality |
||||||||||||
|
Urban |
1 570 |
16 778.9 |
70.6 |
(66.2-74.5) |
2 349 |
17 818.2 |
79.4 |
(77.0-81.6) |
949 |
21 172.8 |
78.4 |
(75.6-80.9) |
|
Rural |
893 |
7 000.2 |
29.4§ |
(25.4-33.7) |
1 301 |
4 617.4 |
20.6 |
(18.3-22.9) |
465 |
5 816.2 |
21.6 |
(19.0-24.3) |
|
Region |
||||||||||||
|
North |
295 |
3 148.6 |
13.2§ |
(11.0-15.7) |
914 |
4 861.6 |
21.7 |
(19.7-23.6) |
233 |
5 324.3 |
19.7 |
(17.2-22.4) |
|
Center |
1 152 |
8 317.3 |
35.0 |
(30.8-39.3) |
1 305 |
6 446.9 |
28.7 |
(26.0-31.5) |
494 |
8 539.9 |
31.6 |
(28.2-35.2) |
|
CDMX |
81 |
3 737.7 |
15.7 |
(12.7-19.2) |
119 |
4 761.9 |
21.2§ |
(17.8-25.0) |
46 |
4 557.9 |
16.9 |
(13.6-20.7) |
|
South |
935 |
8 575.5 |
36.1 |
(32.4-39.8) |
1 312 |
6 365.2 |
28.4 |
(25.9-30.9) |
641 |
8 567.0 |
31.7 |
(28.6-35.0) |
|
Affiliation to medical service | ||||||||||||
|
IMSS |
588 |
6 328.2 |
26.6§ |
(23.4-30.0) |
891 |
6 464.0 |
28.8 |
(25.5-32.2) |
408 |
8 443.7 |
31.4 |
(27.2-35.9) |
|
ISSSTE |
84 |
720.3 |
3.0 |
(2.2-4.1) |
165 |
1 034.1 |
4.6 |
(3.5-6.0) |
66 |
1 542.0 |
5.7 |
(3.5-9.0) |
|
Popular insurance |
585 |
3 676.0 |
15.5 |
(12.3-19.) |
1 885 |
8 802.6 |
39.3 |
(36.0-42.5) |
735 |
12 290.4 |
45.7 |
(41.4-50.1) |
|
Private or other Institution |
85 |
961.7 |
4.0§ |
(2.5-6.4) |
45 |
486.2 |
2.2 |
(1.2-3.7) |
19 |
639.6 |
2.4 |
(1.1-5.0) |
|
No affiliated |
1 118 |
12 082.0 |
50.8§ |
(46.0-55.0) |
662 |
5 638.9 |
25.1 |
(22.1-28.4) |
180 |
3 948.9 |
14.7 |
(11.8-18.1) |
|
Beneficiary of Social Programs | ||||||||||||
|
PAL |
9 |
92.8 |
0.4 |
(0.1-0.9) |
62 |
344.7 |
1.6§ |
(1.0-2.4) |
- |
- |
- |
- |
|
Liconsa |
143 |
2 257.3 |
9.5 |
(7.0-12.7) |
62 |
290.1 |
9.2 |
(4.2-18.8) |
116 |
2 250.9 |
8.4 |
(5.9-11.6) |
|
Prospera |
1 290 |
9 586.0 |
40.3§ |
(36.4-44.2) |
219 |
404.9 |
12.8 |
(10.2-15.9) |
457 |
6 616.0 |
24.6 |
(21.3-28.2) |
|
Iron supplement |
- |
- |
- |
- |
551 |
2 758.9 |
13.0 |
(11.1-15.0) |
96 |
1 312.3 |
4.9§ |
(3.5-6.6) |
|
Folic acid supplement |
- |
- |
- |
- |
969 |
4 716.6 |
22.2 |
(19.4-25.2) |
171 |
2 554.4 |
9.5§ |
(7.50-11.9) |
* Estimates adjusted by the survey sample design
‡Household wealth index: Tertil 1: worst conditions and Tercil 3: best conditions.
§Comparisons between survey years within anemia categories, p<0.05, based on contingency tables adjusted by survey design
IMSS: Instituto Mexicano del Seguro Social; ISSSTE: Instituto de Seguridad y Servicios Sociales de los Trabajadores del Estado.
Pal: Food aid program
CI: confidence interval
Ensanut: Encuesta Nacional de Salud y Nutrición
The total prevalence of ID was 29.0% in 2006, 29.6% in 2012 and 25.7% in 2018-19; anemia was 14.9%, 13.3% and 21.4%respectively, increasing 8.1 percentage points from 2012 to 2018-19 (p<0.05). The prevalence of ID showed a non-significant trend to decline through the evaluated years (2006-2018). The proportion of women with CRP>5 was lower (p<0.05) in 2012 (20.5%) than in 2006 (28.4%) and 2018-19 (30.5%) (figure 1).
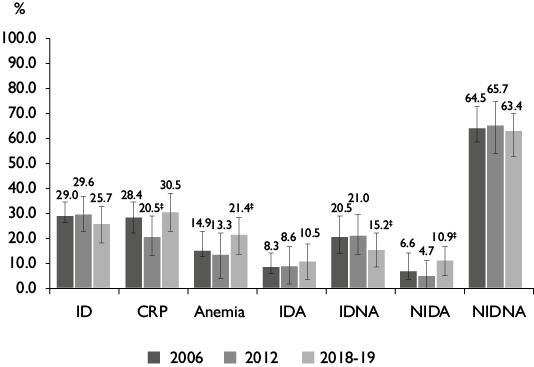
* Estimates adjusted by the survey sample design. Ensanut 2006 [n sample=2 449, N Thousands=23 664.9], Ensanut 2012 [n sample= 3 649, N Thousands =22 433.8] and Ensanut 2018-19 [n sample= 1 414, N Thousands =26 989.1].
‡ p<0.05, Multinomial regression adjusted by survey design
ID: Iron deficiency; CRP: C reactive protein; IDA: Iron deficiency anemia; IDNA: Iron deficiency without anemia; NIDA: non-iron deficient anemia; NIDNA: non-iron deficient without anemia
Ensanut: Encuesta Nacional de Salud y Nutrición
Figure 1 Prevalence of iron deficiency and anemia combined in non-pregnant women aged 20 to 49 years.* México, Ensanut 2006, 2012 and 2018-19
Differences in the proportion of women (>=35 years) between survey’s year (p<0.005) by age age group in 2012 for IDA (62.2%) and for NIDA (48.5%), in 2018-19 (44.6%) for IDNA, for urban (84.0%) NIDA compared with other year (tables II, III).
Table II: Proportion of non-pregnant women aged 20 to 49 years, according iron deficiency combined with anemia and sociodemographic characteristics.* México, Ensanut 2006, 2012 and 2018-19
|
IDA |
IDNA |
NIDA |
|||||||||||||||||
|
2006 |
2012 |
2018 |
2006 |
2012 |
2018 |
2006 |
2012 |
2018 |
|||||||||||
|
% |
(95%CI) |
% |
(95%CI) |
% |
(95%CI) |
% |
(95%CI) |
% |
(95%CI) |
% |
(95%CI) |
% |
(95%CI) |
% |
(95%CI) |
% |
(95%CI) |
||
|
Age |
|||||||||||||||||||
|
20 to 34 |
56.0 |
(45.1-66.3) |
39.8 |
(27.0-54.2) |
49.0 |
(33.9-64.3) |
55.2 |
(48.3-61.9) |
58.4 |
(51.6-64.8) |
44.6‡ |
(32.3-57.7) |
52.1 |
(35.7-68.1) |
51.5‡ |
(41.5-61.4) |
52.8 |
(41.6-63.7) |
|
|
35 to 49 |
44.0 |
(33.7-54.9) |
60.2‡ |
(45.8-73.0) |
51.0 |
(35.7-66.1) |
44.8 |
(38.1-51.7) |
41.6 |
(35.2-48.4) |
55.4 |
(42.3-67.7) |
47.9 |
(31.9-64.3) |
48.5‡ |
(38.6-58.5) |
47.2 |
(36.3-58.4) |
|
|
Indigenous | |||||||||||||||||||
|
Yes |
23.4 |
(14.6-35.3) |
4.4 |
(2.5-7.6) |
3.9 |
(2.0-7.6) |
19.3 |
(14.5-25.1) |
5.2 |
(3.6-7.4) |
5.3 |
(2.1-12.8) |
37.1 |
(19.8-58.5) |
5.1 |
(2.9-8.8) |
5.0 |
(2.7-9.0) |
|
|
No |
76.6 |
(64.7-85.4) |
95.6 |
(92.4-97.5) |
96.1 |
(92.4-98.0) |
80.7 |
(74.9-85.5) |
94.8 |
(92.6-96.4) |
94.7 |
(87.2-97.9) |
62.9‡ |
(41.5-80.2) |
94.9 |
(91.2-97.1) |
95.0 |
(91.0-97.3) |
|
|
BMI (kg/m2) | |||||||||||||||||||
|
<18.5 |
2.5 |
(0.7-9.2) |
0.9 |
(0.1-5.1) |
1.5 |
(0.4-6.0) |
0.8 |
(0.3-2.4) |
2.7 |
(1.3-5.9) |
0.1 |
(0.0-0.9) |
0.2 |
(0.0-0.9) |
1.2 |
(0.3-4.6) |
0.2 |
(0.0-1.4) |
|
|
18.5 to 24.9 |
27.6 |
(18.8-38.5) |
24.3 |
(12.7-41.4) |
30.0 |
(17.5-46.4) |
32.6 |
(26.6-39.3) |
37.4 |
(30.4-45.0) |
26.7 |
(17.5-38.5) |
30.4 |
(19.2-44.5) |
32.9 |
(24.1-43.1) |
29.9 |
(19.0-43.7) |
|
|
25 to 29.9 |
37.8 |
(28.1-48.6) |
37.3 |
(24.5-52.3) |
34.9 |
(21.5-51.3) |
31.0 |
(25.7-36.8) |
30.8 |
(25.1-37.1) |
30.6 |
(20.3-43.4) |
46.6 |
(29.9-64.1) |
30.9 |
(22.7-40.6) |
31.2 |
(22.1-41.9) |
|
|
>=30 |
32.1 |
(22.3-43.8) |
37.4 |
(26.3-50.1) |
33.6 |
(21.4-48.4) |
35.6 |
(29.4-42.3) |
29.1 |
(23.4-35.5) |
42.5 |
(29.2-57.0) |
22.8 |
(13.4-36.0) |
35.0 |
(25.6-45.8) |
38.7 |
(28.8-49.6) |
|
|
Household wealth index§ | |||||||||||||||||||
|
T I |
39.5 |
(29.1-50.9) |
29.8 |
(20.6-41.1) |
40.1 |
(26.6-55.2) |
37.9 |
(31.9-44.4) |
28.2 |
(23.2-33.9) |
29.6 |
(19.7-41.8) |
40.2 |
(25.9-56.4) |
26.9 |
(19.9-35.3) |
33.3 |
(23.8-44.5) |
|
|
T II |
43.9 |
(32.9-55.6) |
41.4 |
(28.4-55.8) |
21.6 |
(13.3-32.9) |
39.0 |
(32.8-45.6) |
36.2 |
(29.7-43.2) |
27.0 |
(17.9-38.7) |
41.5 |
(24.6-60.7) |
38.4 |
(29.0-48.7) |
36.9 |
(26.8-48.3) |
|
|
T III |
16.6 |
(10.8-24.6) |
28.8 |
(16.8-44.7) |
38.4 |
(23.8-55.4) |
23.1 |
(17.1-30.3) |
35.6 |
28.5-43.3) |
43.4 |
(29.8-58.0) |
18.3 |
(10.7-29.6) |
34.7 |
(25.7-45.0) |
29.8 |
(19.8-42.1) |
|
|
Locality | |||||||||||||||||||
|
Urban |
68.2 |
(58.3-76.7) |
78.5 |
(70.5-84.8) |
82.3 |
(73.6-88.6) |
76.0 |
(70.7-80.6) |
76.5 |
(71.9-80.5) |
77.4 |
(67.2-85.2) |
63.4 |
(42.1-80.5) |
80.0 |
(72.6-85.8) |
84.0‡ |
(77.2-89.1) |
|
|
Rural |
31.8 |
(23.3-41.7) |
21.5 |
(15.2-29.5) |
17.7 |
(11.4-26.4) |
24.0 |
(19.4-29.3) |
23.5 |
(19.5-28.1) |
22.6 |
(14.8-32.8) |
36.6 |
(19.5-57.9) |
20.0 |
(14.2-27.4) |
16.0 |
(10.9-22.8) |
|
|
Region | |||||||||||||||||||
|
North |
14.2 |
(9.0-21.5) |
16.0 |
(10.8-23.2) |
26.4 |
(16.0-40.3) |
10.1 |
(7.4-13.6) |
17.5 |
(13.7-22.0) |
12.6 |
(6.7-22.5) |
11.7 |
(6.1-21.4) |
26.1 |
(18.7-35.2) |
40.7 |
(30.4-51.8) |
|
|
Center |
38.1 |
(29.0-48.1) |
25.0 |
(17.8-34.0) |
20.5 |
(13.4-30.1) |
31.2 |
(25.4-37.7) |
31.4 |
(26.3-37.0) |
38.4 |
(27.1-51.2) |
37.7 |
(20.5-58.6) |
31.7 |
(23.2-41.6) |
20.8 |
(14.4-29.1) |
|
|
CDMX |
16.6 |
(8.2-30.7) |
27.4 |
(13.7-47.3) |
22.0 |
(10.3-40.9) |
11.6 |
(7.3-17.9) |
19.7 |
(13.0-28.8) |
21.3 |
( 9.0-42.3) |
11.4 |
(3.8-29.6) |
9.7 |
(3.8-22.4) |
7.3 |
(2.6-19.0) |
|
|
South |
31.2 |
(23.2-40.5) |
31.5 |
(22.7-41.9) |
31.1 |
(19.2-46.2) |
47.2 |
(40.7-53.7) |
31.4 |
(26.5-36.7) |
27.6 |
(19.4-37.8) |
39.2 |
(25.3-55.0) |
32.5 |
(24.5-41.7) |
31.2 |
(22.7-41.1) |
|
*Estimates adjusted by the survey sample design, CI: Confidence interval
‡Comparisons between survey years within anemia category, p<0.05, based on contingency tables adjusted by survey design
§Household wealth index, Tertil 1: worst conditions and Tercil 3: best conditions.
ID: iron deficiency, IDA: Iron deficiency anemia, IDNA: iron deficiency non-anemia, NIDA: non-iron deficient anemia.
BMI: Body mass index
Ensanut: Encuesta Nacional de Salud y Nutrición
Table III: Proportion of non-pregnant women aged 20 to 49 years, according to iron deficiency combined with anemia, gynecological, affiliation to medical services and social program.* México, Ensanut 2006, 2012 and 2018-19
|
IDA |
IDNA |
NIDA |
|||||||||||||||||||
|
2006 |
2012 |
2018 |
2006 |
2012 |
2018 |
2006 |
2012 |
2018 |
|||||||||||||
|
% |
(95%CI) |
% |
(95%CI) |
% |
(95%CI) |
% |
(95%CI) |
% |
(95%CI) |
% |
(95%CI) |
% |
(95%CI) |
% |
(95%CI) |
% |
(95%CI) |
||||
|
Number of pregnancies |
|||||||||||||||||||||
|
None |
8.1 |
(4.1-15.2) |
4.9 |
(2.4-9.7) |
27.9 |
(14.0-47.9) |
16.0 |
(10.7-23.1) |
15.4 |
(11.2-20.8) |
16.6 |
(8.6-29.8) |
6.6 |
(2.7-15.4) |
20.0 |
(12.4-30.7) |
23.5 |
(13.7-37.3) |
|||
|
1 to 3 |
55.4 |
(44.2-66.1) |
65.2 |
(50.4-77.6) |
51.3 |
(36.0-66.5) |
54.4 |
(47.0-61.6) |
59.9 |
(53.0-66.4) |
65.2 |
(52.6-75.9) |
52.7 |
(37.0-67.9) |
54.3 |
(44.6-63.7) |
55.4 |
(43.4-66.9) |
|||
|
4 to 6 |
32.1 |
(22.2-43.8) |
27.7 |
(15.9-43.7) |
18.3 |
(10.8-29.2) |
23.7 |
(19.0-29.2) |
21.4 |
(16.5-27.4) |
16.9 |
(10.9-25.2) |
30.3 |
(19.6-43.8) |
21.1 |
(14.9-29.0) |
19.1 |
(12.2-28.5) |
|||
|
>7 |
7.7 |
(5.8-10.2) |
2.3 |
(1.2-4.1) |
2.4 |
(0.6-9.1) |
10.3 |
(5.3-19.2) |
3.3 |
(2.0-5.5) |
1.3 |
(0.3-4.7) |
4.5 |
(2.1-9.2) |
4.5 |
(2.2-9.2) |
2.0 |
(0.7-5.1) |
|||
|
Number of abortions | |||||||||||||||||||||
|
None |
79.4 |
(66.2-88.4) |
87.1 |
(79.3-92.2) |
69.5 |
(55.5-80.6) |
81.7 |
(76.0-86.3) |
80.1 |
(74.1-84.9) |
88.4 |
(81.1-93.1) |
77.9 |
(65.2-87.0) |
75.1‡ |
(65.4-82.8) |
78.8 |
(69.9-85.6) |
|||
|
1 |
18.1 |
(9.6-31.6) |
8.7 |
(4.6-15.7) |
21.0 |
(12.3-33.5) |
16.2 |
(11.8-21.9) |
16.0 |
(11.8-21.5) |
7.7 |
(4.2-13.6) |
19.1 |
(10.8-31.6) |
19.6 |
(12.8-28.8) |
19.1 |
(12.6-27.8) |
|||
|
>2 |
2.5 |
(0.8-7.6) |
4.3 |
(2.0-9.1) |
9.5 |
(3.6-22.9) |
2.1 |
(1.0-4.0) |
3.9 |
(1.9-7.8) |
3.9 |
(1.6-9.3) |
2.9 |
(1.1-7.6) |
5.3 |
(2.5-11.3) |
2.1 |
(0.7-5.9) |
|||
|
Affiliation to medical services | |||||||||||||||||||||
|
IMSS |
29.4 |
(20.4-40.3) |
16.7 |
(11.1-24.4) |
28.6 |
(17.6-42.9) |
25.2 |
(19.1-32.5) |
27.0 |
(21.6-33.1) |
35.8 |
(22.5-51.7) |
13.3 |
(7.5-22.4) |
31.8 |
(23.4-41.7) |
29.6 |
(21.5-39.3) |
|||
|
ISSSTE |
2.4 |
(0.8-7.1) |
2.6 |
(1.2-5.6) |
11.3 |
(3.0-34.2) |
1.7 |
(0.8-3.6) |
4.6 |
(2.4-8.4) |
2.7 |
(1.1-6.4) |
3.5 |
(1.3-9.3) |
4.2 |
(1.3-12.1) |
3.5 |
(0.8-13.7) |
|||
|
Popular insurance |
16.4 |
(9.2-27.4) |
56.9 |
(44.6-68.4) |
45.4 |
(31.4-60.2) |
10.8 |
(7.8-14.7) |
40.1 |
(34.1-46.3) |
42.1 |
(30.3-54.7) |
11.6 |
(6.6-19.7) |
37.1 |
(28.7-46.4) |
38.5 |
(28.5-49.6) |
|||
|
Private or other |
1.9 |
(0.5-7.4) |
0.2 |
(0.1-1.0) |
0.0 |
2.3 |
(1.2-4.2) |
3.4 |
(1.0-11.5) |
3.1 |
(0.6-14.0) |
4.7 |
(1.4-14.4) |
4.3 |
(1.1-15.6) |
0.7 |
(0.2-2.9) |
||||
|
No afiliated |
49.9 |
(38.7-61.2) |
23.5 |
(15.7-33.6) |
14.7 |
(7.4-27.0) |
60.0 |
(53.2-66.5) |
24.9 |
(18.3-33.1) |
16.3 |
(10.1-25.4) |
66.9 |
(52.5-78.7) |
22.7 |
(14.5-33.7) |
27.7 |
(17.3-41.0) |
|||
|
Beneficiary of social programs | |||||||||||||||||||||
|
PAL |
- |
- |
2.1 |
(0.5-7.9) |
4.7 |
(1.9-10.8) |
0.1 |
(0.0-0.8) |
1.7 |
(0.6-5.0) |
7.4 |
(4.0-13.2) |
- |
- |
0.1 |
(0.0-0.6) |
7.6 |
(2.7-19.6) |
|||
|
Liconsa |
1.2 |
(0.3-5.2) |
1.2 |
(0.3-5.2) |
3.8 |
(1.9-7.3) |
4.3 |
(1.7-10.3) |
4.3 |
(1.7-10.3) |
5.0 |
(2.5-9.5) |
8.8 |
(2.3-28.1) |
8.8 |
(2.3-28.1) |
3.3 |
(1.4-7.5) |
|||
|
Prospera |
43.8 |
(33.7-54.4) |
23.8 |
(12.0-41.7) |
22.2 |
(14.4-32.6) |
40.0 |
(33.8-46.6) |
12.3 |
(6.5-22.1) |
28.9 |
(20.0-39.8) |
33.6 |
(21.5-48.3) |
10.7 |
(4.9-21.9) |
25.0 |
(17.0-35.2) |
|||
|
Iron supplement |
- |
- |
10.6 |
(6.5-17.0) |
2.4 |
(1.0-5.8) |
- |
- |
16.2 |
(12.2-21.3) |
5.8 |
(2.7-12.1) |
- |
- |
13.5 |
(8.9-19.9) |
4.3 |
(2.1-8.4) |
|||
|
Folic acid supplement |
- |
- |
26.0 |
(14.0-43.1) |
10.0 |
(5.5-17.4) |
- |
- |
27.1 |
(20.6-34.9) |
14.1 |
(8.0-23.5) |
- |
- |
22.2 |
(15.2-31.2) |
6.0 |
(3.3-10.6) |
|||
* Estimates adjusted by the survey sample design,
‡p<0.05, Estimates based on contingency tables adjusted by survey design. Reference group: no iron deficient non-anemia (NIDNA)
IMSS: Instituto Mexicano del Seguro Social; ISSSTE: Instituto de Seguridad y Servicios Sociales de los Trabajadores del Estado.
PAL: Food aid program
ID: iron deficiency-IDA: iron deficiency anemia, IDNA: iron deficiency non-anemia, NIDA: non-iron deficient anemia.
CI: Confidence interval
Ensanut: Encuesta Nacional de Salud y Nutrición
IDA
Although the prevalence of IDA increased trough years, the differences were not significant (figure 1). In the adjusted multinomial model was found that being beneficiary of Liconsa was negatively associated with the prevalence of IDA (RRR=0.297 [95%CI: 0.13- 0.64], p=0.002) and affiliated to private medical service (RRR=0.195 [95%CI: 0.03-0.97], p=0.047) (table IV).
Table IV: Association between the categories of iron deficiency and anemia with the variables of interest in no pregnant women aged 20 to 49 years.*,‡ México, Ensanut 2006, 2012 y 2018-19
|
IDA |
IDNA |
NIDA |
|||||||
|
RRR |
(95%CI) |
p value |
RRR |
(95%CI) |
p value |
RRR |
(95%CI) |
p value |
|
|
Year of survey‡ | |||||||||
|
2006 |
Ref |
Ref |
Ref |
||||||
|
2012 |
0.671 |
(0.37-1.20) |
0.178 |
1.109 |
(0.63-1.93) |
0.716 |
0.888 |
(0.45-1.71) |
0.725 |
|
2018 |
1.408 |
(0.91-2.17) |
0.124 |
0.979 |
(0.68-1.40) |
0.906 |
2.398 |
(1.48-3.87) |
0.000 |
|
BMI (kg/m2) |
|||||||||
|
<18.5 |
Ref |
||||||||
|
18.5 to 24.9 |
0.967 |
(0.29-3.20) |
0.956 |
5.139 |
(1.68-15.7) |
0.004 |
10.459 |
(2.20-49.5) |
0.003 |
|
25 to 29.9 |
0.760 |
(0.23-2.48) |
0.649 |
3.085 |
(0.99-9.59) |
0.052 |
8.472 |
(1.68-42.5) |
0.010 |
|
>=30.0 |
0.654 |
(0.19-2.18) |
0.490 |
3.665 |
(1.19-11.2) |
0.023 |
7.021 |
(1.47-33.5) |
0.015 |
|
Number of pregnancies | |||||||||
|
None |
Ref |
Ref |
Ref |
||||||
|
1 to 3 |
1.248 |
(0.63-2.44) |
0.518 |
1.616 |
(0.95-2.74) |
0.077 |
1.866 |
(1.06-3.27) |
0.030 |
|
4 to 6 |
1.558 |
(0.76-3.15) |
0.218 |
1.386 |
(0.77-2.47) |
0.270 |
2.066 |
(1.13-3.74) |
0.017 |
|
>7 |
1.179 |
(0.47-2.94) |
0.724 |
1.130 |
(0.51-2.48) |
0.762 |
2.651 |
(1.23-5.69) |
0.013 |
|
Affiliation to medical services | |||||||||
|
IMSS |
Ref |
Ref |
Ref |
||||||
|
ISSSTE |
1.681 |
(0.43-6.44) |
0.448 |
0.424 |
(0.19-0.92) |
0.032 |
0.889 |
(0.31-2.51) |
0.824 |
|
Popular insurance |
1.005 |
(0.56-1.77) |
0.986 |
0.705 |
(0.42-1.16) |
0.174 |
0.911 |
(0.57-1.44) |
0.692 |
|
Private or other |
0.195 |
(0.03-0.97) |
0.047 |
0.716 |
(0.24-2.11) |
0.545 |
0.894 |
(0.27-2.90) |
0.851 |
|
No afiliated |
1.307 |
(0.78-2.18) |
0.307 |
1.432 |
(0.94-2.16) |
0.087 |
2.616 |
(1.61-4.25) |
0.000 |
|
Prospera |
|||||||||
|
No |
Ref |
Ref |
Ref |
||||||
|
Yes |
1.199 |
(0.82-1.74) |
0.341 |
1.246 |
(0.89-1.74) |
0.198 |
1.053 |
(0.57-1.93) |
0.867 |
|
Liconsa |
|||||||||
|
No |
Ref |
||||||||
|
Yes |
0.297 |
(0.13-0.64) |
0.002 |
0.481 |
(0.25-0.89) |
0.021 |
0.588 |
(0.29-1.18) |
0.138 |
|
Locality |
|||||||||
|
Urban |
Ref |
||||||||
|
Rural |
0.891 |
(0.61-1.28) |
0.535 |
0.684 |
(0.48-0.97) |
0.033 |
0.794 |
(0.41-1.53) |
0.492 |
|
Region |
|||||||||
|
North |
Ref |
Ref |
Ref |
||||||
|
Center |
0.576 |
(0.35-0.94) |
0.029 |
1.550 |
(1.00-2.40) |
0.050 |
0.432 |
(0.25-0.74) |
0.003 |
|
CDMX |
1.055 |
(0.45-2.45) |
0.900 |
1.425 |
(0.62-3.23) |
0.397 |
0.217 |
(0.08-0.55) |
0.001 |
|
South |
0.725 |
(0.41-1.26) |
0.260 |
1.656 |
(1.08-2.53) |
0.021 |
0.530 |
(0.33-0.84) |
0.008 |
|
Age (years) |
|||||||||
|
20 to 34 |
Ref |
Ref |
Ref |
||||||
|
35 to 49 |
1.069 |
(0.67-1.68) |
0.775 |
1.176 |
(0.83-1.64) |
0.348 |
1.103 |
(0.72-1.68) |
0.651 |
|
Constant |
0.154 |
(0.04-0.55) |
0.004 |
0.037 |
(0.01-0.12) |
0.000 |
0.008 |
(0.00-0.04) |
0.000 |
*Multinomial logistic regression adjusted by survey design. Reference group: no iron deficient non-anemia (NIDNA)
‡Ensanut 2006 (n sample=2 449, N [Thousands]=23 664.9), Ensanut 2012 (n sample= 3 649, N [thousands]=22 433.8) and Ensanut 2018-19 (n sample= 1 414, N [Thousands]=26 989.1)
BMI: body mass index
RRR: relative risk ratio
IMSS: Instituto Mexicano del Seguro Social
ISSSTE: Instituto de Seguridad y Servicios Sociales de los Trabajadores del Estado
Ensanut: National Health and Nutrition Survey
IDA: Iron deficiency anemia, IDNA: Iron deficiency non-anemia, NIDA: non-iron deficient anemia. CI: Confidence interval
IDNA
Lower prevalence of IDNA was observed in women in 2018-19 (15.2%) compared with 2012 (p<0.05) (figure 1). In the multinomial model beneficiaries of ISSSTE (RRR=0.424 [95%CI: 0.19-0.92], p=0.032) and Liconsa (RRR=0.481 [95%CI: 0.25-0.89], p=0.021) were negatively associated with IDNA; and positively with normal (RRR=5.139 [95%CI: 1.68-15.7], p=0.004) to overweight (RRR=3.665, [95%CI: 1.19-11.2], p=0.004) (table IV).
NIDA
The prevalence of NIDA was greater (p<0.05) in 2018 (10.9%) compared with 2006 (6.6%) or 2012 (4.7%), (figure 1). In the multinomial model, a significant rising in the prevalence of NIDA was observed in 2018-19 (RRR=2.398 [95%CI: 1.48-3.87], p<0.01) and was positively associated with a larger number of pregnancies (RRR=2.651 [95%CI: 1.23-5.69], p=0.013), BMI of 18.5 to 24.9 kg/m2 (RRR=7.021 [95%CI: 1.47-33.5], p=0.015), and no affiliated to medical services (RRR=2.616 [95%CI: 1.61-4.25], p<0.01) (table IV).
Discussion
The most frequent causes of anemia has been iron deficiency, hookworm infestation, sickle-cell disorders, thalassemia, schistosomiasis and malaria, however in Mexico except for iron deficiency the other causes are very uncommon, it was not surprising that, no changes occurred in the prevalence of IDA throughout 2006 to 2018-19. The effects of IDA on women at reproductive age are maternal and child mortality, physical performance, and referral to health-care professionals. Several chronic diseases are frequently associated with iron deficiency anaemia: chronic kidney disease, chronic heart failure, cancer, and inflammatory bowel disease.2,3,14,15,16 According to a systematic-analyses the prevalence of anemia in 2003-2005 in Nicaragua was 34.3% and in México 14.9%; in 2012 in Ecuador was 27.2% and México 13.3%.34
During the same period, there was a significant increment in the prevalence of NIDA that may suggest the existence of other potentials causes of anemia that could be due to: a) Changes in the prevalence of folate and vitamin B12 deficiencies,35,36 nevertheless, we did not measure them in this age group, however we did it in children 1-11 years of age and the prevalence of both was reduced.6,37 b) Measurement error in Hb determination using HemoCué 201+ equipment in the last two surveys may introduce a bias between surveys, nevertheless, some studies had reported that this model had a better performance in comparison with other Hemocue models.38,39 This improvement of Hemocue could result in lower concentrations of Hb and will furnished a higher prevalence of anemia. c) We cannot discard a real increment in the prevalence of anemia due to any known or unknown causes.
IDNA had a significative reduction in 2018-19, unfortunately it may go unrecognized for longer periods, until IDA is manifestated.40,41 One of the most probable causes is vitamin A deficiency 42,43 which impedes the mobilization of iron from the liver.
It is important to clarify the paradoxical trend to decrease in IDNA and the increase in NIDA. These may mean that ID is not the responsible for the increase in total anemia and that NIDA is part to better explain the difference in the prevalence of anemia; and the high number of pregnancies, overweight-obesity and not being affiliated with any medical health services significantly increase the risk of NIDA. Also it is important to pinpoint that there were differences also in the method to measure sferritin in 2006 versus 2012 and 2018-19, this could contribute to an unknown degree to the stability in ID. To confirm the stability in the prevalence of ID it would be desirable to have additional measures of others iron indicators as percent tranferrin saturation, the soluble transferrin receptor (sTfr) or the ratio sTfr/log-ferr or hepcidin.40,41 Women beneficiaries of micronutrients fortified milk Liconsa had a lower probability to have IDA or IDNA which supports the stability in ID.
One of the fortitudes of this study is the use of three probabilistic surveys, using similar methodology for measuring consecutively the sferritin, the most specific test correlating with relative total body iron stores. If the increment of the prevalence of anemia were real, the supplementation programs have to resume, since in 2018 the federal programs Prospera and PAL to reduce poverty and malnutrition were erased from the public interventions.6,11,12 Also should be reenacted food and nutrition education programs based on dietary modifications, provision of ironfortified foods, targeted iron supplementation, and control of infections, adapted to the special needs of rural and indigenous populations, to comply with the OMS recommendation to reduce 50% the prevalence of anemia in 2025.11,12,44,45
In conclusion, the prevalence of iron deficiency remained stable or reduced; however, anemia has increased in 20-49 years of age women. The stability of ID suggests that a change in the prevalence of NIDA occurred probably because deficiencies of other micronutrients not measured in these surveys, or to byass introduced by the determinations of Hemocue.

