


 text new page (beta)
 English (pdf)
 Article in xml format
 Article references
 Send this article by e-mail
 Cited by SciELO
  Similars in
SciELO
Similars in
SciELO 
 Permalink
Introduction
More than two billion people worldwide are affected by one or more chronic deficiencies of essential micronutrients. The most widespread micronutrient deficiencies (MD) are iron, zinc, vitamin A, iodine, folate, and vitamin B12, and they often coexists within the same population. Young children and women of reproductive age living in low-income countries are the most vulnerable.1
Mexico, a middle-income country, is also experiencing this phenomenon, despite an important decline in MDs over the 1999-2012 period.2,3 Anemia showed a decline in prevalence from 1999 (when 31.6% of the children aged 1-4 years, and 15.2% of the children aged 5-11 were affected) to 2012 (23.3 and 10.1%, respectively);4 nonetheless, an increase was observed in 2016, reaching 26.9% of the children aged 1-4 years and 12.5% of the children aged 5-11.5
MDs have negative effects on child growth, development and immune system function. Iron deficiency (ID) causes negative effects on the sensory systems, learning, memory and behaviour. Insufficient vitamin B12 triggers neurologic consequences ranging from growth retardation to seizure disorders.6 Vitamin A deficiency increases the mortality risk associated with diarrhea and measles,3 promotes immune suppression, and is associated with childhood blindness.7 Anemia is associated with poor cognitive and neurologic function8 and is a major contributor to the estimated years lived with a disability in children and adolescents,9 with predicted long-term health and economic consequence.
The surveillance of child growth along with micronutrient status in high-risk populations is critical for implementing targeted public health interventions. The aim of this study is to describe the current status of micronutrient deficiencies frequently associated with anemia in Mexican children.
Materials and methods
The National Health and Nutrition Survey 2018-19 (in Spanish, Ensanut 2018-19) is a probabilistic survey representative at national level. Survey data were collected between July 2018 and February 2019. Information from serum samples was available for 30% of the total population. This subsample is representative at the national level and by dwelling type (urban or rural). Further details of the survey methodology are documented elsewhere.10
Blood samples
Venous blood samples were drawn from the antecubital vein directly into an evacuated tube, and spun down in situ at 3000g. Serum samples were stored in cryovials and frozen immediately into liquid nitrogen (-130°C) until delivery to the Biochemistry Nutrition Laboratory of the National Institute of Public Health (INSP, in Spanish) of Mexico, where they were stored in freezers at -70°C. The serum ferritin, vitamin B12 and C-reactive protein (CRP) were measured using ultrasensitive monoclonal antibodies in an Architect chemoluminescence microparticle immunoassay autoanalyzer (Architect 1200 Abbott Lab, Michigan, III USA). Serum retinol was measured in an HPLC (HP1110 LCDAD, Agilent Technology Waldbronn, Germany), using a 4 µm, 3.9 x 150 mm column (Waters, NovaPack C18) with a flux of 1.5 mL/min and a mobile phase of water-methanol after extraction with 99% ethanol. The quality control of the measurements was performed using the Reference Standard Serum NIST 968E of the National Institute of Standards and Technology. Intra- and inter-assay CVs for ferritin were 3.18 and 4%, 1.34 and 3.69% for vitamin A, 6.84 and 8.79% for vitamin B12, and 5.6 and 7.2% for CRP.
Hemoglobin concentration in capillary blood was measured with a portable photometer (HemoCue Hb 201+, Angelholm, Sweden) using the second drop of blood obtained after a middle finger puncture. Hb concentrations 18.5 g/dL were considered implausible and excluded from calculations.11
Definition of variables
The dwelling type was classified as urban for localities with ≥2 500 inhabitants, and rural for those with smaller populations. Mexico was divided into three geographic regions: North, Central and Mexico City, and South. A household wealth index (HWI), as a proxy of socioeconomic status, was generated based on the household characteristics and family assets using principal components analysis; the index was divided into tertiles to indicate low, medium and high HWI, with tertile one representing the poorest conditions. Indigenous ethnicity was considered if any indigenous language was spoken at home.
Children were categorized according to their status as beneficiaries of the social programs Prospera (cash transfers with a nutrition component)12 or Liconsa (distribution by a federal agency of low-cost milk fortified with iron, zinc and other critical vitamins).13 Supplement consumption was registered using a 7-day semiquantitative food frequency questionnaire (sFFQ).
Body weight and height measures were obtained by standardized methods.14,15 Body mass index (BMI) and stunting were calculated according to WHO criteria.16
Anemia was defined as hemoglobin concentration (Hb) adjusted by altitude17 of <110 g/L for children aged 1-4 y, or <115g/L for children aged 5-11 y.18
Iron deficiency (ID) was defined as levels of serum ferritin adjusted by CRP19 of <12 µg/L in children aged 1-4 y, and <15 µg/L in children aged 5-11 y.20 Vitamin A depletion (VADp) was defined as serum retinol levels ≤20µg/dL,21 and vitamin B12 deficiency (B12D) if B12<200 pcg/mL.22 The variable nutritional deficiencies (ND) was created as dichotomous, identifying children with any of the micronutrient deficiencies (ID, VADp or B12D). Iron deficiency anemia (IDA), vitamin B12 deficiency anemia (B12DA), VADp anemia (VADpA), and nutritional deficiency anemia (NDA) were defined if anemia coexisted with each respective deficiency.
Statistical analysis
Descriptive characteristics of the children are described as percentages (%) and confidence intervals (95%CI). A bivariate analysis of the characteristics by micronutrient deficiencies was performed through logit regression.
Logistic regression models were used to identify characteristics associated to MD and anemia, and were adjusted by: age, sex, region, dwelling type, BMI, CRP, stunting, supplement consumption and affiliation to Liconsa or Prospera in all children and by zinc deficiency (ZD) in pre-school-age-. All analyses were stratified by age group and considered the multistage stratified sampling design of the survey. Statistical significance was set at alpha=0.05 with a 95% confidence interval using the SVY module of the STATA SE v15 software* for complex samples.
Results
The descriptive characteristics of the participants are presented in table I. Seventy percent of children resided in urban areas, 33% in the South; approximately 40% were situated within the first tertile of HWI; 5.3% were beneficiaries to the social program Liconsa, and 3.1%, to Prospera. A low percentage of the children had CRP levels above 5mg/L (table I).
Table 1: Descriptive characteristics of Mexican children. Mexico, Ensanut 2018-19
|
Characteristic |
Pre-school-age children |
School-age children |
||||||
|
Expansion |
Expansion |
|||||||
|
n |
n (thousands) |
% |
95%CI |
n |
n (thousands) |
% |
95%CI |
|
|
Sex |
||||||||
|
Male |
703 |
4 127.1 |
51.5 |
(47.1-55.8) |
1 774 |
7 887.0 |
50.6 |
(47.8-53.3) |
|
Female |
679 |
3 892.9 |
48.5 |
(44.2-52.9) |
1 816 |
7 712.7 |
49.4 |
(46.7-52.2) |
|
Dwelling type |
||||||||
|
Rural |
578 |
2 333.0 |
29.1 |
(26.6-31.7) |
1 466 |
4 254.0 |
27.3 |
(25.0-29.6) |
|
Urban |
804 |
5 687.0 |
70.9 |
(68.3-73.4) |
2 124 |
11 345.7 |
72.7 |
(70.4-75.0) |
|
Geographic region |
||||||||
|
North |
199 |
1 543.7 |
19.2 |
(17.1-21.6) |
593 |
2 996.9 |
19.2 |
(17.6-21.0) |
|
Central and Mexico City |
500 |
3 762.0 |
46.9 |
(43.9-49.9) |
1 283 |
7 418.5 |
47.6 |
(45.0-50.1) |
|
South |
683 |
2 714.3 |
33.8 |
(31.2-36.6) |
1 714 |
5 184.4 |
33.2 |
(30.9-35.7) |
|
Tertile of household wealth index |
||||||||
|
Tertile 1 |
715 |
3 448.3 |
43 |
(39.3-46.8) |
1 720 |
6 357.9 |
40.8 |
(38.0-43.6) |
|
Tertile 2 |
442 |
2 815.6 |
35.1 |
(31.5-38.9) |
1 179 |
5 196.5 |
33.3 |
(30.7-36.1) |
|
Tertile 3 |
225 |
1 756.1 |
21.9 |
(18.5-25.7) |
688 |
4 035.4 |
25.9 |
(23.1-28.9) |
|
Indigenous (yes) |
53 |
196.3 |
4 |
(2.7-6.0) |
212 |
690.2 |
4.4 |
(3.2-6.0) |
|
Body mass index |
||||||||
|
Normal |
1 256 |
7 362.6 |
93.6 |
(91.5-95.2) |
2 284 |
9 598.3 |
62.7 |
(59.7-65.6) |
|
Overweight |
99 |
502.2 |
6.4 |
(4.8-8.5) |
703 |
2 997.1 |
19.6 |
(17.4-21.9) |
|
Obese |
543 |
2 710.0 |
17.7 |
(15.5-20.2) |
||||
|
Stunting (yes) |
190 |
1054.4 |
13.9 |
(11.0-17.5) |
237 |
941.1 |
6.3 |
(5.1-7.7) |
|
Beneficiary of Liconsa (yes) |
76 |
427.5 |
5.3 |
(3.8-7.5) |
213 |
832.0 |
5.3 |
(4.3-6.7) |
|
Beneficiary of Prospera (yes) |
67 |
246.9 |
3.1 |
(2.3-4.2) |
706 |
2 443.2 |
15.7 |
(13.9-17.7) |
|
C-reactive protein>5 mg/L (yes) |
124 |
673.8 |
10 |
(7.8-12.9) |
301 |
1 322.6 |
8.5 |
(7.0-10.3) |
|
Supplement consumption (yes) |
114 |
634.1 |
8.5 |
(6.4-11.3) |
225 |
812.2 |
5.4 |
(4.2-6.8) |
Anemia
Anemia was documented in 28.9% (95%CI 25.5-32.6) of the pre-school-age children and 19.2% (95%CI 17.3-21.2) of the school-age children. The bivariate analysis showed that children aged <2 years and those with ID had a greater prevalence of anemia than their counterparts (p<0.05) (table II, anemia). The school-age children, relatively younger children, and those with VADp had greater anemia than their counterparts. (table III, anemia).
Table II: Prevalence of anemia and micronutrient deficiencies among pre-school-age Mexican children, by descriptive characteristics. Mexico, Ensanut 2018-19
|
Anemia |
Iron deficiency |
Vit A depletion |
Vit B12 deficiency |
|||||||||
|
n |
1 380 |
1 157 |
1 315 |
1 204 |
||||||||
|
Expansion |
||||||||||||
|
n (thousands) |
% |
95%CI |
n (thousands) |
% |
95%CI |
n (thousands) |
% |
95%CI |
n (thousands) |
% |
95%CI |
|
|
Age (years) |
||||||||||||
|
1 |
491.1 |
39.2 |
(29.9-49.3) |
225.1 |
21.8 |
(12.9-34.4) |
80.5 |
6.9 |
(3.6-12.8) |
107.1 |
9.8 |
(6.3-15.0) |
|
2 |
682.6 |
36.3 |
(29.6-43.7) |
247.6 |
15.4 |
(8.3-26.7) |
96.1 |
5.6 |
(2.6-11.8) |
64.4 |
3.8 |
(1.8-8.1) |
|
3 |
669.4 |
29.8 |
(23.0-37.7) |
88.4 |
4.7 |
(2.5-8.7) |
129.4 |
5.9 |
(3.5-9.7) |
133.1 |
6.8 |
(4.2-10.8) |
|
4 |
470.9 |
17.9 |
(12.6-24.9) |
111 |
5.1 |
(2.5-9.8) |
48.1 |
2.0 |
(0.6-6.3) |
53.5 |
2.3 |
(1.1-4.7) |
|
1-4 y |
2 313.9 |
28.9 |
(25.5-32.6) |
672.1 |
10 |
(7.2-13.8) |
354.1 |
4.7 |
(3.3-6.7) |
358.2 |
5.1 |
(3.7-6.9) |
|
Sex |
||||||||||||
|
Male |
1 161.6 |
28.3 |
(23.7-33.3) |
372.1 |
11.3 |
(6.7-18.2) |
206.4 |
5.4 |
(3.4-8.5) |
207.9 |
6.2 |
(4.1-9.3) |
|
Female |
1 153.7 |
29.6 |
(24.6-35.2) |
300 |
8.8 |
(6.0-12.7) |
147.7 |
4 |
(2.3-6.9) |
150.3 |
4.1 |
(2.6-6.5) |
|
Dwelling type |
||||||||||||
|
Rural |
656.2 |
28.2 |
(23.1-33.9) |
112.3 |
5.7 |
(3.8-8.4) |
119.9 |
5.4 |
(3.2-8.9) |
174.2 |
8.7 |
(5.9-12.7) |
|
Urban |
1 659.1 |
29.2 |
(25.0-33.9) |
559.8 |
11.8 |
(8.0-17.1) |
234.2 |
4.5 |
(2.8-7.0) |
183.9 |
3.7 |
(2.3-5.8) |
|
Geographic region |
||||||||||||
|
North |
503.2 |
33 |
(24.9-42.1) |
152.6 |
11.5 |
(5.6-22.0) |
40.3 |
2.9 |
(1.1-7.6) |
30.3 |
2.2 |
(0.6-7.5) |
|
Central and Mexico City |
969.7 |
25.8 |
(20.7-31.7) |
305.1 |
9.7 |
(5.4-16.8) |
207.4 |
5.9 |
(3.5-9.8) |
104.3 |
3.2 |
(1.7-5.9) |
|
South |
842.5 |
31 |
(26.1-36.4) |
214.4 |
9.5 |
(6.2-14.3) |
106.3 |
4.2 |
(2.8-6.2) |
223.5 |
9.5 |
(6.6-13.6) |
|
Tertile of household wealth index |
||||||||||||
|
Tertile 1 |
1 037.9 |
30.1 |
(24.9-35.9) |
229.2 |
8 |
(5.3-11.9) |
163.3 |
5.1 |
(3.2-7.8) |
235.9 |
7.9 |
(5.5-11.2) |
|
Tertile 2 |
701.3 |
25.1 |
(19.9-31.1) |
268.2 |
11.1 |
(6.6-18.2) |
74.5 |
2.9 |
(1.3-6.1) |
102.8 |
4.1 |
(2.1-7.8) |
|
Tertile 3 |
576.1 |
32.8 |
(23.6-43.6) |
174.7 |
12.1 |
(6.2-22.2) |
116.3 |
7.1 |
(3.3-14.7) |
19.5 |
1.3 |
(0.3-5.4) |
|
Indigenous |
||||||||||||
|
No |
1 110.2 |
23.7 |
(19.2-29.0) |
179.3 |
4.6 |
(2.8-7.6) |
162 |
3.7 |
(2.2-6.2) |
131.8 |
3.2 |
(1.8-5.9) |
|
Yes |
31.4 |
16 |
(9.1-26.6) |
20.1 |
11.4 |
(2.8-36.2) |
15.5 |
8.1 |
(2.8-21.1) |
54.8 |
30 |
(15.9-49.2) |
|
Body mass index |
||||||||||||
|
Normal |
2 197.8 |
29.9 |
(26.2-33.8) |
633.2 |
10.1 |
(7.2-14.2) |
348.3 |
5.1 |
(3.6-7.2) |
315.1 |
4.9 |
(3.5-6.7) |
|
Overweight |
56.7 |
11.6 |
(5.8-21.9) |
35.6 |
9.7 |
(3.3-24.9) |
1 |
0.2 |
(0.0-1.6) |
34.6 |
8.3 |
(2.8-22.4) |
|
Stunting |
||||||||||||
|
No |
1879 |
29 |
(25.1-33.1) |
534.4 |
9.8 |
(7.1-13.5) |
294.6 |
4.9 |
(3.2-7.3) |
252 |
4.4 |
(3.0-6.4) |
|
Yes |
329 |
31.2 |
(22.1-42.1) |
127.1 |
13.2 |
(5.9-26.8) |
54.6 |
5.4 |
(2.6-10.7) |
95.4 |
9.8 |
(5.6-16.7) |
|
Beneficiary of Liconsa |
||||||||||||
|
No |
2 200.2 |
29.2 |
(25.6-33.0) |
661.5 |
10.4 |
(7.5-14.5) |
310 |
4.4 |
(3.0-6.4) |
346.3 |
5.2 |
(3.8-7.2) |
|
Yes |
114.0 |
26.7 |
(14.1-44.5) |
10.5 |
2.7 |
(1.1-6.8) |
43 |
10.6 |
(3.6-27.4) |
11.8 |
3 |
(0.6-13.6) |
|
Beneficiary of Prospera |
||||||||||||
|
No |
2 266.4 |
29.4 |
(25.8-33.1) |
657 |
10.1 |
(7.2-14.0) |
321.4 |
4.5 |
(3.1-6.5) |
325.3 |
4.8 |
(3.4-6.6) |
|
Yes |
40.6 |
16.4 |
(7.7-31.7) |
15.1 |
7.5 |
(2.0-24.1) |
31.6 |
12.9 |
(5.9-25.9) |
32.9 |
16.2 |
(7.2-32.4) |
|
C-reactive protein>5 mg/L |
||||||||||||
|
No |
1 736.5 |
28.8 |
(25.0-32.9) |
624.7 |
10.3 |
(7.3-14.5) |
182.6 |
3.3 |
(1.9-5.8) |
313.1 |
5.2 |
(3.7-7.2) |
|
Yes |
203.5 |
30.2 |
(17.4-47.1) |
47.4 |
7 |
(2.8-16.7) |
134.1 |
20.4 |
(12.9-30.9) |
34.2 |
5.1 |
(2.4-10.8) |
|
Anemia |
||||||||||||
|
No |
- |
- |
- |
362.2 |
7.6 |
(4.9-11.6) |
197 |
3.7 |
(2.4-5.9) |
222.3 |
4.5 |
(3.0-6.7) |
|
Yes |
- |
- |
- |
309.9 |
16 |
(10.8-23.0) |
157.1 |
7.2 |
(4.0-12.4) |
135.9 |
6.5 |
(4.1-10.0) |
|
Iron deficiency |
||||||||||||
|
No |
1 630.2 |
27 |
(23.1-31.3) |
- |
- |
- |
260.7 |
4.7 |
(3.3-6.8) |
271.4 |
4.5 |
(3.1-6.4) |
|
Yes |
309.9 |
46.1 |
(33.4-59.3) |
- |
- |
- |
56 |
8.5 |
(2.5-24.7) |
75.9 |
11.3 |
(5.7-21.2) |
|
Vitamin A depletion |
||||||||||||
|
No |
2 030.1 |
28.6 |
(25.1-32.5) |
604.3 |
10.3 |
(7.6-14.0) |
- |
- |
- |
288.7 |
4.7 |
(3.4-6.5) |
|
Yes |
157.1 |
44.4 |
(27.3-62.9) |
56 |
17.7 |
(5.0-46.5) |
- |
- |
- |
44.5 |
13.4 |
(6.3-26.1) |
|
Vitamin B12 deficiency |
||||||||||||
|
No |
1 962.0 |
29.4 |
(25.5-33.6) |
596.2 |
9.4 |
(6.5-13.4) |
287.6 |
4.7 |
(3.1-7.0) |
- |
- |
- |
|
Yes |
135.9 |
37.9 |
(25.3-52.5) |
75.9 |
21.8 |
(11.8-36.8) |
44.5 |
13.3 |
(6.7-24.8) |
- |
- |
- |
|
Supplement consumption |
||||||||||||
|
No |
1959 |
28.7 |
(25.3-32.5) |
582.7 |
10.2 |
(7.1-14.6) |
308.5 |
4.8 |
(3.3-7.0) |
307.5 |
5.1 |
(3.8-6.9) |
|
Yes |
172.4 |
27.2 |
(16.8-40.9) |
47.7 |
8.6 |
(3.6-19.3) |
26 |
5.1 |
(1.4-16.7) |
1 |
0.2 |
(0.0-1.3) |
In the adjusted model, overweight and relatively older age were both associated with lower odds for anemia in all children (p<0.05). In the pre-school-age children, ID was associated with higher odds for anemia (OR=1.8, p=0.056) while overweight was inversely associated (OR=0.37, p=0.053) (table III, pre-school-age children, anemia model). Among the school-age children, those from the Central and Mexico City region (OR=0.5, p<0.001), with overweight (OR=0.69, p=0.029) and obesity (OR=0.5, p=0.001) were associated with lower odds for anemia. Of all the children, those with VADp had two times greater odds for anemia than those without VADp (p=0.004) (table III, school-age children, anemia model).
Table III: Prevalence of anemia and micronutrient deficiencies among school-age Mexican children, by descriptive characteristics. Mexico, Ensanut 2018-19
|
Anemia |
Iron deficiency |
Vit A depletion |
Vit B12 deficiency |
|||||||||
|
n |
3 579 |
3 485 |
3 516 |
3 541 |
||||||||
|
Expansion |
||||||||||||
|
n (thousands) |
% |
95%CI |
n (thousands) |
% |
95%CI |
n (thousands) |
% |
95%CI |
n (thousands) |
% |
95%CI |
|
|
Age (years) |
||||||||||||
|
5 |
512.0 |
30 |
(24.1-36.7) |
110.7 |
6.6 |
(4.2-10.2) |
122.1 |
7.2 |
(3.9-13.0) |
58.9 |
3.5 |
(1.7-6.9) |
|
6 |
447.6 |
23.9 |
(18.5-30.2) |
97.1 |
5.3 |
(3.3-8.5) |
123.6 |
6.8 |
(4.2-10.9) |
60.8 |
3.3 |
(1.8-5.8) |
|
7 |
475.4 |
20.7 |
(15.8-26.7) |
104.7 |
4.6 |
(2.8-7.7) |
73.7 |
3.3 |
(1.9-5.7) |
62.2 |
2.7 |
(1.4-5.1) |
|
8 |
425.9 |
16.6 |
(13.0-21.1) |
100.9 |
4 |
(2.3-6.9) |
97.0 |
3.9 |
(2.4-6.2) |
85.5 |
3.4 |
(1.9-5.9) |
|
9 |
572.1 |
21.3 |
(16.0-27.8) |
109.6 |
4.2 |
(2.5-6.9) |
78.9 |
3 |
(1.7-5.3) |
135.2 |
5.1 |
(2.5-10.1) |
|
10 |
244.8 |
11.6 |
(8.0-16.6) |
81.9 |
4 |
(2.3-6.8) |
107.9 |
5.1 |
(2.1-12.0) |
126.0 |
6 |
(3.3-10.7) |
|
11 |
309.2 |
13.2 |
(9.4-18.2) |
174.2 |
7.5 |
(4.6-12.1) |
57.7 |
2.5 |
(1.3-4.8) |
218.1 |
9.3 |
(5.1-16.6) |
|
5-11 y |
2 986.9 |
19.2 |
(17.3-21.2) |
779.1 |
5.1 |
(4.2-6.1) |
660.9 |
4.3 |
(3.4-5.5) |
746.7 |
4.8 |
(3.7-6.3) |
|
Sex |
||||||||||||
|
Male |
1 389.4 |
17.6 |
(15.1-20.6) |
362.9 |
4.7 |
(3.5-6.1) |
355.9 |
4.6 |
(3.4-6.3) |
322.1 |
4.1 |
(3.0-5.6) |
|
Female |
1 599.3 |
20.8 |
(17.9-24.0) |
416.2 |
5.6 |
(4.3-7.2) |
305.0 |
4 |
(2.8-5.8) |
424.5 |
5.5 |
(3.7-8.3) |
|
Dwelling type |
||||||||||||
|
Rural |
938.2 |
22.1 |
(18.7-26.0) |
261.5 |
6.3 |
(4.9-8.2) |
232.3 |
5.6 |
(4.1-7.6) |
332.5 |
7.9 |
(5.9-10.6) |
|
Urban |
2 050.5 |
18.1 |
(15.9-20.6) |
517.5 |
4.6 |
(3.6-5.9) |
428.6 |
3.9 |
(2.8-5.4) |
414.2 |
3.7 |
(2.4-5.6) |
|
Geographic region |
||||||||||||
|
North |
708.7 |
23.8 |
(19.3-28.9) |
216.9 |
7.3 |
(4.9-11.0) |
125.6 |
4.3 |
(2.6-6.9) |
133.4 |
4.5 |
(2.6-7.6) |
|
Central and Mexico City |
1 095.4 |
14.8 |
(12.0-18.1) |
311.1 |
4.3 |
(3.2-5.6) |
338.3 |
4.7 |
(3.1-6.9) |
214.9 |
2.9 |
(1.6-5.4) |
|
South |
1 184.5 |
22.9 |
(20.1-25.9) |
251.0 |
5 |
(3.7-6.7) |
196.9 |
3.9 |
(2.9-5.3) |
398.4 |
7.8 |
(5.5-10.9) |
|
Tertile of household wealth index |
||||||||||||
|
Tertile 1 |
1 325.1 |
20.9 |
(17.9-24.2) |
311.3 |
5 |
(3.8-6.5) |
358.0 |
5.7 |
(4.1-8.0) |
487.5 |
7.7 |
(5.7-10.4) |
|
Tertile 2 |
970.6 |
18.7 |
(15.3-22.7) |
345.7 |
6.8 |
(5.0-9.3) |
176.3 |
3.5 |
(2.4-5.1) |
141.9 |
2.8 |
(1.6-4.6) |
|
Tertile 3 |
692.9 |
17.2 |
(13.4-21.7) |
122.0 |
3.1 |
(1.9-5.0) |
126.5 |
3.2 |
(1.8-5.8) |
117.2 |
2.9 |
(1.0-8.0) |
|
Indigenous ethnicity |
||||||||||||
|
No |
2 873.0 |
19.3 |
(17.4-21.4) |
745.4 |
5.1 |
(4.2-6.2) |
623.3 |
4.3 |
(3.3-5.5) |
547.6 |
3.7 |
(2.7-5.1) |
|
Yes |
113.9 |
16.5 |
(10.8-24.3) |
33.7 |
4.9 |
(2.4-9.7) |
37.5 |
5.5 |
(2.8-10.4) |
199.0 |
29 |
(17.8-43.6) |
|
Body mass index |
||||||||||||
|
Normal |
2 120.5 |
22.1 |
(19.4-25.0) |
536.0 |
5.7 |
(4.5-7.2) |
425.5 |
4.5 |
(3.5-5.9) |
526.6 |
5.5 |
(3.9-7.8) |
|
Overweight |
463.9 |
15.5 |
(12.3-19.2) |
170.6 |
5.8 |
(3.7-8.9) |
149.3 |
5.1 |
(2.7-9.6) |
136.3 |
4.6 |
(2.8-7.4) |
|
Obese |
301.7 |
11.2 |
(8.3-14.9) |
58.6 |
2.2 |
(1.3-3.7) |
38.4 |
1.4 |
(0.7-2.8) |
82.0 |
3.0 |
(1.5-6.2) |
|
Beneficiary of Liconsa |
||||||||||||
|
No |
2 834.6 |
19.3 |
(17.3-21.4) |
727.3 |
5.0 |
(4.1-6.1) |
626.3 |
4.3 |
(3.4-5.6) |
736.8 |
5 |
(3.8-6.6) |
|
Yes |
152.7 |
18.4 |
(11.4-28.3) |
47.8 |
5.9 |
(2.9-11.5) |
34.5 |
4.2 |
(1.5-11.1) |
9.8 |
1.2 |
(0.3-4.4) |
|
Beneficiary of Prospera |
||||||||||||
|
No |
2 528.8 |
19.3 |
(17.2-21.6) |
632.9 |
4.9 |
(4.0-6.1) |
563.6 |
4.4 |
(3.3-5.7) |
588.7 |
4.5 |
(3.2-6.3) |
|
Yes |
458.5 |
18.8 |
(14.7-23.7) |
142.2 |
6.0 |
(4.0-8.8) |
97.2 |
4.0 |
(2.3-6.9) |
158.0 |
6.5 |
(4.4-9.6) |
|
C-reactive protein>5 mg/L |
||||||||||||
|
No |
2 688.9 |
19 |
(17.0-21.2) |
727.4 |
5.2 |
(4.3-6.4) |
501.5 |
3.6 |
(2.7-4.8) |
700.8 |
5.0 |
(3.7-6.6) |
|
Yes |
269.4 |
20.4 |
(14.9-27.1) |
51.6 |
4.0 |
(2.1-7.3) |
145.9 |
11.2 |
(7.3-16.8) |
45.8 |
3.5 |
(1.6-7.6) |
|
Anemia |
||||||||||||
|
No |
- |
- |
- |
580.7 |
4.7 |
(3.8-5.8) |
442.5 |
3.6 |
(2.6-4.9) |
607.1 |
4.9 |
(3.5-6.7) |
|
Yes |
- |
- |
- |
195.1 |
6.7 |
(4.4-10.0) |
218.3 |
7.5 |
(5.2-10.6) |
137.8 |
4.7 |
(3.0-7.2) |
|
Iron deficiency |
||||||||||||
|
No |
2 737.7 |
18.9 |
(17.0-21.0) |
- |
- |
- |
607.1 |
4.3 |
(3.3-5.5) |
691.1 |
4.8 |
(3.6-6.4) |
|
Yes |
195.1 |
25.2 |
(17.0-35.6) |
- |
- |
- |
35.1 |
4.6 |
(2.2-9.3) |
48.4 |
6.2 |
(2.9-12.9) |
|
Vitamin A depletion |
||||||||||||
|
No |
2 706.6 |
18.6 |
(16.6-20.7) |
732.8 |
5.1 |
(4.2-6.2) |
- |
- |
- |
694.2 |
4.8 |
(3.6-6.4) |
|
Yes |
218.3 |
33 |
(23.2-44.6) |
35.1 |
5.5 |
(2.7-10.9) |
- |
- |
- |
36.1 |
5.5 |
(2.5-11.6) |
|
Vitamin B12 deficiency |
||||||||||||
|
No |
2 825.4 |
19.2 |
(17.2-21.3) |
730.6 |
5 |
(4.1-6.1) |
622.5 |
4.3 |
(3.3-5.5) |
- |
- |
- |
|
Yes |
137.8 |
18.5 |
(11.8-27.9) |
48.4 |
6.6 |
(3.0-13.6) |
36.1 |
4.9 |
(2.2-10.6) |
- |
- |
- |
|
Supplement consumption |
||||||||||||
|
No |
2776.1 |
19.4 |
(17.4-21.5) |
697.2 |
5 |
(4.1-6.0) |
612.3 |
4.3 |
(3.4-5.6) |
732.4 |
5.1 |
(3.9-6.8) |
|
Yes |
179.2 |
22.1 |
(14.2-32.6) |
20.1 |
2.5 |
(1.2-5.1) |
15.6 |
2 |
(0.7-5.5) |
10.3 |
1.3 |
(0.4-3.7) |
Iron deficiency
ID affected 10.0% (95%CI 7.2-13.8) of the pre-school-age children and 5.1% (95%CI 4.2-6.1) of the school-age children. The bivariate analysis showed that the highest prevalence of ID was found in the youngest children, from urban areas with anemia and B12D (table II, ID). Among the school-age children, a lower ID rate was observed in those with overweight and obesity and in those living in the Central and Mexico City region, compared to their counterparts (table III, ID).
In the adjusted model, the pre-school-age children residing in urban areas exhibited two times higher odds for ID (OR=2.2, p=0.011) than those from a rural dwelling, while relatively older age and affiliation with Liconsa represented a lower risk for ID (OR=0.5, p<0.001 and OR=0.23, p=0.042, respectively) (table III, pre-school-age children, ID model). Among the schoolage children, those from the Central and Mexico City region and those with obesity had lower odds for ID (OR= 0.58, p=0.052 and OR=0.4, p=0.005, respectively) than the children from the North and with a normal BMI (table IV, school-age children, ID model).
Table IV: Logistic regression models* of selected descriptive characteristics associated with anemia and micronutrient deficiencies in Mexican children. Mexico, Ensanut 2018-19
|
Anemia |
Iron deficiency |
Vitamin A depletion |
Vitamin B12 deficiency |
|||||
|
OR |
95%CI |
OR |
95%CI |
OR |
95%CI |
OR |
95%CI |
|
|
A. Pre-school-age children |
||||||||
|
Age (years) |
0.69 |
(0.56-0.86) |
0.53 |
(0.38-0.74) |
0.8 |
(0.47-1.35) |
0.66 |
(0.48-0.93) |
|
Sex (female) |
1.31 |
(0.86-2.01) |
0.79 |
(0.41-1.53) |
0.8 |
(0.31-2.01) |
0.89 |
(0.43-1.83) |
|
Dwelling type (urban) |
0.95 |
(0.63-1.42) |
2.29 |
(1.21-4.31) |
0.75 |
(0.33-1.71) |
0.63 |
(0.31-1.27) |
|
Household wealth index (reference: tertile 1) |
||||||||
|
T2 |
0.78 |
(0.45-1.34) |
1.15 |
(0.46-2.87) |
0.73 |
(0.23-2.35) |
0.79 |
(0.33-1.89) |
|
T3 |
0.93 |
(0.49-1.75) |
1.72 |
(0.62-4.77) |
2.35 |
(0.64-8.64) |
0.08 |
(0.02-0.33) |
|
Geographic region (reference: North) |
||||||||
|
Central and Mexico City |
0.64 |
(0.34-1.2) |
0.79 |
(0.28-2.22) |
1.88 |
(0.44-8.1) |
2.5 |
(0.58-10.74) |
|
South |
0.72 |
(0.38-1.37) |
0.82 |
(0.28-2.41) |
0.9 |
(0.23-3.61) |
6.02 |
(1.68-21.57) |
|
C-reactive protein (>5 mg/L) |
0.69 |
(0.37-1.27) |
0.45 |
(0.1-2.01) |
9.1 |
(4.01-20.65) |
0.49 |
(0.21-1.1) |
|
Iron deficiency (yes) |
1.83 |
(0.98-3.42) |
- |
2.18 |
(0.76-6.26) |
1.76 |
(0.72-4.34) |
|
|
Vitamin A depletion (yes) |
1.86 |
(0.72-4.86) |
1.97 |
(0.43-9) |
- |
5.3 |
(2.22-12.63) |
|
|
Vitamin B12 deficiency (yes) |
1.53 |
(0.83-2.82) |
1.99 |
(0.79-5.02) |
5.05 |
(1.85-13.78) |
- |
|
|
Zinc deficiency (yes) |
- |
- |
3.37 |
(1.11-10.18) |
- |
|||
|
Body mass index (reference: normal) |
||||||||
|
Overweight |
0.37 |
(0.14-1.01) |
0.62 |
(0.19-2.03) |
n/a |
2.56 |
(0.76-8.63) |
|
|
Stunted |
1.22 |
(0.65-2.28) |
1.42 |
(0.58-3.51) |
0.54 |
(0.16-1.86) |
0.63 |
(0.13-3.02) |
|
Liconsa beneficiary (yes) |
1.29 |
(0.45-3.7) |
0.23 |
(0.05-0.95) |
4.14 |
(0.88-19.44) |
3.59 |
(1.26-10.23) |
|
Prospera beneficiary (yes) |
0.48 |
(0.16-1.45) |
1.16 |
(0.25-5.43) |
2.84 |
(0.68-11.85) |
1.89 |
(0.99-3.6) |
|
Supplement consumption (yes) |
1.1 |
(0.53-2.28) |
1.16 |
(0.38-3.56) |
1.03 |
(0.3-3.5) |
0.04 |
(0-0.28) |
|
Intercept |
1.33 |
(0.56-3.15) |
0.34 |
(0.11-1.05) |
0.04 |
(0.01-0.15) |
0.06 |
(0.01-0.25) |
|
*Adjusted for survey design, n: 975, N (thousands): 5 470.755 |
||||||||
|
B. School-age children |
||||||||
|
Age (years) |
0.87 |
(0.81-0.94) |
1.01 |
(0.9-1.15) |
0.89 |
(0.76-1.03) |
1.28 |
(1.09-1.51) |
|
Sex (female) |
1.12 |
(0.83-1.51) |
1.06 |
(0.68-1.66) |
0.89 |
(0.5-1.58) |
1.4 |
(0.8-2.47) |
|
Dwelling type (urban) |
0.86 |
(0.63-1.16) |
0.66 |
(0.43-1.03) |
0.87 |
(0.48-1.57) |
0.75 |
(0.41-1.38) |
|
Household wealth index (reference: tertile 1) |
||||||||
|
T2 |
1 |
(0.68-1.47) |
1.61 |
(0.95-2.74) |
0.51 |
(0.25-1.05) |
0.45 |
(0.24-0.85) |
|
T3 |
1.01 |
(0.65-1.57) |
0.71 |
(0.37-1.35) |
0.53 |
(0.2-1.37) |
0.47 |
(0.16-1.41) |
|
Geographic region (reference: North) |
||||||||
|
Central and Mexico City |
0.5 |
(0.34-0.73) |
0.58 |
(0.34-1.01) |
0.91 |
(0.44-1.86) |
0.63 |
(0.25-1.61) |
|
South |
0.85 |
(0.6-1.21) |
0.63 |
(0.36-1.12) |
0.65 |
(0.35-1.2) |
1.24 |
(0.58-2.66) |
|
C-reactive protein (>5 mg/L) |
1.21 |
(0.8-1.84) |
0.98 |
(0.48-1.98) |
4.08 |
(2.24-7.45) |
0.7 |
(0.28-1.77) |
|
Iron deficiency (yes) |
1.42 |
(0.83-2.45) |
- |
1.18 |
(0.54-2.61) |
1.24 |
(0.48-3.18) |
|
|
Vitamin A depletion (yes) |
2.17 |
(1.27-3.71) |
1.19 |
(0.54-2.64) |
- |
1.24 |
(0.52-2.97) |
|
|
Vitamin B12 deficiency (yes) |
0.9 |
(0.51-1.59) |
1.24 |
(0.5-3.05) |
1.27 |
(0.53-3.06) |
- |
|
|
Body mass index (reference: normal) |
||||||||
|
Overweight |
0.69 |
(0.49-0.96) |
1.01 |
(0.6-1.69) |
1.3 |
(0.64-2.65) |
0.79 |
(0.41-1.54) |
|
Obese |
0.5 |
(0.34-0.75) |
0.4 |
(0.21-0.76) |
0.31 |
(0.14-0.69) |
0.6 |
(0.25-1.42) |
|
Liconsa beneficiary (yes) |
1.11 |
(0.61-2.01) |
1.34 |
(0.59-3.04) |
1.07 |
(0.39-2.97) |
0.28 |
(0.07-1.16) |
|
Prospera beneficiary (yes) |
0.98 |
(0.69-1.39) |
1.12 |
(0.66-1.9) |
0.79 |
(0.43-1.43) |
0.92 |
(0.53-1.6) |
|
Supplement consumption (yes) |
1.16 |
(0.58-2.32) |
0.55 |
(0.25-1.19) |
0.34 |
(0.08-1.4) |
0.28 |
(0.09-0.88) |
|
Intercept |
1.16 |
(0.57-2.34) |
0.08 |
(0.03-0.27) |
0.2 |
(0.05-0.82) |
0.01 |
(0-0.09) |
* Adjusted for survey design, n: 3 288, N (thousands): 14 344.109
Vitamin A depletion
VADp prevalence was similar in both age groups. VADp was present in 4.7% (95%CI 3.4-5.5) of the preschool-age children and 4.3% (95%CI 3.4-5.5) of the school-age children. VADp was lower in the relatively younger children and those who were overweight, and higher in those with CRP>5 mg/L (p<0.05) (tables II and III, VADp). Among the pre-schoolers, VADp was higher in children with B12D and beneficiaries of Prospera (table II, VADp), while among the school-age children VADp was higher in those with anemia (table III, VADp).
In the adjusted model, the pre-school-age children with B12D (OR=5.05, p=0.002) or ZD (OR=3.37, p=0.032) and those with higher CRP levels (OR=9.1, p<0.001) were associated with greater odds of VADp (table IV, pre-school-age children, model ID). In the school-age children, higher CRP levels (OR=4.08, p<0.001) were also associated with higher odds of VADp, and obesity, with lower odds (OR=0.31, p=0.004) (table IV, school-age children, VADp model).
Vitamin B12 deficiency
The prevalence of B12D was 5.1% (95%CI 3.7-6.9) in the pre-school-age children and 4.8% (95%CI 3.7-6.3) in school-age children. Among the pre-school-age children, a higher prevalence of B12D was observed in those of indigenous ethnicity, with stunting, residing in the South, affiliated to Prospera, with ID, and with VADp (table II, B12D). Among the school-age children, indigenous children showed a larger prevalence of B12D than their non-indigenous counterparts (table III, B12D). A lower prevalence was observed among relatively older children, those residing in urban areas and those who consumed supplements.
In the adjusted model, relatively older age (OR=0.66, p=0.016), belonging within the third HWI tertile (OR=0.08, p<0.001), and supplement consumption (OR=0.04, p=0.002) were conditions associated to lower odds of B12D in pre-school-age children. In contrast, residing in the South (OR=6.02, p=0.006), having VADp (OR=5.3, p<0.001) and being a beneficiary of Liconsa (p=0.017) or Prospera (p=0.053) were associated with higher odds of B12D. Among the school-age children, older age (OR=1.28, p=0.003) was associated to higher odds of B12D; while the consumption of supplements (OR=0.28, p=0.029), and belonging within the second tertile of HWI (OR=0.45 p=0.013) were associated with lower odds of B12D.
Nutritional deficiencies associated to anemia
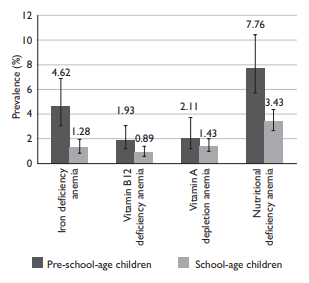
Figure 1 describes the NDs frequently associated to anemia. A lower prevalence of IDA, B12DA, VADpA and NDA was observed in school-age children than in pre-school-age children. NDs contributed to 7.76% and 4.36% of all cases of anemia in pre-school-age and school-age children, respectively (figure 1).
In a separate model for anemia, a ND (ID, B12D, or VADp) was present in 18.5% of the pre-school-age children (95%CI 14.9-22.7) and was associated to higher odds of anemia (OR=1.73, [95%CI 1.08-2.78], p=0.034), unlike in children without any ND. NDs occurred in 13.0% of the school-age children (95%CI 11.7-15.6), and their association with anemia was similar and statistically significant (OR=1.49, [95%CI 1.05-2.12], p=0.025) (data not shown).
Micronutrient deficiency in Mexican children
Specific data on ZD and vitamin D deficiency (VDD) VDD will be presented in two separate articles.23,24 Considering all serum data on vitamin and mineral nutritional status studied in Ensanut-2018-19 (ID, B12D, VADp, VDD), for all the children and ZD available only for pre-school-age children), 34% (95%CI 29.3-38.9) of pre-school-age children and 27.9% (95%CI 25.2-30.7) of school-age children in Mexico had at least one micronutrient deficiency (data not shown).
Discussion
The nutritional deficiencies frequently considered causes of anemia have shown a substantial reduction among Mexican children. In contrast, anemia itself has increased over the last period (from 2012 to 2018- 19), affecting relatively younger children in a larger proportion.
One third of pre-school-age children are affected by at least one MD (ID, B12D, VADp, VDD, and ZD) in Mexico. MDs (ID, B12D, VADp, and VDD) affected one quarter of school-age children. The MDs studied in the present survey are relevant to public health because they support optimal child growth, development, immune system function and cognitive performance; therefore, any aggression such as an MD on the first 1000 days of life will have negative impacts in the future that may be irreversible if the MD is not treated.25,26
Anemia
Anemia affected a great proportion of Mexican children and was more frequent in pre-school-age than in schoolage children. Among the potential causes of anemia, the NDs explained less than 10% of all anemia cases. This finding was unexpected, considering that NDs affect children more frequently than adults, in whom other causes are the main contributors to anemia (i.e., chronic disease, renal insufficiency, alcohol consumption, etc.).27 ID and VADp were conditions strongly associated with anemia due to their key role in erythropoiesis,28 while overweight and obesity were associated with a lower risk -an unexpected result. As reported in the literature, obesity is considered a risk factor for anemia, because it is marked by long-term low-grade inflammation, which affects iron export and availability for erythropoiesis.29
The high prevalence of anemia reported herein may be due to Hb measurement error, since neither ID nor NDs explain this increase. Residual confounding in the determination of NDs may hide a possible contribution to anemia. Other potential causes of anemia (i.e., parasites) were not analysed in the present study.
Iron deficiency
Currently, ID affects 1 in 10 pre-school-age children. Over the last 12 years, ID diminished 16.6 pp and 7.9 pp in pre-school-age and school-age children, respectively, as measured using the same survey methodology. The largest decrease in ID, of approximately 20pp, occurred in the 1999-2006 period; nevertheless, comparability is limited because a different iron indicator was used to define ID in 1999. ID mostly affected younger children. In early childhood, ID has negative consequences later in life, including poor cognitive development, lower productivity, and higher risk of infection;6 therefore, interventions to prevent ID should focus on the first 1 000 days of life.25
ID is reaching households in more densely populated areas. In school-age children, obesity was associated with lower ID and anemia, which may be due to their greater energy intake from products with a higher iron content than that of children with a normal BMI. This result is consistent with previous data on Mexican children,5 but is contrary to the expected behaviour of iron metabolism in overweight conditions.30
Vitamin B12
Prevalence of B12D was not different between pre-school-age and school-age children. When compared to the trend reported in 1999, a substantial decrease of 25 pp in B12D has occurred in the population. Despite this reduction, higher B12D was found in children from rural areas, from the South, from the lowest tertile of HWI, indigenous children and with ID or VADp. This profile of characteristics corresponds to children living in vulnerable socioeconomic conditions, where the aetiology of B12D is attributed to a lack of consumption of animal-based vitamin B12 food sources like eggs, dairy products and red meat, rather than to malabsorption syndromes or genetic immune diseases. Even though a low proportion of children were consuming supplements, supplement consumption was associated to lower risk for B12D, reinforcing the hypothesis of a lack of vitamin B12 due to insufficient dietary intake. In this study, 30% of children were in a non-fasting state, which may have resulted in the underestimation of their B12D status.
Vitamin A
VADp was low in Mexican children. In all children, inflammation was associated with higher odds for VADp. Low serum retinol may be the result of a lack of dietary intake of animal-based food products, inflammatory or infection processes, or ZD. In the presence of high CRP levels, VADp prevalence may be overestimated because serum retinol diminishes in concentration by 25-69% during infection.31 A separate analysis was conducted adjusting the prevalence of VADp for CRP, and the resulting adjusted prevalence of VADp (5.1% 95%CI 7.6-15.1) was not different from the unadjusted prevalence reported (4.7%) using a regression correction approach (data not shown). Characteristics like being overweight or obese were associated to a lower prevalence of VADp in comparison to children with a normal BMI. As has been previously documented, the homeostasis of vitamin A affects and is affected by the excess of body fat.32
In the pre-school-age children, VADp data were adjusted by zinc status, revealing that ZD (10.8%) was strongly associated with the condition of VADp. Recent evidence shows that ZD interferes negatively with vitamin A metabolism; nevertheless, the exact mechanism has not yet been elucidated.33
The notable reduction in VADp by 17pp over the last 19 years in Mexican children may be partially attributed to a supplementation program in which Mexican newborns were supplied prophylactic megadoses of vitamin A as recommended by the WHO,34 as well as to fortified food consumption.
Strengths and limitations
This study has several strengths and limitations. The data analysed is representative of all Mexican children, and the same methodology for biochemical determinations has been used since 2006, which allows data comparability. One limitation is that, due to the cross-sectional design, reverse causality may explain the association between the reported variables. Second, the increase in the anemia prevalence may be attributable to Hb measurement error among surveys, rather than to MDs. Finally, dietary information was not studied in the present analysis; further analysis may help elucidate the role of diet and weaning practices in the onset of NDs and anemia.
The results of the present study have implications for public health. MDs and anemia are preventable; therefore, improving social and economic conditions will allow better access to a variety of foods in early childhood such as seeds and grains, meat, poultry, and fish, which are important food sources of bioavailable micronutrients. Second, breastfeeding should be promoted throughout the first two years of life so as to reduce the risk of MDs.35 Third, multiple micronutrient supplements should be administered to children in conditions of poverty in order to assure optimal growth. The decreasing trend in MD prevalences may be partially explained by the coverage of such social programs as Prospera and Liconsa, whose food products were designed to focus on addressing deficiencies in children at higher risk living in poor conditions.12,13 However, since 2018, the program in charge of distributing fortified supplements has disappeared: therefore, strategies like micronutrient supplementation and food fortification should be reinforced in populations at higher risk of undernutrition. New targeted food policies are necessary in order to tackle NDs and obesity more effectively in Mexican children.
In conclusion, MDs and anemia affect the younger children in a larger proportion. These MDs are associated with poor child development and negative health effects in later life. Fortification and supplementation programs should be reinforced in order to support proper child growth and development.

