


 text new page (beta)
 English (pdf)
 Article in xml format
 Article references
 Send this article by e-mail
 Cited by SciELO
  Similars in
SciELO
Similars in
SciELO 
 Permalink
1 Introduction
The ternary chalcogenide compounds of the ABQ2 family are known as semiconductors of great interest in the field of electro-optic, and non linear optical applications. During the last decades, these compounds have been extensively studied experimentally because of their industrial interest. Most ABGa2 compounds crystallize in the KInS2 structure C2/c and the ternary potassium compounds, generally, crystallize in the triclinic or in the monoclinic system. Synthesis and XRD characterization of the ternary chalcogenides of aluminum and gallium KMQ2 (M=Al, Ga and Q = Se, Te) have been performed firstly by Kim and Hughbanks [1]. Later, the single-crystal structures of the ternary gallium selenide KGaSe2, of the potassium gallium sulfide KGaS2 and of the caesium gallium ditelluride CsGaTe2 were synthesized and determined [2-5]. The optical band gaps of KGaS2 and KGaSe2 were experimentally given by Friedrich et al., [6].
In the present work, we explore the theoretical study results of structural and electronic properties of KGaQ2 (Q = S, Se) and of AGaTe2 (A = K, Cs) crystals using first principles calculation. We have also predicted the refractive index, high frequency dielectric constant and reflection coefficient of these materials.
The paper gives a brief description of the computational technique in Sec. 2. Then the results are presented and discussed in Sec. 3. Finally, a conclusion is given in Sec. 4.
2 Computational details
The ab initio calculations were performed using the density functional theory (DFT) based on the pseudo-potential plane wave (PP-PW) method as implemented in the CASTEP code (Cambridge Serial Total Energy Package) [7]. The generalized gradient approximation (GGA) applying Perdew-Burke- Ernzerhof (PBE) [8] as exchange-correlation functional was used. Interactions of the valence electrons
The optimized structural parameters, the lattice constants and the angle β, were determined using the method of structural optimization based on minimization technique of Broyden-Fletcher-Goldfarb-Shanno (BFGS) [10]. After a convergence test, a Monkhorst-Pack mesh [11] of 4×4×2 for the k points and a plane-wave basis set cutoff of 350 eV were sufficient to ensure a good total energy convergence of 5×10⁻⁶ eV/atom. The unit-cell was relaxed until the maximum ionic Hellmann-Feynman force was smaller than 0.01 eV/Å-1, within maximum stress of 0.02 GPa and a maximum atomic displacement of 5×10⁻⁴ Å.
The electronic band structure and associated density of states are calculated with GGA-PBE formalism and moreover the hybrid functional HSE06 was used in order to improves the band gap [12]. The refractive index n, high frequency dielectric constant ϵ, reflection coefficient R for KGaQ2 (Q=S, Se) and AGaTe2 (A=K, Cs) have been calculated using three different models. Ravindra [13], Moss [14] and Herve and Vandamme [5]. These models are related directly with energy gap in semiconductors.
3 Results and discussion
3.1 Structural properties
Single crystal X-ray diffraction analysis revealed that the ternary compounds AGaQ2 (A=K, Cs; Q=S, Se, Te) [1,2,4,5] crystallize in space group C2/c (No. 15) of the monoclinic system and adopt the TiGaSe2 structure type with sixteen formula units per unit-cell (Z=16) as illustrated in Fig. 1. The studied compounds have a layered structure with fundamental building blocks of [Ga4Q10] supertetrahedra. These supertetrahedra form two dimensional (2D) [GaQ2]— anionic layers which are separated by K+ or Cs+ cations. The conventional cell of AGaQ2 (A=K, Cs; Q=S, Se, Te) contains 9 atoms, 2K, 2A and 5Q, the atomic positions and the structural data are given in Tables I, II.
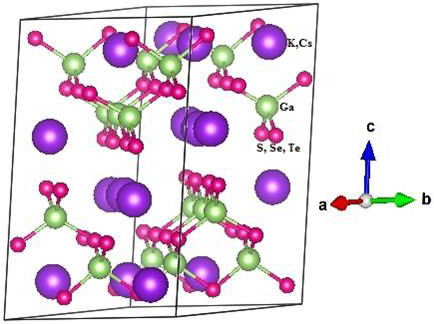
Figure 1 Schematic diagram of the monoclinic unit-cell of AGaQ2 (A=K,Cs; Q=S, Se, Te) with 16 formula.
Table I Calculated structural parameters of KGaQ2 (Q = S, Se) and AGaTe2 (A = K, Cs): lattice parameters a (Å), b (Å) and c (Å), angle β (degree) and unit-cell volume V (A3).
| System | a | b | c | V | ||
|---|---|---|---|---|---|---|
| KGaS2 | 10.602 | 10.594 | 14.8SS | 100.358 | 1644.893 | |
| Exp [4] | 10.577 | 10.573 | 15.023 | 100.151 | 1653.771 | |
| KGaSe2 | 11.110 | 11.089 | 15.732 | 99.755 | 1910.268 | |
| Exp [2] | 10.878(2) | 10.872(2) | 15.380(3) | 100.183 | 1790.360 | |
| KGaTe2 | 11.982 | 11.978 | 16.848 | 100.348 | 2378.632 | |
| Exp [1] | 11.768(3) | 11.775(3) | 16.503(4) | 100.362 | 2249.590 | |
| CsGaTe2 | 12.137 | 12.101 | 18.311 | 99.507 | 2652.416 | |
| Exp [5] | 11.811 | 11.811 | 17.862 | 99.443 | 2457.300 |
Table II Calculated (Cal) and experimental (Exp) atomic positions (x,y,z) for KGaQ2 (Q=S, Se) and AGaTe2(A=K, Cs).
| Atoms | wyck | x | y | z | |||
|---|---|---|---|---|---|---|---|
| KGaS2 | Cal | Exp [4] | Cal | Exp [4] | Cal | Exp [4] | |
| Kl | 8f | 0.284417 | 0.284717 | 0.061594 | 0.061751 | 0388629 | 0388988 |
| K2 | 8f | 0.463521 | 0.463088 | 0.311280 | 0311380 | 0.110287 | 0.108864 |
| Ga1 | 8f | 0.145129 | 0.146065 | 0.435635 | 0.436391 | 0337673 | 0336724 |
| Ga2 | 8f | 0.101458 | 0.100663 | 0.188576 | 0.188546 | 0.163054 | 0.163673 |
| S1 | 8f | 0254787 | 0.256221 | 0.311824 | 0.311729 | 0.250901 | 0.250554 |
| S2 | 8f | 0206513 | 0.204484 | 0.064338 | 0.063389 | 0.070574 | 0.072284 |
| S3 | 8f | 0.046135 | 0.046462 | 0.311368 | 0311495 | 0.432816 | 0.431304 |
| S4 | 4e | 0.0 | 0.0 | 0.566959 | 0.568034 | 0.25 | 055 |
| S5 | 4e | 0.0 | 0.0 | 0.056140 | 0.056786 | 0.25 | 055 |
| KGaSe2, | Cal | Exp [2] | Cal | Exp [2] | Cal | Exp [2] | |
| Kl | 8f | 0286104 | 0.28401(17) | 0.063250 | 0.06195(17) | 0385628 | 038710(13) |
| K2 | 8f | 0.466100 | 0.46453(19) | 0.317229 | 031320(19) | 0.107169 | 0.10870(14) |
| Gal | 8f | 0.142314 | 0.14545(8) | 0.436018 | 0.43601(8) | 0335555 | 033748(6) |
| Ga2 | 8f | 0.105524 | 0.10178(8) | 0.188131 | 0.18898(8) | 0.164567 | 0.16239(6) |
| Se 1 | 8f | 0.258906 | 0.25913(7) | 0.314497 | 031229(9) | 0.249931 | 0.25004(5) |
| Se 2 | 8f | 0.203527 | 0.20432(8) | 0.055918 | 0.06225(9) | 0.070142 | 0.06747(6) |
| Se 3 | 8f | 0.037505 | 0.04626(9) | 0.315025 | 031289(9) | 0.430581 | 0.43495(6) |
| Se 4 | 4e | 0.0 | 0.0 | 0.573591 | 0.57185(11) | 025 | 0.25 |
| Se 5 | 4e | 0.0 | 0.0 | 0.055585 | 0.05366(12) | 025 | 0.25 |
| KGaTe2 | Cal | Exp [1] | Cal | Exp [1] | Cal | Exp [1] | |
| K1 | 8f | 0.465598 | 0.464(1) | 0.314827 | 0.316(2) | 0.107110 | 0.1092(9) |
| K2 | 8f | 0.283600 | 0.284(1) | 0.060953 | 0.060(2) | 0380425 | 0386(1) |
| Gal | 8f | 0.601638 | 0.6026(5) | 0.688237 | 0.6879(6) | 0.162532 | 0.1620(4) |
| Ga2 | 8f | 0.145501 | 0.1462(5) | 0.435755 | 0.4372(6) | 0336585 | 03373(4) |
| Te1 | 8f | 0.045791 | 0.0457(4) | 0.314243 | 03127(4) | 0.436355 | 0.4354(3) |
| Te2 | 8f | 0.200804 | 0.2034(4) | 0.058205 | 0.0624(4) | 0.066627 | 0.0649(2) |
| Te3 | 8f | 0.262214 | 0.242(5) | 0.311769 | 03128(3) | 0.24982 | 0.248(3) |
| Te4 | 4e | 0.0 | 0.0 | 0.575003 | 0566(2) | OJ25 | 0.25 |
| Te5 | 4e | 0.0 | 0.0 | 0.050338 | 0.059(1) | 0.25 | 0.25 |
| CsGaTe2 | Cal | Exp [5] | Cal | Exp [5] | Cal | Exp [5] | |
| Cs1 | 8f | 0.285414 | 0.2871(4) | 0.062498 | 0.0629(4) | 0391777 | 03961(3) |
| Cs2 | 8f | 0.462188 | 0.4628(4) | 0.312741 | 03123(4) | 0.098804 | 0.1000(3) |
| Ga1 | 8f | 0.104673 | 0.1051(5) | 0.188083 | 0.1874(5) | 0.171692 | 0.1709(4) |
| Ga2 | 8f | 0.143286 | 0.1442(5) | 0.436663 | 0.4377(5) | 0328145 | 0.3291(4) |
| Te 1 | 8f | 0.041814 | 0.0426(4) | 0.312735 | 0.3124(4) | 0.419201 | 0.4186(3) |
| Te 2 | 8f | 0.208461 | 0.2081(4) | 0.062351 | 0.0626(4) | 0.081616 | 0.0803(3) |
| Te 3 | 8f | 0261434 | 0.2600(3) | 0.312365 | 0.3119(5) | 0.250110 | 02501(2) |
| Te 4 | 4e | 0.0 | 0.0 | 0574692 | 05734(5) | 0.25 | 0.25 |
| Te 5 | 4e | 0.0 | 0.0 | 0.050311 | 0.0528(6) | 0.25 | 0.25 |
By fully geometry optimization, the calculated equilibrium structural parameters of the studied compounds are summarized in Table I and compared with the available experimental data [1,2,4,5]. The results show that the lattice parameters (a,b,c), angle β, and unit cell equilibrium volume V are in good agreement with the experimental values; the maximum relative error of the calculated equilibrium lattice constants a, b, and c is about 0.24% (2.14%), 0.16% (1.99%) and 0.9% (2.29%) for KGaS2 (KGaSe2), respectively, and, about 1.82% (2.77%), 1.72% (2.46%) and 2.09% (2.52%) for KGaTe2 (CsGaTe2) respectively compared with the respective reported data. There is a slight overestimation of the calculated lattice constants relative to the experimental values. This is not surprising, it is due to the use of the GGA-PBE approximation. The relative deviation of the calculated angle β and unit cell equilibrium volume V deviate by 0.21% (0.42%) and 0.54% (6.7%) for KGaS2 (KGaSe2), and by 0.01% (0.07%) and 5.74% (7.94%) for KGaTe2 (CsGaTe2), respectively, are compared with the experimental data.
It can be seen that the unit cell volume increases from KGaS2, KGaSe2 to KGaTe2, which is assigned to the increasing of the atomic radius from S, Se to Te respectively.
Also, CsGaTe2 unit cell volume is larger than that of KGaTe2, which is also assigned to the small atomic radius of K compared to that of Cs. The calculated atomic positions, listed in Table II, agree well with the experimental data.
3.2 Electronic properties
It is known that GGA-PBE overestimates the band gap of low band gap materials and underestimates the one of high band gap materials [16]. Nevertheless, GGA functionals are known to underestimate Kohn-Sham band gaps (compared to experimentally determined values), whereas the Hartree-Fock (HF) method overestimates them [17]. Therefore, hybrid functionals were introduced by Becke [18] which describe exchange using a combination of the exact nonlocal Hartree-Fock-exchange interaction with GGA. But the computational evaluation became difficult due of the slowly decaying Fock exchange with distance [19]. Heyd et al., suggested an hybrid-functional scheme for extended systems [19,20], giving rise to the Heyd-Scuseria-Ernzerhof (HSE) functional by substituting the exchange energy in the conventional GGA-PBE functional [8] by a functional which mixes HF exchange energy and PBE, the spatial decay of the HF exchange interaction is accelerated by substitution of the full 1/r Coulomb potential with a screened one, the exchange energy term is split into short-range (SR) and long-range (LR) components and the long-range exchange energy is given only by the PBE term, and the correlation energy comes entirely from PBE.
where w is the parameter which determines the screening, defining the range of the Hartree-Fock correction [19]. This is handled by decomposing the Coulomb kernel into a short-range and a long-range term [21], according to:
in which erf and erfc are, respectively, the error and the complementary error function. Choosing w = 0.3Å-1 leads to the HSE03 functional, whereas w = 0.2Å-1 leads to the HSE06 functional [20,22].
In general, the GGA-PBE functional method does not produce the exact value for the band gap; it underestimates the band gap value [25] while the nonlocal hybrid functional method developed by Heyd, Scuseria, and Enzerhof (HSE06) gives better estimation of electronic properties of solids. This method yields a band gap comparable with the experimental one by including the exact contribution of the Hartree-Fock exchange [21-24,26], the HSE06 functional hybrid density replaces the slowly decomposing long-range part of the exchange Fock by the density functional counterpart. For this reason, to better estimate the electronic bandgap value, we have also used HSE06 in addition of GGA-PBE for comparison.
The band structures calculated along the high symmetry directions:
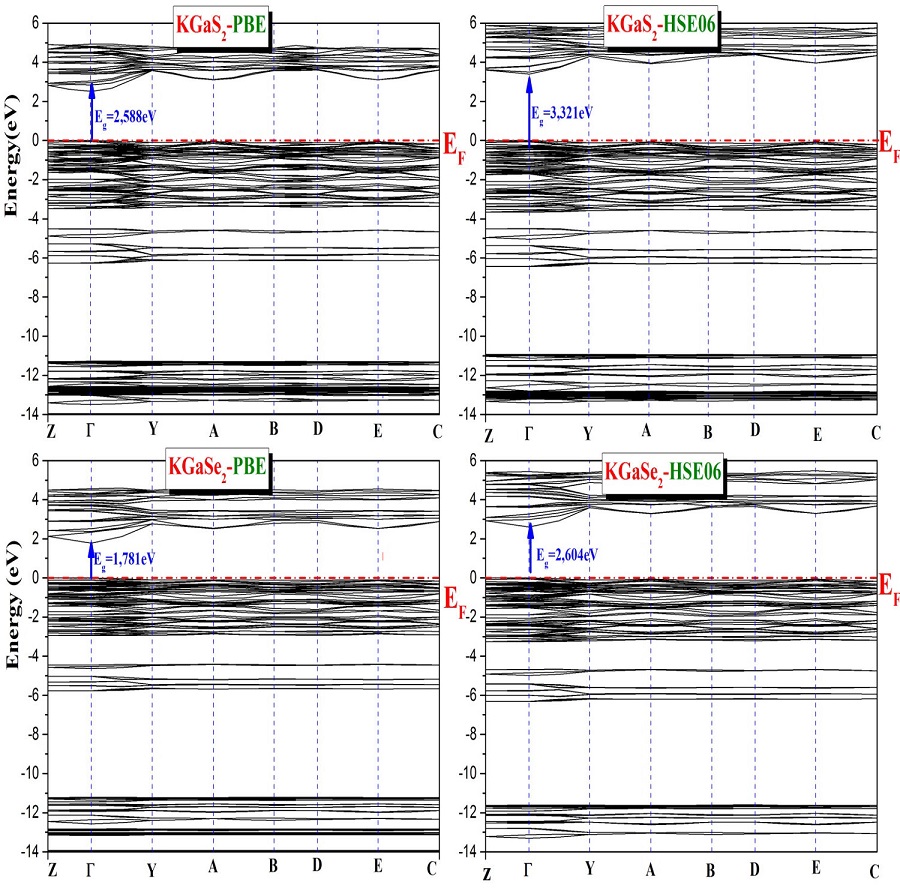
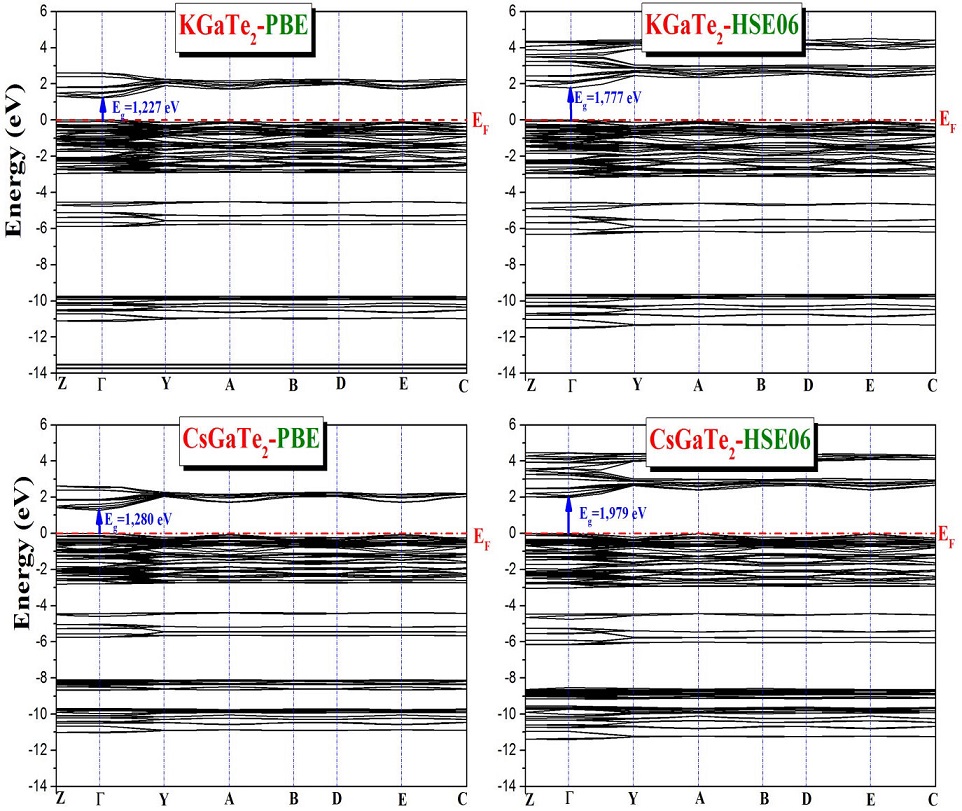
Table III Calculated band gaps energy (Eg) in eV for KGaQ2 (Q=S, Se) and AGaTe2 (A=K, Cs) compared with some experimental and theoretical values.
The obtained band diagrams have the same form, since the conduction band minima and valence band maxima of all studied materials appear at the center of the Brillouin zone, the Γ point, indicating that all the studied compounds are direct band gap semiconductors according to the calculations by either GGA-PBE or HSE06. We notice also that the HSE06 functional gives notably larger band gaps than the GGA-PBE functional. There is a notable difference between the band gap values yielded by these two functionals. The difference is 0.73 eV, 0.82 eV, 0.55 eV and 0.70 eV for KGaS2, KGaSe2, KGaTe2 and CsGaTe2 respectively. From the Table III, it is clear that the GGA-PBE functional method underestimates the electronic bandgap in the case of KGaSe2 while HSE06 functional method is in better agreement with the experimental value. There are no reported experimental or theoretical results on the band gaps for the remaining compounds, so this is their first theoretical prediction.
On the other hand, it can be observed that the fundamental band gap reveals a decreasing trend on increasing size of chalcogen from S, Se to Te in the case of KGaQ2 (Q=S, Se, Te). The larger band gap is observed in the case of KGaS2, we explain that S is more electronegative than Se and Te, this is consistent with the conclusions of the previously reported study which indicate that the band-gap is inversely proportional to the cell volume [26].
It can be seen that, in GGA-PBE calculations, the band gap value was equal to 2.588 eV and 1.781 eV for KGaS2 and KGaSe2 respectively. The gap energy value in the case of KGaSe2 compound is much smaller than the experimental value [2]. However, the use of the HSE06 hybrid functional gives 3.321 eV and 2.604 eV for KGaS2 and KGaSe2 respectively. We notice that the calculated band gap value by HSE06 is basically consistent with the experimental value in th case of KGaSe2. We have also calculated the band gap of AGaTe2 (A=K, Cs), finding that the values increase by the use of HSE06, from 1.227 eV (KGaTe2) and 1.280 eV (CsGaTe2) to 1.777 eV and 1.979 eV respectively. However, by changing from S, Se to Te in KGaQ2 (Q=S, Se, Te) an important difference is noticed in gap energy value almost of 1 eV and on the other hand the replacement of K-atom by Cs-atom in AGaTe2 (A=K, Cs) induces only a small difference of almost 0.2 eV. There are no reported experimental or theoretical results on the band gaps for AGaTe2 (A=K, Cs), so this is their first theoretical prediction. However, the hybrid density functional theory has improved the band gap, where we find larger band gap values than those obtained by GGA- PBE functional. According to the literature, as mentionned before, GGA-PBE calculations underestimate the band gaps and HSE06 calculations gives better estimation of band gaps, therefore the obtained gap value using the HSE06 confirms that the studied compounds are direct band-gap semiconductors with wide band-gaps.
Figure 4 represents the total and partial densities of states (TDOS and PDOS) of KGaQ2 (Q=S,Se) and AGaTe2 (A=K, Cs) compounds using the HSE06 approximation. Fermi level is set as zero energy. The valence states are regrouped in three divisions. First, we notice that at lower energies (< -15 eV) there are bands centered on -28.9 eV (-29.4 eV, --30 eV) for KGaS2 (KGaSe2, KGaTe2) respectively and on -21.45 eV for CsGaTe2, formed only of K-s and Cs-s states, which are not shown in the figure for clarity purpose, they do not form chemical bonding to other. And, the bands centered around -13.7 eV for KGaS2, -14 eV for KGaSe2 and -14.4 eV for KGaTe2 (CsGaTe2) are mainly formed of gallium Ga-d states. Next, the K-p states are located at -12.5 eV, -12.19 eV, -13.6 eV for KGaQ2 (Q=S, Se, Te) and the Cs-p states at -8.2 eV for CsGaTe2. As well as the chalcogen-s states are located at -10.6 eV and -11.3 eV for KGaS2 and KGaSe2 successively and at -9.8 eV for KGaTe2 (CsGaTe2). The K-p (Cs-p) and the chalcogen-s states exhibit very low hybridization, indicating weak chemical bonding between the K (Cs) atom and the chalcogen atoms. Finally, the upper valence band ranging from about -3.3 eV to 0 eV is mainly formed by the chalcogen-s,p and small contribution from Ga-s,p states. We notice a fairly large mixture of the Ga states and the chalcogen states for the title materials, and no contribution of potassium or cesium states around the Fermi level in this region, indicating that the band gap is primarily determined by the [GaQ2]— layer (Q=S, Se, Te).
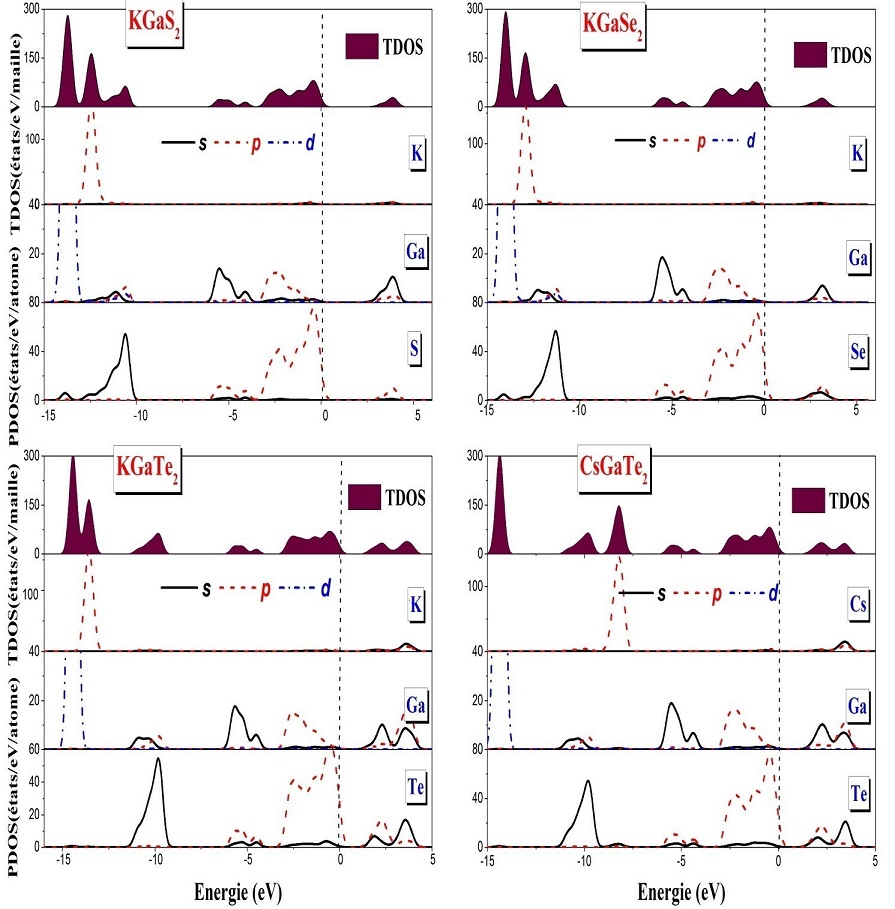
Figure 4 Calculated total (TDOS) and partial density of states (PDOS) of KGaQ2 ( Q=S, Se, Te) and CsGaTe2.
The conduction band is formed by chalcogen -s,p states with a small contribution of the Ga-s,p and K(Cs)-s,p states. For all studied compounds, we note that the contribution of potassium states is negligible. Our results of the DOS spectra are approximately similar with those reported in literature [2].
In summary, and as we have seen above, Table III shows the band-gap values of the KGaQ2 (Q=S,Se,Te) and CsGaTe2 materials, where the band-gap value 3.321 eV for KGaS2 is the largest among the four, followed by 2.604 eV for KGaSe2 and 1.777 eV for KGaTe2, and increases to 1.979 eV for CsGaTe2 when replacing the potassium atom by cesium atom. This is agreeing with the previously reported results, which indicate that the value of the band gap is inversely proportional to the cell volume [26]. The anionic radius increasing (1.84 Å, 1.98 Å, 2.21 Å for S, Se and Te successively) increases the cell volume (Table I) leading to a decrease in the minimum conduction band which causes the observed decrease in the band gap. Thus, the existence of direct and wide bandgaps of the studied materials indicates their their possible photovoltaic applications.
3.3 Optical properties
Energy gap and refractive index are two important physical parameters that characterize the electronic and optical properties of semiconductors. Since the energy gap determines the photon absorption threshold in semiconductor and the refractive index is a measure of it transparency with respect to incident spectral radiation, they are useful for determining the suitable applications of semiconductor in electronic, optical and optoelectronic devices.
In the literature, several studies on known semiconductors have been carried out to understand the correlation between the energy gap and the refractive index in order to generate the relation between them. Different empirical models have been proposed, among the best known which have been applied successfully to direct band gap semiconductors are the model proposed by Ravindra in 1979 [13] and that proposed by Moss in 1985 [14]. It was seen that where Ravindra’s relation fails Moss’s relation approaches experimental results. On the other hand, in 1995, Heve and Vandamm claimed that their model is accurate for wide band gap semiconductors and for most materials used in optoelectronic devices [15].
In this work, the refractive index n was estimated using the three different empirical models, cited above, based on the previously calculated fundamental energy gap Eg, estimated from the HSE06 approximation, using the following equations:
• Ravindra relation [13]:
with α = 4.084 and β = -0.62 eV-1.
• Moss relation [14]:
where k is a constant with a value of 95 eV.
• Herve-Vandamme relation [15]:
with A = 13.6 eV and B = 3.4 eV. The high-frequency dielectric constant ϵ∞ can be calculated using the relation
The reflection coefficient R for high frequencies is given by the relation
We have calculated the reflection coefficient R and the high-frequency dielectric constant ϵ∞ of the studied materials using (6) and (7) as function of the refractive index n. The results are presented in Table IV. It can be observed, and whatever the empirical model used, that the refractive index decreases with increasing the energy gap. It is clear that both values of n and ϵ∞ increase from KGaS2 to KGaSe2 then to KGaTe2 and also decrease from KGaTe2 to CsGaTe2. It can be concluded that the smaller the energy band gap, the higher the refractive index and dielectric constant and the smaller the reflection coefficient, the more useful the material to optoelectronic devices.
Table IV Calculated refractive index (n), high frequency dielectric constant ϵ∞ reflection coefficient R for KGaQ2 (Q=S, Se) and AGaTe2 (A=K, Cs).
| System | KGaS2 | KGaSe2 | KGaTe2 | CsGaTe2 |
|---|---|---|---|---|
| a 2.313 | a 2.458 | a 2.704 | a 2.632 | |
| n | b 2.025 | b 2.470 | b 2.982 | b 2.857 |
| c 2.238 | c 2.452 | c 2.778 | c 2.689 | |
| a 5.348 | a 6.040 | a 7.312 | a 6.928 | |
| ε∞ | b 4.101 | b 6.099 | b 8.894 | b 8.163 |
| c 5.011 | c 6.013 | c 7.718 | c 7.229 | |
| a 0.157 | a 0.178 | a 0.212 | a 0.202 | |
| R | b 0.115 | b 0.179 | b 0.248 | b 0.232 |
| c 0.146 | c 0.177 | c 0.222 | c 0.210 |
a: Ravindra model b: Moss model c: Heve and Vanadamme model
We recall that the results presented in the actual paper on n and ϵ∞ are not available from experimental data or other theoretical studies for comparison, and this results remain as predictions. Moreover, we can remark that the obtained results show that the Herve and Vandamme model represents, generally, the average values between the results using Moss and that of Ravindra. According to the literature, Heve and Vandamme based their equation on oscillatory theory, assuming the UV resonance energy has a constant difference with the band energy. However, they found that their model produces results very close to the experimental data for energy gaps greater than 1.43 eV [27]. Therefore, we believe that the results that could be considered a good prediction are those obtained by the use of the model proposed by Herve and Vandamme.
4 Conclusion
In conclusion, we have studied the structural, electronic and optical properties of KGaQ2 (Q=S, Se) and AGaTe2 (A=K, Cs), using the first principles density functional calculations. The calculated structural parameters of these compounds agree well with the reported experimental data. We have calculated and compared the electronic structure using both GGA-PBE and HSE06 functionals. Our results show that the four studied compounds are direct band-gap semiconductors with wide band-gaps. We have also estimated the refractive index, the re ection coefficient and the dielectric constant on high frequencies. We expect these materials to have important applications in optoelectronics. Since no known experimental data have been published, we hope that the results presented in this paper will contribute to the literature and generate further theoretical and experimental research.

