


 text new page (beta)
 English (pdf)
 Article in xml format
 Article references
 Send this article by e-mail
 Cited by SciELO
  Similars in
SciELO
Similars in
SciELO 
 Permalink
1. Introduction
Cobalt (Co) clusters display a wide range of magnetic properties that can be used in modern technological applications such as data storage, permanent magnets, biomedical applications, sensors and actuators, recording heads and catalysis, among many others 1,2. For many practical applications such as model catalytic reactions and magnetic storage media, flat geometries must be avoided since they exhibit superparamagnetic behavior. So, in order to increase the anisotropy barrier, high volume clusters with small diameters must be produced 3. In addition, the clusters must remain disperse to diminish the exchange coupling to obtain closed-packed ferromagnetic structures 4.
In recent years, thin films and cobalt clusters have been grown onto various substrates, since it is well known that the surface characteristics play a key role in the nucleation and growth mechanisms of these aggregates, affecting not only their size and shape, but also their intrinsic physical and chemical properties in the nanometer range 5. In particular, because of the possibility to study the clusters perpendicular magnetization for applications in magneto-optical technology, studies of cobalt aggregates grown onto weakly interacting substrates have attracted special attention.
Previous reports on the growth of cobalt onto crystalline gold substrates by using high vacuum evaporation methods have shown the formation of islands, with sizes of the order of several nanometers, which eventually merge to form atomic layers following a complicated growth mechanism 6,7. Although the information provided by high vacuum techniques has been critical not only for understanding the nucleation and growth of structures at the nanoscale, but also to understand the relationship between the size and magnetic characteristics of the aggregates, the complexity and high cost of the vacuum instrumentation limit its large-scale applications. Therefore, an easier, simpler, and more affordable technique that involves the use of electrochemical methods have become an interesting alternative, since changes in the anion type, electrolyte solution, as well as the control parameters, allow to regulate the clusters population, dimension and crystalline structure, among other properties, for larger systems 8-11.
By using electrochemical techniques, cobalt thin films and clusters have been electrodeposited onto glassy carbon (GCE) 12,13, highly oriented pyrolytic graphite (HOPG) 14-16, Si 17,18, vitreous carbon and copper 19, Nb 20, indium tin oxide (ITO) 21,22, and gold 23-25, among others surfaces. Regardless of the electrode surface, the cobalt cluster formation shows a massive nucleation and growth of numerous islands at the working electrode exhibiting dissimilar morphologies and crystalline structures.
From the magnetic point of view, although some works have been devoted to the study of the magnetic distribution on cobalt thin films, few works have been conducted to investigate the local magnetic properties of cobalt clusters and their magnetic evolution at different stages of growth. For instance, magnetic force microscopy has become an essential technique to characterize the magnetic stray field distribution of clusters and thin films with an unprecedent spatial resolution. In recent works, the local magnetic stray field of independent cobalt clusters electrodeposited from sulfate solutions onto ITO 22, HOPG 26 and Si 27 was correlated with the height and diameter of the clusters. Here, a clear dependence on the height rather than the diameter of the clusters was observed for the transition from the single to the multi domain magnetic state. In addition, the substrate showed an important influence on the minimum height for the magnetic transition, since this lower bound limit was different for each surface. These results are relevant for practical applications, since close-packed ferromagnetic structures, require high volume clusters with a large height/diameter ratio in order to maximize their out-of-plane magnetic response.
In this work, a magnetic force microscopy (MFM) study was carried out to further investigate the influence of the substrate on the nucleation, growth, local magnetic state, and magnetic transition of electrodeposited cobalt clusters onto gold electrodes. On the other hand, the experimental results were complemented by using a single domain ferromagnetic model and an Object Oriented MicroMagnetic Framework program (OOMMF) 28 to perform micromagnetic simulations, which allowed us to infer local intrinsic magnetic parameters of the aggregates.
2. Methodology
2.1. Experimental
A typical three electrode cell was employed for the electrodeposition of cobalt clusters onto gold (111) electrodes at room temperature from the aqueous sulfate solution 10−2 M of CoSO4 + 1M Na2SO4. For this particular bath composition, independent cobalt aggregates has been obtained, since Na+ ions do not electrochemically react at the electrode surface 9. Analytic reagent grade products were employed with ultrapure water (18 M ohms, Simplicity Millipore system). The solution was deoxygenated by using N2 bubbling for 15 minutes prior deposition. The electrochemical experiments were controlled with a BAS Epsilon potentiostat and the electrochemical analyzer software EPSILON-EC. In this work, the counter and reference electrodes were a graphite rod and a saturated silver electrode (Ag/AgCl), respectively. Initially, the cyclic voltammetry response was evaluated in order to identify the cobalt reduction potential for the system at 20 mV/s. The clusters formation was achieved with the potential step technique from +600 mV towards different reduction potential values (−820 mV, −840 mV, −860 mV, −880 mV) for 32 seconds, in order to investigate the clusters magnetic evolution at different formation stages. From previous experience with this electrochemical system, a diffusional 3D growth was observed 26.
The clusters morphological characterization was performed right after formation with a scanning electron microscope (SEM) JEOL JSM5600 LV coupled with a Noran X-ray microanalysis system at 20 KeV. Atomic Force Microscopy (AFM) and Magnetic Force Microscopy (MFM) images were obtained simultaneously with a JEOL JSPM 4210 equipment. For the magnetic study, MikroMasch magnetic probes with a Co-Cr magnetic coating were employed. All tips were initially magnetized along the pyramid axis prior to the scanning process. In this study, large tip-sample distances (lift heights) were employed in order to decouple morphological and magnetic information. It is well known, that MFM images consists of dark and bright spots or regions, which represent magnetic states with up or down out-of-plane magnetization. In general, dark regions result from attractive, while bright regions result from repulsive magnetic interac tions.
2.2. Theoretical and micromagnetic modelling
The relationship between the clusters magnetic states and their dimensions, was achieved by using a theoretical single domain ferromagnetic model which employs a geometrical analysis in terms of the size and shape of the aggregates. The model, proposed by Aharoni in 1988, describes a rigorous theory to describe the magnetic properties of elongated single-domain ferromagnetic particles 29. Although there are different models to investigate the magnetic transition of individual clusters, this particular approach allowed us to accurately describe the local magnetic state for each aggregate, since we only require the dimensions of the aggregates that can be easily obtain by using AFM. The main assumption of this model is that single domain states of elongated particles are well characterized with a magnetostatic term which depends on the volume, a demagnetizing factor and the saturation magnetization. The morphological characteristics of the clusters, in particular the aspect ratio m = a/d being a the length of the minor axis and d the length of the major axis of an elongated particle, are considered in the demagnetizing factor. With this information, it is possible to predict a critical dimension (ao) below which, the particles exhibit a mono domain magnetic state. The critical height depends on the magnetic saturation, the particle aspect ratio (NR) and the magnetic exchange constant as describe in Ref. 29.
As it was mentioned previously, a finite difference micromagnetic simulation program (OOMMF) was employed in order to correlate with experimental results and infer magnetic intrinsic properties of the clusters at different dimensions. In the simulations, the Landau-Lifshitz-Gilbert given by Eq. (1), was numerically solved to obtain the perpendicular magnetic component of aggregates with the same dimensions to the experimental aggregates in order to compare with magnetic force microscopy images.
Here, M is the magnetization, Heff is the effective field, γ is the Gilbert gyromagnetic ratio, and α is the damping constant. For the computational analysis, the saturation magnetization (Ms) of cobalt (Ms =1.42 × 10⁶ A/m) 30 and the magnetocrystalline anisotropy K1 =4.1 × 10⁵ J/m331 were employed as independent parameters, whereas the exchange constant (A) and the crystalline structure were used as fitting parameters for the various experimental formation potentials. To improve convergence in a reasonable number of iterations, the damping constant α was set to 1.0, since only the final magnetic state of the cluster was required.
In order to represent the experimental size and shape of the clusters as seen with AFM, the simulations where performed on oblate ellipsoids up to 80 nm in height and base diameters up to 800 nm. The simulations were carried out in the presence of a uniform external magnetic field (380 mT) applied along the z direction, to simulate the presence of the magnetic tip in order to reproduce the out-of-plane magnetic component in the MFM images 26. The cluster mesh was 2.0 nm, which was below the calculated exchange length value of 2.7 nm by using Lex = (2A/µ0M231 and A =1.1 × 10⁻¹¹ J/m 32.
The magnetic states of the clusters were analyzed once the converge torque value reached the stopping criterion of 1e−5 rerelative to Ms. At this point, the local out-of-plane magnetic distribution was identified and used to plot the magnetic transition diagram.
3. Results and discussion
In Fig. 1, a SEM image of the electrode after cobalt deposition with the −860 mV potential is observed. From this image, a granular Co deposit with clusters of similar sizes is shown. The surface coverage is almost complete with few areas of slightly higher and lower cluster density.
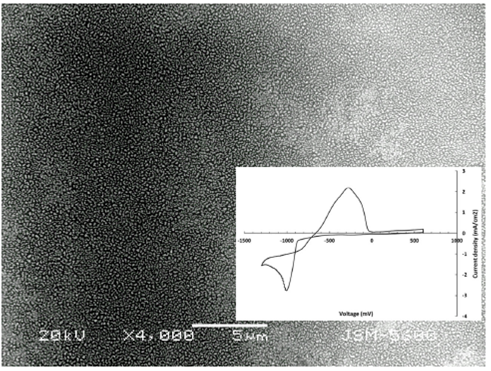
FIGURE 1 SEM image of the gold surface after Co electrodeposi-tion. The inset corresponds to the Cyclic voltammetry plot for the cobalt deposition onto Au.
The cyclic voltammetry (CV) response of the Au/0.01M CoSO4 + 1.0 M Na2SO4 system is shown in the inset of Fig. 1, where the anodic and cathodic peaks correspond to the cobalt deposition and dissolution at the gold interface. The cyclic voltammetry profile exhibited a well-defined peak at −1.0 V in the negative-going scan, and a broad oxidation region centered at −0.26 V. Similar plots have been observed for the cobalt electrodeposition onto Au(100) electrodes 33.
From this information, the cobalt potential interval for deposition was identified in order to study the cobalt nucleation and growth by using chronoamperometric methods.
The chronoamperometric information suggested a bidimensional followed by a tridimensional cobalt growth, with an average nucleation rate of 0.0018 nuclei cm−2s-1. In addition, by analyzing the shape of the transients, instantaneous nucleation and a 3D growth mechanisms were identified in all cases.
On the other hand, AFM and MFM images of the cobalt aggregates for the −840 mV potential formation are shown in Fig. 2, where an irregular dense pack film of clusters randomly distributed on the electrode are observed. From statistical measurements of the individual clusters, most of the aggregates exhibit semicircular shapes. The diameter and height of the aggregates were found to be between 100 − 700 nm and 5 − 80 nm, respectively. For the clusters with irregular in-plane dimensions, the longest diameter was se lected as the representative diameter of the aggregate. Figure 2b) shows the magnetic image of the Au/cobalt surface.
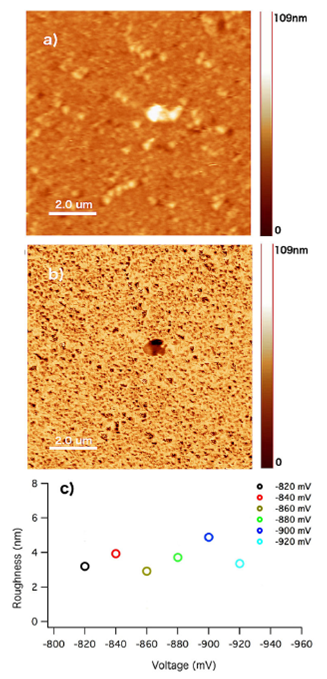
FIGURE 2 a) AFM and b) MFM images of the Au surface after Co deposition. c) corresponds to the roughness values at different formation potentials. Image sizes are 10 um × 10 um.
The image exhibits a similar background color with small dark specks of different sizes irregular distributed on the gold surface. In general, the magnetic features are smaller than the aggregates observed by AFM, which clearly demonstrate a higher magnetic resolution in comparison with the morphological image.
Figures 2a) and 2b), it is possible to identify the position of some of the clusters in both images, but the presence of others is only appreciated in the magnetic figure where the shape of the aggregates can be clearly observed. More important, the color within the clusters varies depending on the size of the aggregates, which indicates a magnetic dependence with the cluster size. It is worth noticing that the presence of one single color can be more easily appreciated in small aggregates, while two or more color contrast regions can be observed in aggregates of larger sizes. This result suggest the presence of single and multi domain magnetic states. On the other hand, by analyzing the AFM images at different potential formations, a periodic surface roughness is observed as the voltage formation increases (see Fig. 2c)). This behavior can be attributed to an increase in surface coverage followed by a three dimensional cluster growth.
In Fig. 3, a statistical analysis of the size of the aggregates at different formation voltages is shown. The main plot corresponds to the diameter, while the inset to the height of the clusters. From these plots, it is clear that the diameter of the clusters remained between 230 nm and 400 nm regardless of the formation potential. On the other hand, the majority of clusters exhibited heights between 15 nm and 35 nm for this potential formation interval. Both results agree with an instantaneous nucleation process, where aggregates of similar dimensions are obtained in agreement with chronoamperometric results. During deposition, the number of nuclei increased as the potential augments reaching a maximum coverage close to a thin film. After this stage, new clusters appear on the newly formed surface to continue in a repetitive cycle. This not only explains the morphological SEM and AFM images, but also the variations on the height of the clusters and surface roughness at different potential values.
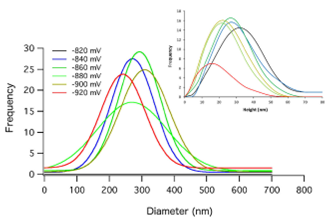
FIGURE 3 Frequency histogram of the diameter and height (inset) of the clusters at different formation potentials.
In Fig. 4a), the plot of the diameter versus height for the clusters for the −840 mV potential formation is shown. Here, different individual clusters where analyzed in terms of their size and magnetic state as seen from MFM. It is clear that single domain states remain in the lower left side of the graph, while the multi domain states are more randomly distributed above certain height. The same behavior was observed for all other potential values. From the experimental plots, the critical height for the single to the multi domain transition was between 47 nm and 51 nm for all the potentials employed. It is interesting to notice that this critical height is higher than the one observed for the same electrodeposition bath by using HOPG 26, and much higher than the one observed by employing ITO as a substrate 22.
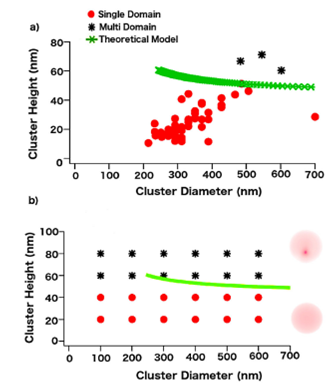
FIGURE 4 a) Experimental magnetic states observed by MFM as a function of the height and the diameter of the clusters. Dots represent single domains while stars represent multi domains. b) Calculated magnetic diagram of the out-of-plane magnetic component obtained with OOMMF. Dots represent single domain states while squares represent multi domain states for different diameters and heights. The theoretical lower bound for the magnetic transition (green line) was included for comparison.
In order to find the best fitting plot for each electrode-posited voltage, the exchange constant value was employed as a fitting parameter for each potential formation as shown in Table I.
TABLE I Exchange constant values.
| Potential Formation (mV) | Exchange Constant A[J/m]x10-10 |
| -820 | 1.46 |
| -840 | 1.46 |
| -860 | 1.47 |
| -880 | 1.89 |
The exchange constant value of bulk cobalt has been reported as 1.1 × 10⁻¹¹ J/m 31. As we can see from Table I, the exchange constant for these clusters is 1.55 ± 0.4 × 10⁻¹⁰ J/m. In addition, this value slightly increased as the formation potential augmented, which indicated an increase in the strength of the direct exchange interactions between magnetic moments due to the augment in surface coverage in agreement with experimental results. Since A is also proportional to the Curie temperature 34, a possible enhancement of the Curie point for these Co clusters is expected. Previous works on the formation of cobalt clusters onto HOPG and ITO showed exchange constant values of 1.1 × 10−1126 and 2.48 × 10−1222 J/m, respectively. From these results, we noticed an important increase in the exchange constant value which can be associated to the presence of a compact cluster formation at the gold interface. This cluster configuration increases the surface-induce anisotropy due to the contribution of an easy axis of magnetization in the plane of the film 35. In addition, there is a strong preference for cobalt films to be formed onto gold surfaces which agree with these results. Therefore, the resulting exchange constant value can then be interpreted as competition between out-of-plane and in-plane magnetic interactions, which in turn, affect the local magnetic transition of the exposed clusters at the interface. So, as the potential increases, and therefore the cluster density, the exchange constant slightly increases indicating that the in-plane contribution becomes more important, as ex pected. These results are also consistent with the augment on the critical height for the mono to the multi domain magnetic transition at higher formation potential values.
For the theoretical calculation, the cobalt saturation magnetization Ms =1.42 × 10⁶ A/m3, and the aspect ratio m (where m = a/d with a the height and d the diameter of the clusters) were employed to obtain the lower bound height for the out-of-plane magnetic transition. The critical height values were between 47 nm and 52 nm. The theoretical plot for the −840 mV potential is observed as the continuous line in Fig. 4b, where single domain states remained below this critical height, while the multi magnetic distribution was always above this region. Similar behaviors were observed on cobalt nanoclusters electrodeposited onto HOPG 26 and ITO substrates 22, where the transition heights were around 12 nm and 6 nm, respectively.
For the micromagnetic simulations we used different uniaxial anisotropies and random initial magnetic states as starting configurations, and the results were the same regardless of the initial parameters. On the other hand, we used different crystalline structures and the exchange constant values (A) obtained from the theoretical model (Table I), in order to fit our experimental results. The predicted magnetic states at various clusters dimensions are shown in Fig. 4b). The single domain state showed a uniform out-of-plane magnetic distribution, while the multi domain state exhibited a vortex-like state. Here, the magnetization curls in a circular path along the dot due to the shape of the clusters, leading to a singularity (vortex) where the magnetization turns out-of-plane (vertical direction). The simulations were initially performed on semi oblate spheroids with diameters ranging from 100 to 800 nm and heights from 20 to 80 nm in order to compare with the experimental shapes and dimension for all the formation potentials. Unfortunately, it was very difficult to reproduce the experimental transition diagram as it was successfully done in previous works by using only the cobalt information and the perpendicular magnetic field associated to the MFM tip. A more detailed analysis of the morphological images showed the presence of an almost completed surface coverage (film-like) underneath independent cobalt clusters. Therefore, it was decided to introduce an in-plane magnetic field to represent a magnetic contribution along the gold interface 36. From our simulations, the in-plane magnetic field that fully reproduce the experimental results was 0.05 T. It is worth noticing that under the influence of the in-plane magnetic field, the critical height for the magnetic transition increased with the potential formation, as expected. Finally, the simulated clusters in Fig. 5b show the out-of-plane magnetic component in order to compare with MFM images.
In addition, from the simulations, we found that the crystalline structure that fitted our experimental values corresponded to a faced-centered cubic (fcc). Other groups have observed that cobalt electrodeposited films onto different substrates exhibited both, hexagonal close-packed (hcp) and faced-centered cubic (fcc) structures 37-39, where the final crystallographic hcp/fcc ratio depended on the bath conditions and substrate characteristics. Although the hcp texture is more stable at lower temperatures, the fcc structure predicted by our model can be explained in terms of the substrate crystallographic orientation, which possible induced an epitaxial growth in the early stages of cluster formation 7, and also, has a much lower magnetocrystalline anisotropy than the hcp 39. On the other hand, it is well known that as the thickness of the system decreases, the magnetostatic contribution becomes more important, and then dominates by keeping Ms closer to the substrate plane. This result is consistent with our experimental results, since our clusters exhibit a much larger diameter than height, which suggest a higher magnetic component parallel to the surface, which in turn contributes to the increase of the critical height for the magnetic transition.
4. Conclusions
Cobalt aggregates were electrodeposited onto gold surfaces by using chronoamperometric methods via an instantaneous nucleation process by using different formation potential values. From MFM and AFM results, it was possible to identify the transition between single to multi magnetic domain states in clusters with flat spheroid geometries, where the height rather than the diameter determined the critical height for the magnetic transition. By using a theoretical model based on the shape and size of the clusters, exchange constants one order of magnitude larger that the cobalt bulk value were predicted, possibly due to the formation of closed pack deposits for the potentials employed. Micromagnetic simulations were also used to investigate the perpendicular local stray field to correlate with MFM images. For this analysis, it was necessary to introduce a fcc crystal structure and one in plane magnetic field to reproduce experimental transition heights around 50 nm. This in-plane magnetic component represents the affinity of cobalt for the gold surface, which raised the height for the magnetic transition in contrast with other substrate materials.
In summary, in this work we were able to predict intrinsic magnetic parameters of cobalt aggregates from local morphological and magnetic measurements of individual clusters. The observations were consistent with other works, and therefore, this method represents a new strategy to obtain information very difficult to measure (especially in aggregates and thin films), such as the exchange stiffness, which is one of the key parameters controlling magnetization reversal in magnetic materials with applications in recording media.

