


 text new page (beta)
 English (pdf)
 Article in xml format
 Article references
 Send this article by e-mail
 Cited by SciELO
  Similars in
SciELO
Similars in
SciELO 
 Permalink
1. Introduction
Nowadays it is well known that carbon dioxide (CO2) emissions are causing environmental problems. In fact, several investigations have been conducted to produce new materials with good sorption properties to capture that gas. For instance, CO2 sorption has been proved with lithium ceramics at high temperatures [1-3], by activated carbon [4,5], by zeolites [6] and polymeric membranes [7] methods. Amines [8], molten salts [9] and surfaces such as graphite [10,11] have been also used. In fact, it has been observed that the characteristics of the materials play an important role in the physical and chemical properties of the adsorbates. On the other hand, surfactants have proved to be a good alternative not only for gas remediation but also for other type of contaminants [12]. Moreover, surfactant-modified surfaces have shown improvement for pollutant removal [13-15]. For instance, sodium dodecyl sulfate (SDS) and its mixtures have been used with the Micellar-Enhanced Ultrafiltration technique (MEUF) to remove phenol with good results [16].
Computational methods have also been used to study adsorption of contaminants in bulk [17] and on solid surfaces [12] as alternative to investigate such complex systems. In particular, sorption of CO2 on solid surfaces have been studied with Monte Carlo methods giving good results with actual experiments [18]. Molecular dynamics simulations have also been tested to investigate removal of contaminants using surfactants [12] on solid surfaces.
In the present work we investigate adsorption of CO2 on a graphite surface with and without the presence of an anionic surfactant, sodium dodecyl sulfate. We are interested in the effects of those surfactants on the adsorption phenomena of gases on solid surfaces and whether the amphiphilic molecules might be used as agents to improve capture of CO2. The analysis of the results are conducted in terms of thermodynamics and structural properties, i.e. adsorption isotherms and density profiles, respectively. Moreover, the simulations are conducted with and without the presence of surfactants on the solid surface.
2. Computational Method and Model
Studies of the systems are conducted using Molecular Dynamics simulations in three different stages. In the first one, simulations to test the CO2 model in bulk were conducted, in the second stage simulations with CO2 molecules deposited on the solid surface were carried out to study adsorption of the gas, and in the last stage surfactant molecules were included on the surface to study the effect of the amphiphilic molecules in the gas adsorption. Therefore, the first simulations started with CO2 molecules in a bulk gas phase in a cubic simulation box. For the CO2 we used a model with virtual sites to keep the linear structure of the molecule [19]. Parameters for the model were obtained from the literature [20]. Then, simulations at temperature T = 298 K and P = 10 bar were conducted to obtain gas density to compare with real experiments. Simulation data, ρ = 18 kg/m3, was in good agreement with the experimental value at the same thermodynamic conditions [21]. Simulations were carried out in the NPT ensemble using the Parinello-Rahman barostat and Nose-Hoover thermostat to maintain constant the pressure and the temperature, respectively with relaxation times of τ P = 2.0 ps and τ T = 0.1 ps.
All simulations were conducted with GROMACS4.5 [22] software using periodic boundary conditions in all directions. The electrostatic interactions were handle with the particle mesh Ewald method and the short range interactions were cutoff at 20 Å whereas bond lengths were constrained using the Lincs algorithm. Then, simulations were performed for 30 ns after 2 ns of equilibration with a timestep of dt = 0.002 ps.
The second part of the simulations was conducted for the equilibrated CO2 molecules, i.e they were located on a graphite surface in a simulation box of dimensions X = 78.7 A, Y = 72.7 Å and Z = 150.0 Å. In the Z-direction a reflecting wall (using a repulsive potential) was used at the distance of Z = 70.8 Å to avoid CO2 molecules interacting with the other side of the graphite wall due to the periodic boundary conditions, and also to have a gas density of ρ = 18 kg/m3 (gas phase). The graphite surface was constructed with 9216 carbon atoms in four layers (see Fig. 1).
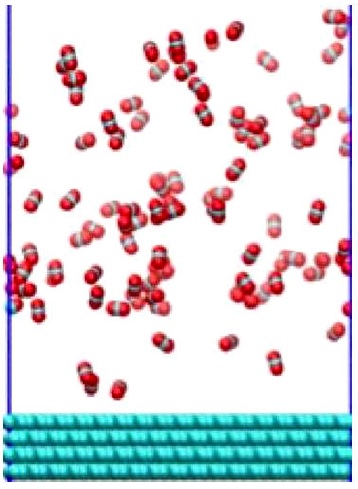
FIGURE 1 Snapshot of the CO2 gas and solid graphite wall configuration. In the bottom the graphite atoms are represented in green an in the top of the figure are the CO2 molecules.
A third set of simulations were carried out using SDS surfactants. The SDS surfactant was constructed using a molecular model of a hydrocarbon chain of 12 united carbon atoms attached to a headgroup, SO4. Atoms in the headgroup were explicitly modeled [23]. Initially 127 SDS molecules, to have an area per molecule of 45 Å2/molecule, were located close to the graphite surface solvated with 5000 water molecules using the SPC model [24]. Once the surfactants were equilibrated on the graphite surface, water molecules were removed and CO2 was added at different concentrations to study adsorption of the gas.
All last simulations were conducted in the NVT ensemble at constant temperature, T = 298 K, using the Nose-Hoover thermostat with a relaxation time constant of 0.1 ps for up to 30 ns.
3. Results
3.1. CO2 adsorption
Adsorption of CO2 on the graphite surface was analyzed in terms of density profiles. In Fig. 2, density profiles at different CO2 concentrations are shown. In the figure, it is observed a first well adsorbed layer of CO2 molecules (in all plots) on the graphite surface. Moreover, it was possible to observe that the first peak in the density profiles, increased as the CO2 concentration increased, suggested that more gas molecules were adsorbed on the surface. The percentage of total CO2 molecules adsorbed on the graphite plate, calculated by integration of the density profile Eq. (1), is indicated in Table I. It is noted in the table that the percentage of CO2 adsorbed, with respect to the total carbon dioxide molecules, decreases as the gas concentration increases.
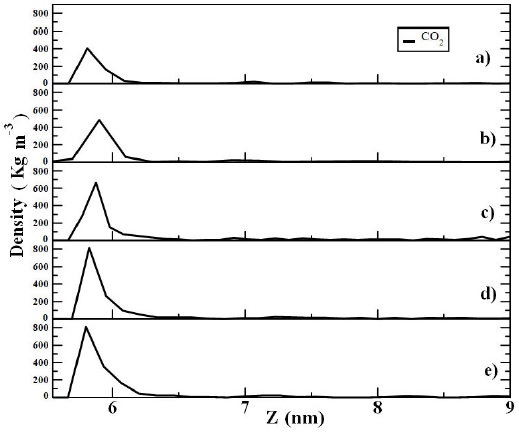
FIGURE 2 Density profiles of CO2 adsorbed on a graphite surface at different gas concentrations a) 100 CO2 b) 200 CO2 c) 300 CO2 d) 400 CO2 and e) 500 CO2 molecules. The graphite surface was in the X-Y plane and it is represented in the Y-axis in the figure. Temperature is at T = 298 K.
TABLE I CO2 adsorption with and without SDS.
| Total CO2 molecules |
adsorbed CO2 percentage (%) |
adsorbed CO2 percentage (%) with SDS |
| 100 | 62 | 81 |
| 200 | 46 | 71 |
| 300 | 35 | 57 |
| 400 | 31 | 50 |
| 500 | 29 | 44 |
N i and N T are the number of molecules in the first peak and the total number of molecules in the system, respectively. The upper limit “r” goes to the distance of the first peak in the density profile.
Since it is observed a single peak, suggesting an isotherm type 1 [25], the adsorption can be analyzed in terms of the Langmuir adsorption isotherm and plotted in Fig. 3a. Then, the isotherm data were fitted with the Langmuir model [26],
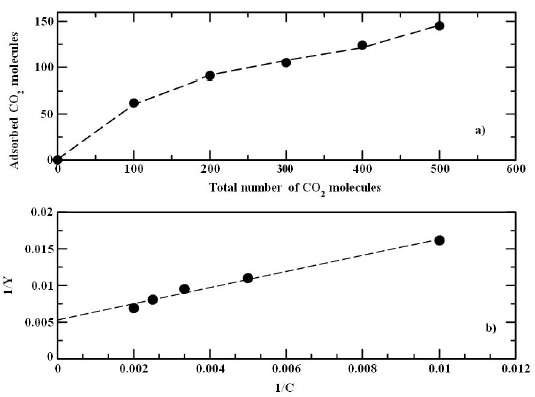
FIGURE 3 a) Isotherm plot of CO2 adsorption. b) Fitting data of the isotherm plot of CO2 adsorption.
where γ is the cover fraction on the surface, b gives information of the ratio between the adsorption reaction constant and the desorption reaction constant, k ads /k des, and C is the initial concentration.
By defining a new variable, γ = y/y m last equation can be rewritten as
and plotted in Fig. 3b. Then, by fitting the best line to the data it obtained the parameters b = 4.8199×10⁻³ and y m = 188.6792, i.e from those values it is estimated that the saturation area is reached at 188 CO2 molecules. In fact, from the data it was observed that the adsorption decreases as the CO2 concentration increases suggesting a maximum number of molecules adsorbed on the surface indicated by the parameter y m , i.e. above that value it is not possible to have more adsorbed molecules on the surface. Because of the small value of “b” indicates a weak interaction of the gas with the surface.
3.2. CO2 adsorption with SDS Surfactants
In Fig. 4 the density profiles of CO2 adsorbed on the graphite plate in the presence of SDS surfactants are shown. It is observed that the SDS tail groups are adsorbed on the graphite surface with the SDS headgroups on the top layer. The Na+ ions are located close to the head groups as indicated by the density profiles. It is also noted from those profiles that CO2 is deposited above the hydrocarbon SDS tails, however, as the gas concentration increases few of those molecules penetrate into the surface, showing good adsorption on the graphite plate. In fact, the density profiles with SDS present more structure than those without SDS, i.e they show layers along the normal of the surface. Even though, it is possible to observe a gas phase above the SDS aggregate. In Table I, the number of CO2 molecules adsorbed on the graphite surface is shown and the total percentage of adsorbed CO2 molecules for these systems.
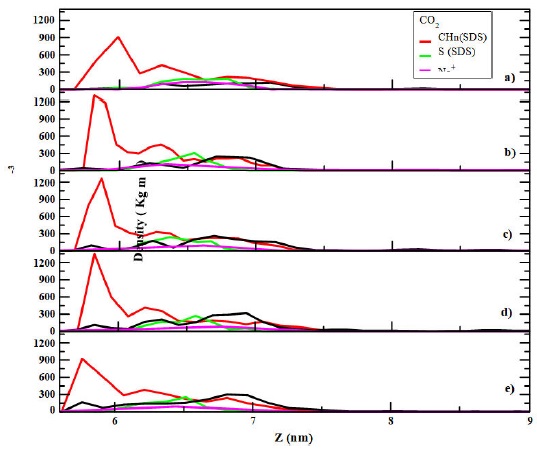
FIGURE 4 Density profiles of CO2 adsorbed on a modified graphite surface with SDS surfactants at different gas concentrations a) 100 CO2 b) 200 CO2 c) 300 CO2 d) 400 CO2 and e) 500 CO2 molecules. The graphite surface was in the X-Y plane and it is represented in the Y-axis in the figure. Temperature is at T = 298 K.
From Table I it is noted that as a general feature the percentage of CO2 adsorbed decreases as the gas concentration increases, i.e. the same trend as that obtained for the adsorption without SDS surfactants. However, it is worthy to note that the percentage of CO2 adsorbed in the presence of SDS molecules is higher than that without the surfactants. As in the case without surfactants, it is possible to construct an isotherm with the adsorption data. However, since it is observed more than one layer it is assumed an isotherm type 2 [25] and we fit an Freundlich isotherm [27], which represent better multilayer adsorptions,
where C is the initial concentration, K is a constant related with the adsorption capacity of the system and 1/n represents the saturation rate of adsorption. In Fig. 5a the adsorption isotherm is shown. Then, the parameters of Eq. (4) were found from a log-log plot (see Fig. 5b). By fitting the best curve to the isotherm the values of K = 4.921 and n = 1.616 were obtained. It is worthy mentioning that in this model there is not a molecular covering limit on the surface since it is a multilayer process, i.e there is a higher gas adsorption in this system. In fact since 1/n < 1, it suggests that we have better adsorption in this system. Moreover, from these results we note that adsorption increases with a modified graphite surface respect to the systems without surfactant molecules on the solid surface.
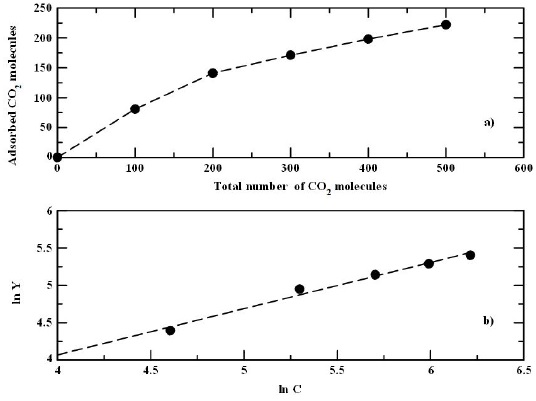
FIGURE 5 a) Isotherm plot of CO2 adsorption in graphite plate with SDS surfactants. b) Log-log representation of the isotherm plot of CO2 adsorption.
In recent experimental studies adsorption of CO2 on a graphite oxide modified by tetraethylenepentamine molecules were analyzed [11]. In those experiments, they conducted experiments at different concentrations and it was observed, that at some concentrations, adsorption was better with modified surfaces than with pristine graphite. They also observed that temperature can affect the adsorption and consequently, the CO2 capture on the modified graphite oxide.
3.3. CO2 interaction
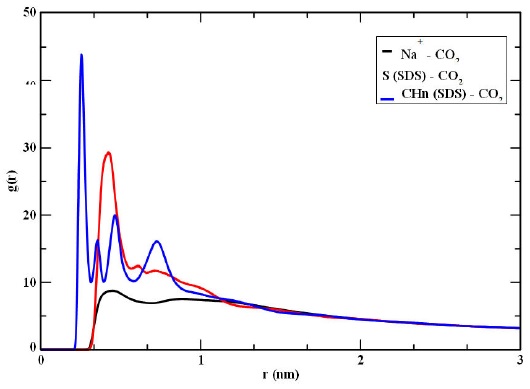
The interaction of CO2 with the graphite surface is also analyzed in terms of pair correlation functions, (g(r)). In Fig. 6, g(r) plots with different sites are shown, it is observed that the CO2 molecules are closer to the Na+ ions, which could be explained by the attraction of the CO2 oxygens with the positive ion. In fact, a strong attraction between the carbon of the CO2 with the oxygens of the SDS head group should also occur as suggested by the high peak in the pair correlation function of the sulfur atom, in the SDS, with the CO2. On the other hand, the CO2 and SDS tails present less affinity each other as indicated by the g(r) of Fig. 6, CHn-CO2. That result could be explained since the SDS tail groups, deposited on the graphite surface, did not have much contact with CO2 molecules, i.e. adsorption occurs mainly with the headgroups, which are the ones attached to the tails deposited on the surface.
4. Conclusions
Studies of CO2 adsorption on a modified graphite surface were investigated as alternative of gas capture. In the present work we used an anionic surfactant to promote adsorption on a graphite surface. The results showed that the addition of surfactants on the solid surface increased the amount of gas retention respect to the case of a graphite surface only. When a graphite plate is used, CO2 is adsorbed on the surface forming one single layer with a maximum amount of gas retention as indicated by the Langmuir isotherm calculations. On the other hand, when graphite was modified with SDS on its surface several layers were observed, i.e a thicker adsorption layer was obtained. Previous experimental results have shown that modified graphite surfaces with amine molecules improved CO2 capture [11]. In the present work, we did not use amines to modify the surface, the graphite was modified with surfactant molecules however, similar tendencies of those experimental works were observed, i.e the modified surface increased gas adsorption. Somehow, adsorption of CO2 is conducted mainly by amines or surfactants rather than the pristine graphite. It is important to mention that in the present work the CO2 adsorption is mainly produced by the SDS surfactant as indicated by the first strong peak of the pair correlation function between the SDS headgroup and the CO2. All of these results indicate that surfactants can be used to increase confinement of CO2, however it might be possible that not only anionic but also cationic (or non-ionic) surfactants can also have the same effect and those investigations are conducting in our group.

