SciELO - Scientific Electronic Library Online

 
vol.64 issue1Diffusion microrheology of ferrofluids author indexsubject indexsearch form
Home Pagealphabetic serial listing  

Services on Demand

Journal

Article

Indicators

Related links

  • Have no similar articlesSimilars in SciELO

Share


Revista mexicana de física

Print version ISSN 0035-001X

Rev. mex. fis. vol.64 n.1 México Jan./Feb. 2018


Research

Research in Condensed Matter

Effect of pressure on structural, electronic and optical properties of SrF2: a first principles study

D.M. Hoata  * 

J.F. Rivas Silvaa 

A. Méndez Blasa 

J.J. Ríos Rámireza 

aBenemérita Universidad Autónoma de Puebla, Instituto de Física “Luis Rivera Terrazas”, IFUAP, Av. San Claudio y Blvd. 18 Sur, Col. San Manuel, Puebla, México, 72570.


Abstract

We report results of the first principles calculations of structural, electronic and optical properties of SrF2 under pressure, performed using full-potential linearized augmented plane wave (FP-LAPW) method based on density functional theory as implemented on WIEN2k code. The exchange-correlation energy functional has been treated with generalised gradient approximation (GGA) for structural optimization, while the Tran-Blaha modifed Becke-Johnson potential (TB-mBJ) has been employed for electronic and optical calculations. Our results show that the first transition from Fm3¯m to Pnam structure occurs at 5.8 GPa and the second transformation from Pnam to P63/mmc structure takes place at 24.8 GPa. Our electronic calculation indicates an indirect gap X- Γ of Fm3¯m structure, direct gap Γ-Γ of Pnam structure and indirect gap Γ-K of P63/mmc structure. We do not observe the metallization up to 210 GPa. The linear optical properties such as absorption coefficient, reflectivity, refraction index, conductivity and energy loss function have been derived from calculated complex dielectric function for a wide energy range of 0-50 eV and pressure up to 50 GPa, and analyzed in detail.

Keywords: First principles; SrF2; phase transition; structural; electronic; optical

PACS: 64.60.-i; 71.; 78.20.-e

1. Introduction

SrF2, a strongly ionic crystal, is an important member of alkaline earth fluoride family (MF2, M = Ca, Sr, Ba). Their structural, optical, lattice dymamic and elastic properties have been extensively studied 1,2,3,4,5,6. Due to their unique properties, including low energy phonons, optical transparency, high resistivity and anionic conductivity 7, SrF2 has been applied in scintillation detectors 8 and luminiscent materials 9,10. As other members of the MF2, SrF2 undergoes a series of pressure induced phase transitions to highly coordinated 11.

In contrast of the great number of experimental and theorical works of CaF211,12,13,14,15,16 and BaF211,17,18,19,20 at high pressure, there is a very little studies about pressure induced phase transition and properties of SrF2. At ambient conditions, SrF2 crystallizes in the cubic fluorite structure with a space group of Fm3¯m, which consists of a cubic close-packed array of cations occupying tetrahedral sites. The experimental works on MF2 under pressure have shown that the first phase transition is from fluorite Fm3¯m to the orthorhombic cotunnite-type of Pnam space group, that is characterized by anions in a distorted hexagonal-close-packed (hcp) lattice and cations situated within tricapped trigonal trigonal prisms with the three outer anions in the plane of the cation. And the second pressure-induced phase transition would be that from orthorhombic structure to a hexagonal anti-Ni2In-type of P63/mmc space group, which is a subgroup of the cotunnite structure with an ideal hcp anion lattice.

Experimentally, Kourouklis et al.21 studied the pressure-induced phase transition by means of the Raman scattering and reported that under hydrostatic pressure, SrF2 can transform from cubic Fm3¯m fluorite structure to orthorhombic Pnam cotunnite-type structure around 5.0 GPa at 300K. Jiang et al.11 determinated that this first transition can take place at 5 GPa, while the second transition from Pnam structure to hexagonal P63/mmc Ni2In-type structure was observed to occcur at 29 GPa by angle- dispersive X-ray diffraction experiments. Cui et al.7 investigated the high-pressure behavior of SrF2 by angle-dispersive synchrotron X-ray poder diffraction measurement up to 50.3 GPa at room temperature and observed the first and second transition at 6.8 and 29.5 GPa, respectively. Theoretically, Francisco et al.22 made an atomistic simulation of SrF2 polymorphs and reported that the pressure transition of C1 (Fm3¯m) to C23 (Pnam) is 5 GPa. Rajagopalan et al.23 studied the structural phase stability and the electronic band structure of SrF2 under pressure using tight binding linear muffin-tin orbital method, their calculations show that the first phase transition of SrF2 was at 7 GPa and this material has wide band gap with the band gap initially increasing with pressure, which decreases upon further compression. Liu et al.24 predicted the first and second phase transition pressure to be 5.77 GPa and 45.58 GPa, respectively by first principles calculation based on DFT with plane wave basis set. Due to its great applicability, it is very important to understand the behavior of SrF2 at different conditions. So far, to our best knowledge, there is a very little studies about the properties of SrF2 under pressure.

In present work, we report the results of theoretical investigation of pressure effect on the structural, electronic, optical properties of SrF2 by means of full-potential linearized augmented plane wave method within framework of the density functional theory.

2. Computational details

The full-potential linearized augmented plane wave (FLAPW) method as implemented in WIEN2k package 25 has been used. For structural calculations, the generalized gradient approximation (GGA) proposed by Perdew et al.26 was employed as the exchange-correlation potential, and the maximum quantum number (l max ) for atomic wave functions inside the atomic spheres was 10, the energy cutoff for plane wave expansion of wave functions in the interstitial region was taken to be Kmax =7/RMT and the self-consistent calculations are considered to be converged when the total energy of the system is stable within 10-4 Ryd. For the integrations in the Brillounin zone, we use 6 × 6 × 6, 6 × 5 × 9 and 7 × 7 × 4 mesh parameter grid for Fm3¯m, Pnam and P63/mmc, respectively. The calculated total energies as function of primitive cell volumen are fitted to the Birch- Murnaghan equation of state 27.

The electronic and optical properties were calculated using Tran-Blaha-modified Becke-Johnson (TB-mBJ) semilocal potential 28. This potential has been proven to give the more accurate band gap than LDA and GGA potentials, its results can be compared with those of hybrid functionals. The advantage of TB-mBJ is that it is computationally cheaper.

The linear optical properties of materials can be understood by means of the frequency dependent complex dielectric function ϵω=ϵ1 ω + iϵ2 ω. The imaginary part of this complex dielectric function was calculated using the method described in detail by Claudia et al.29, while the real part can be obtained from imaginary part using the Kramer-Kroning relationship 30. The optical responses as optical conductivity, refractive index, absorption coefficient, energy loss function and reflectivity can be derived from the dielectric function of material as continuation:

σ(ω)=ω4πϵ2 (1)

n(ω)=(ϵ12+ϵ22)1/2+ϵ12 (2)

α(ω)=2kωc (3)

L(ω)=-Im(ϵ-1)=ϵ2ϵ12+ϵ22 (4)

R(ω)=(n-1)2+k2(n+1)2+k2 (5)

where, the extinction coefficient:

k(ω)=(ϵ12+ϵ22)1/2-ϵ12 (6)

It is worth mentioning that in the optical calculations, we used the k-mesh much denser than that in structural and electronic calculations.

3. Results and discussions

3.1. Geometry optimization and phase transition

In the Fm3¯m structure, the Sr2+ and F- ions are located at (0, 0, 0) and (0.25, 0.25, 0.25), respectively. The P63/mmc hexagonal structure can be described as an orthorhombic structure with Sr2+ and F- occupy special atomic positions, Sr (1/3, 2/3, 1/4), F1 (0, 0, 0) and F2 (2/3, 1/3, 1/4) 12. Unlike the two mentioned structures which can be obtained with just lattice constants (a for Fm3¯m, a and c for P63/mmc), the Pnam structure requires, besides lattice constants, internal parameters u and v for the Sr2+ and two F- independent ions which are at (u, v, 0.25) positions. The results obtained from our calculations and from other experimental and theoretical works are listed in Table I for comparison, it is observed good consistency between the shown results.

Table I. Lattice constants a, b, c (Å), internal parameters u, v, bulk modulus B (GPa) and its pressure derivative B’ of Fm3¯m, Pnam and P6 3/mmc phases for SrF2 with other experimental and theoretical results. 

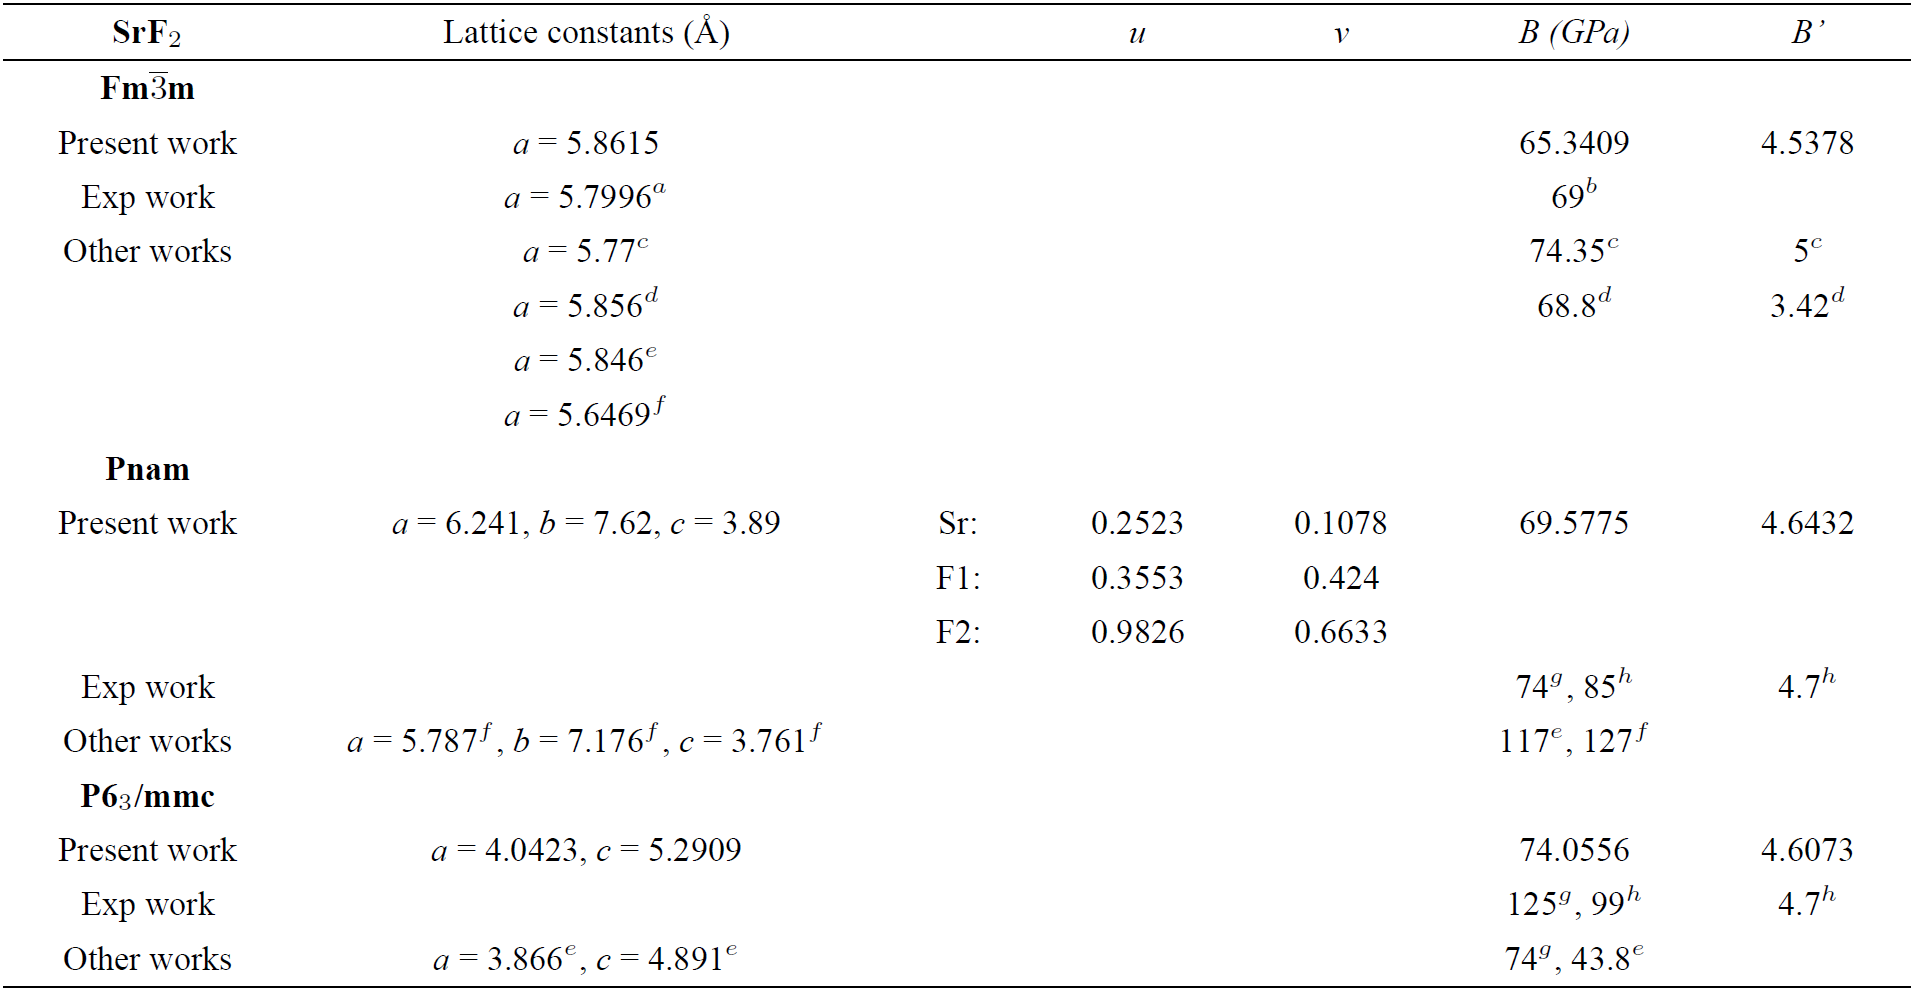
aRef. 31, bRef. 32, cRef. 6, dRef. 5, eRef. 24, fRef. 23, gRef. 11, hRef. 7.

There are two ways to determinate the transition pressure: the first is calculating the total energy curves of the two relevant phases to find out the common tangent, but this is difficult to give an accurate result 12, and the second is to calculate Gibbs free energy, the stable phase is one with lowest Gibbs free energy. In thermodynamic, the relation:

G=E+PV-TS (7)

is well known. Since, the theoretical calculations were performed at zero temperature, then free Gibbs energy equals to the enthalpy:

H=E+PV (8)

Hence, the intersection of enthalpy versus pressure curve determines the transition pressure.

In the Fig. 1, we plot the calculated enthalpy difference of Fm3¯m, Pnam and P63/mmc structure of SrF2 to that of Fm3¯m structure as a function of pressure. As observed, below 5.8 GPa, Fm3¯m is energetically favorable structure in comparison with Pnam, this indicates that at 5.8 GPa, occurs the first phase transition of SrF2, this result agrees well with the experimental 7,11 and previous theoretical 22,23,24 works. While the second transition would take place at 24.8 GPa because from this pressure, P63/mmc is stable structure due to its lowest enthalpy. This predition do not match well with experimental 7,11 and theoretical 24 results. Some of the differences in phase transition pressures between experiment and theory may reflect thermal effects. More critical to accuracy of these predicted transition pressures is the similarity between the calculated entalpy of cotunnite and Ni2In-type phases. A small elthalpy difference between these structures over a wide transition pressure makes the transition pressure particularly sensitive to error in computational parameters 11.

Figure 1. Enthalpy difference of considered phases with respect to Fm3¯m structure enthalpy as a function of pressure. 

Our calculations show that the volumen of SrF2 decreases 13.6% at the first transformation pressure, this result overestimates a littile the experimental one that is 8-10% 11, and at the second transition pressure, there is no remarkable change in volumen that agrees well with the results obtained in previous work 24 but underestimates the experimental result that is approximately 5%.

In the Fig. 2, we show the calculated lattice constants as a function of pressure, it is noted that the lattice constants of three structure decrease as pressure increases, and there is no notable difference of compressibility in the x, y, z directions of Pnam and P63/mmc structures.

Figure 2. Lattice constants of Fm3¯m, Pnam and P6 3/mmc of SrF2 as a function of pressure. 

3.2. Electronic properties

The Fig. 3 shows the band structures of SrF2 obtained at ambiente and high pressures. It is observed that the top of valence band is at X, Γ and Γ points, while the bottom of conduction band is at Γ, Γ and K for Fm3¯m, Pnam and P6 3 /mmc, respectively. This result is consistent with that obtained for CaF216 and BaF218. The calculated indirect X-Γ energy gap for Fm3¯m at 0 GPa pressure is 10.79 eV, this agrees very well with experimental value of 10.6 eV 33.

Figure 3. Energy band structure of SrF2 at several pressures. (a) 0 GPa, (b) 20 GPa, (c) 50 GPa, (d) 210 GPa. 

The calculated energy band gap of SrF2 within pressure range from 0 to 50 GPa is shown in the Fig. 4. The band gap of cubic and orthorhombic structures increases as pressure increasing, but there is a drop of 0.88 eV of band gap at the first transiton pressure, this result was not observed in previous calculation 24, otherwise, before the second transition, our calculation does not indicate the reduction of band gap of Pnam structure as observed in 24 and for CaF216 and BaF218, this is maybe due to our calculated second transition pressure is much smaller than that obtained in 24, because we observe a saturation in band gap of Pnam structure between 28 y 30 GPa. In other hand, there is a collapse of 2.56 eV at the second transition pressure, and the band gap of P63/mmc decreases as pressure increases, but we do not observe metallization up to 210 GPa.

Figure 4. Energy gap of SrF2 as a function of pressure. 

In order to analyze the electronic properties of SrF2, we have also calculated the partial density of state (PDOS) of constituent atoms Sr y F, that is shown in the Fig. 5. The peak at about -23 eV of lowest valence band is mainly derived from s state of F, while p state of Sr dominates the middle band of valence band at about -14 eV and the highest region of valence band is consituted mainly of p state of F. The conduction band at aproximately 11 eV arises mainly from the d state of Sr and the decrease of energy gap of P63/mmc as pressure increases is due to the drop of conduction band consisted of d state of Sr.

Figure 5. Partial density of states of Sr and F at several pressures. 

3.3. Optical properties

We have carried out the calculations of dielectric function and other linear optical properties are derived from this.

The dielectric function describes what an electric field such as an oscillating light wave does to material. The quantity ϵ1 ω represents how much a material becomes polarized when an electric field is applied due to creation of electric dipoles in the material while ϵ2(ω) represents the absorption of material. Figure 6 illustrates the absortion coefficient, imaginary and real parts of dielectric function as a functions of photon energy. The material is transparent when the imaginary part is zero, the value of this data becomes nozero when the absortion starts. Our calculation shows that at given pressure, the absortion starts at a photon energy between 8 and 11 eV that indicates transparent character of SrF2 at infrared, visible and near ultraviolet, in order pressure increases, the absortion starts at smaller energy as the plot shifts towards smaller energy region, this is consistent with calculated band gaps above. Otherwise, at given pressure, there are two wide absorption bands centered at about 15 eV and 25 eV.

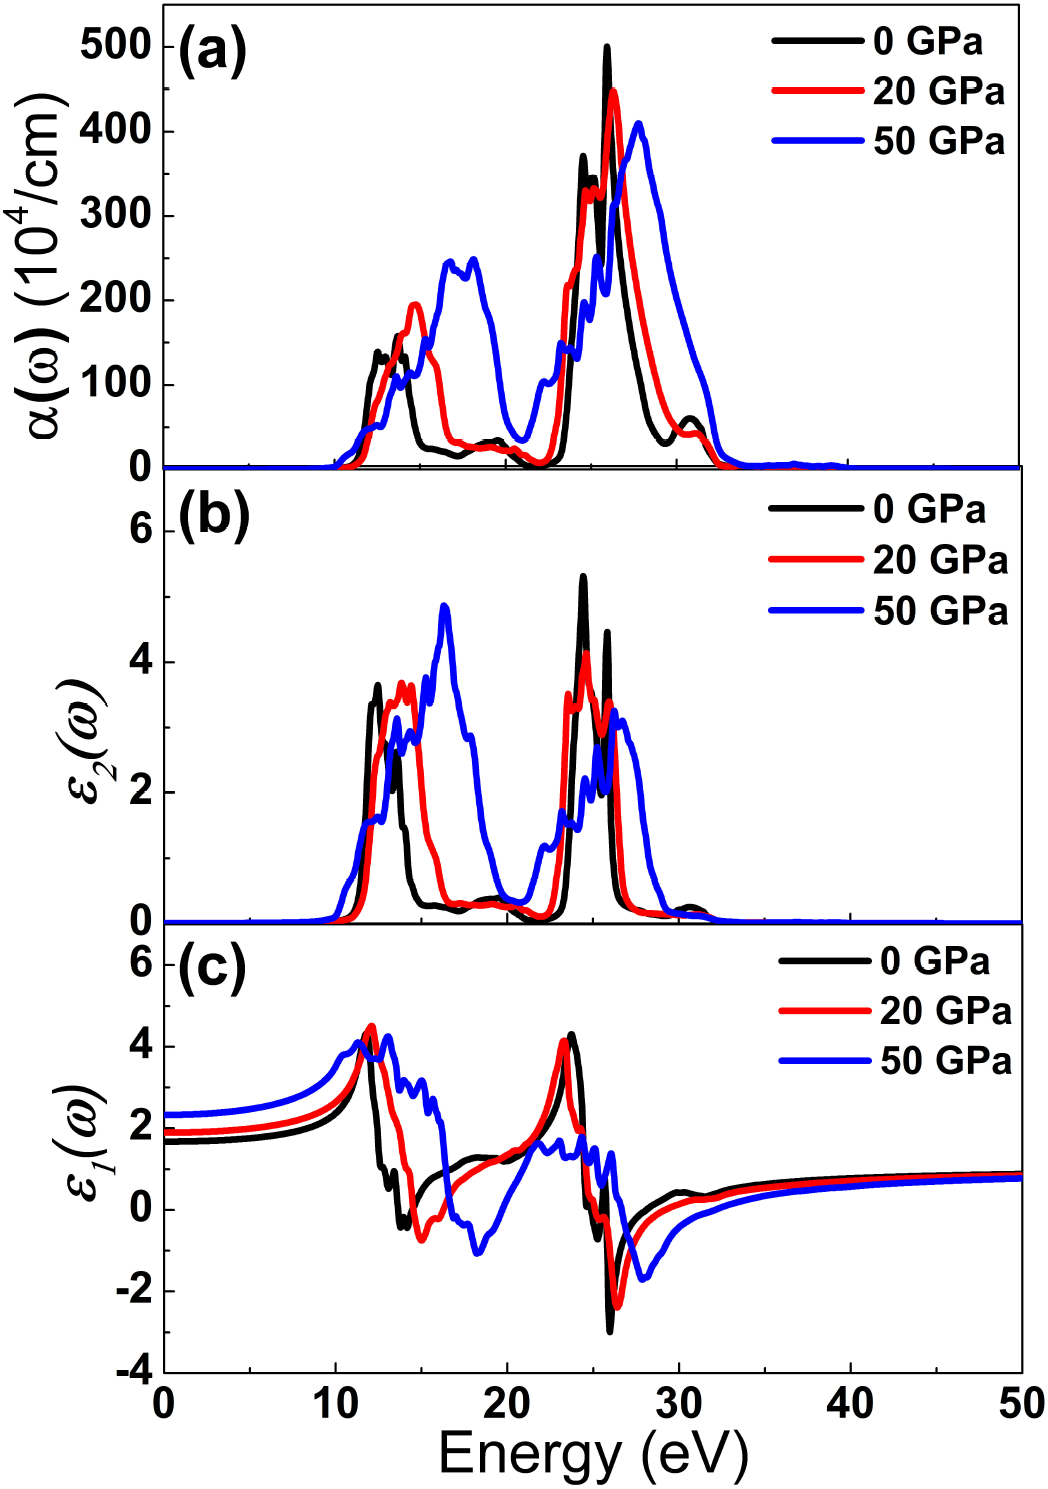
Figure 6. Optical functions (a) absorption coefficient, (b) imaginary and (c) real part of dielectric function as a function of energy at several pressures. 

The refractive index determines how much light is bent, or refracted, when entering a material. The Fig. 7(a) shows refractive index as a function of photon energy, it is observed that this data is stable at energies smaller than 5 eV and higher than 40 eV and has oscillating behavior between this values. Generally, up to 16 eV, the refractive index increases as pressure increases and from this photon energy, there is contrary behavior. The Fig. 7(b) illustrates the reflectivity as a function of photon, at given pressure, SrF2 practically reflects no light with energy smaller than 9 eV and higher than 38 eV and region near 20 eV, SrF2 becomes good reflective material in two regions, the first is between about 10 eV and 18 eV, and the second from 25 eV up to 33 eV. The compounds with high reflectivity in the high energy region can be used as a good coating material to avoid solar heating. It is noted that the reflectivity increases as pressure increases.

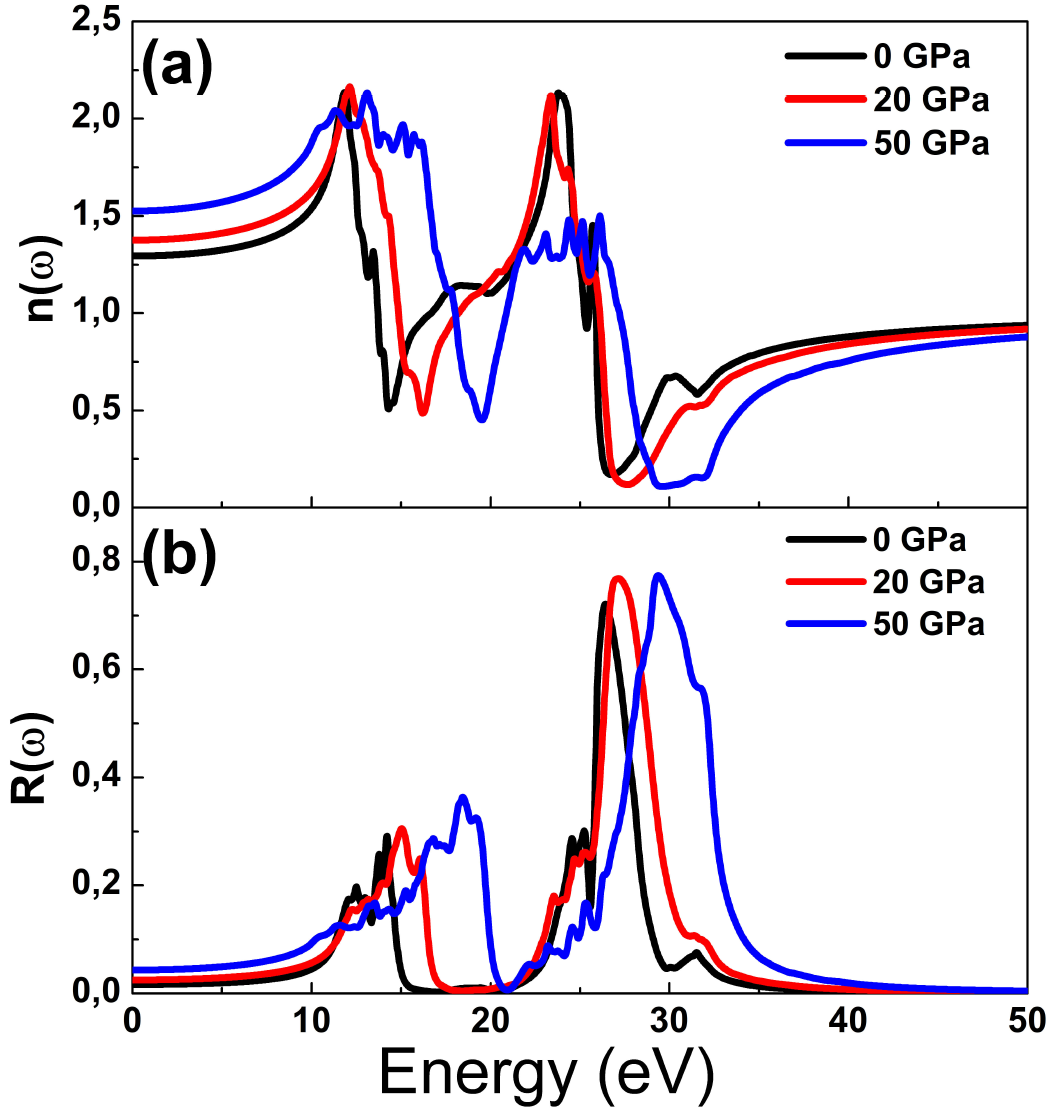
Figure 7. Optical functions (a) refractive index, (b) reflectivity as a function of photon energy at several pressures. 

The photoconductivity spectra of SrF2 is shown in the Fig. 8(a), the photoconductivity starts at about 10 eV that, one more time the transparent nature of the studied material is confirmed. And the Fig. 8(b) plots the energy loss as a function of energy, there two peaks at given pressure, and we attribute these energy losses to emision of phonons. Of course, as pressure increases, the energy loss occurs at higher energy because it need more energy for generating phonons due to the reduction of atomic distance at high pressure.

Figure 8. Optical functions (a) conductivity, (b) energy loss function as a function of photon energy at several pressures. 

4. Conclusions

We have made structure optimization of Fm3¯m structure and high pressure phases Pnam and P63/mmc of SrF2, and we predicted the first and second order phase transition of SrF2 occur at 5.8 GPa and 24.8 GPa, respectively, our results agree well with other availabe experimental and theoretical works. The electronic calculations shows the indirect band gap X-Γ and Γ -K of Fm3¯m and P63/mmc phases, respectively, and direct Γ-Γ of Pnam phase. The valence band of the three studied structures arises mainly from s y p states of F and p state of Sr, while d state of Sr dominates the conduction band. There is a drop of 0.88 eV in band gap at first transition pressure and 2.56 eV at second transormation pressure. The band gap of Fm3¯m and Pnam structures increases as pressure increases, while that of P63/mmc decreases as pressure increases but it was not observed the metallization up to 210 GPa. The calculated optical properties show that SrF2 is optically transparent in infrarred, visible and near ultraviolet, and is a good candidate for avoiding solar heating at high energy. The material becomes more absorbent and there is less energy loss as pressure increases.

Acknowledgement

Authors thanks to the Cuerpo Académico Física Computacional de la Materia Condensada of IFUAP for the access to the Laboratorio Nacional de Supercómputo del Sureste de México for making the calculations. D. M. Hoat is grateful to the Consejo Nacional de Ciencia y Tecnología de México (CONACyT) for the doctoral fellowship CVU 640142.

References

1. X. Zhang, Z. Quan, J. Yang, P. Yang, H. Lian and J. Lin, Nanotechnology. 19 (2008) 075603. [ Links ]

2. T. Tomiki and T. Miyata, J. Phys. Soc. Jpn. 27 (1969) 658-678. [ Links ]

3. M. Tada, S. Fujihara, and T. Kimura, J. Mater. Res. 14 (1999) 1610. [ Links ]

4. M. Merawa, M. Llunell, R. Orlando, M. Gelize-Duvignau and R. Dovesi, Chemical Physics Letters. 368 (2003) 7-11. [ Links ]

5. R. Khenata et al., Eur. Phys. J. B. 47 (2005) 63-70. [ Links ]

6. M. Jibran, G. Murtaza, M.A. Khan, R. Khenata, S. Muhmmad, Roshan Ali, Computational Materials Science. 81 (2014) 575-581. [ Links ]

7. J.S. Wang et al., Journal of Solid State Chemistry. 186 (2012) 231-234. [ Links ]

8. R. Shendrik, E.A. Radzhabov, A.I. Nepomnyashchikh, Radiation Measurements. 56 (2013) 58-61. [ Links ]

9. M. Maghrabi and P.D. Townsend, J. Phys.: Condens. Matter, 13 (2001) 5817-5831. [ Links ]

10. N. Rakov and G.S. Maciel, J. Mater. Chem. C. 4 (2016) 5442-5447. [ Links ]

11. S.M. Dorfman, et al.,Physical Review B. 81 (2010) 174121. [ Links ]

12. Yuan-Yuan Qi, Yan Cheng, Min Liu, Xiang-Rong Chen and Ling-Cang Cai, Physica B. 426 (2013) 13-19. [ Links ]

13. X.W. Sun, Y.D. Chu, Z.J. Liu, Q.F. Chen, Q. Song and T. Song, Physica B. 404 (2009) 158-162. [ Links ]

14. J.S. Wang et al., Phys. Status Solidi B. 248 (2011) 1115. [ Links ]

15. X. Wu, S. Qin and Z.Y. Wu, Phys. Rev. B. 73 (2006) 134103. [ Links ]

16. H. Shi, W. Luo, B. Johansson and R. Ahujia, J. Phys.: Condens. Matter . 21 (2009) 415501. [ Links ]

17. J.M. Leger, J. Haines, A. Atouf, and O. Schulte, Phys Rev B Condens Matter. 52(18) (1995) 13247-13256. [ Links ]

18. Xiaocui Yang, Aimin Hao, Xiaoming Wang, Xin Liu and Yan Zhub, Computational Materials Science . 49 (2010) 530-534. [ Links ]

19. V. Kanchana, G. Vaitheeswaran and M. Rajagopalan, J. Alloys Compd. 359 (2003) 66. [ Links ]

20. H.T. Jiang, R. Pandy, C. Darrigan and M. Rérat, J. Phys.: Condens. Matter . 15 (2003) 709. [ Links ]

21. G.A. Kourouklis and E. Anastassakis, Phys Rev B: Condens Matter. 34 (1986) 1233-1237. [ Links ]

22. E. Francisco, M.A. Blanco and G. Sanjurjo, Physical Review B . 63(9) (2001) 094107. [ Links ]

23. V. Kanchana , G. Vaitheeswaran andM. Rajagopalan , Physica B. 328 (2003) 283-290. [ Links ]

24. HAO Ai-Min, Yang Xiao-Cui, LI Jie, Xin Wei, Zhang Su-Hong, Zhang Xin-Yu and Liu Ri-Ping, Chin. Phys. Lett. 26 (2009) 077103. [ Links ]

25. P. Blaha, K. Schwarz, P. Sorantin, and S.B. Trickey, Comput. Phys. Commun. 59 (1990) 399. [ Links ]

26. J.P. Perdew, K. Burke and M. Ernzerhof, Phys. Rev. Lett. 77 (1996) 3865. [ Links ]

27. F.D. Murnaghan, Proc Natl Acad Sci U S A. 30 (1944) 244-247. [ Links ]

28. F. Tran andP. Blaha , Phys. Rev. Lett. 102 (2009) 226401. [ Links ]

29. C. Ambrosch-Draxl and J. Sofo, Comp. Phys. Commun. 175 (2006) 1. [ Links ]

30. J.S. Toll, Phys. Rev. 104 (1956) 1760-1770. [ Links ]

31. Ralph W.G. Wyckoff, Crystal structures. 2nd edn. 1 (Interscience Publisher, New York. 1982). [ Links ]

32. G.A. Samara, Phys. Rev. B. 13 (1976) 4529. [ Links ]

Received: April 21, 2017; Accepted: November 08, 2017

Creative Commons License This is an open-access article distributed under the terms of the Creative Commons Attribution License