


 text new page (beta)
 English (pdf)
 Article in xml format
 Article references
 Send this article by e-mail
 Cited by SciELO
  Similars in
SciELO
Similars in
SciELO 
 Permalink
1. Introduction
Blood glucose level is an important indicator of diabetes mellitus, statistics show that nine out of ten adults, aged 25 years old and older, had blood glucose over the recommended limits1. Raised blood glucose is an indicator of diabetes mellitus. Due to diabetes, can lead to several health risks like: strokes, renal failure, lower limb amputations, visual impairment, blindness, and most of those health problems are irreversible, early diagnosis is important. As part of prevention and early diagnosis of this disease, it is necessary to carry on research on effective ways to measure small variations in glucose concentration in solutions, as first step, to develop a measurement system to determine glucose concentration in blood, in this sense several methods to measure glucose concentrations have been developed2-4.
In order to add new ways to perform glucose concentration measurements photothermal (PT) techniques are proposed, PT techniques have been used to detect small concentrations of some compound in solution and, are cheaper than other techniques with the same or even less resolution5-9. PT techniques are based on the analysis of thermal waves, induced by a frequency modulated a light source, traveling through a layered system in which a thermal wave detector and the sample under analysis are slabs, when thermal wave detector is a pyroelectric material then it is so-call photopyroelectric (PPE) technique.
Depending on selected configuration PPE methods are able to provide several sample features as optical absorption spectra10, nonradiative relaxation process11 and, thermal properties12,13. In the present study, the so-called back (BPPE) and inverse (IPPE) photopyroelectric configurations, both based on PPE detection, are used to determine thermal diffusivity and thermal effusivity of glucose-water mixtures.
In the IPPE configuration, the thermal effusivity (𝑒) of samples can be obtained, in this case, frequency modulated light impinges on one side of a pyroelectric detector which has the liquid sample on the other side, in such a way that sample acts as heat dissipater for thermal waves originated at the pyroelectric detector. By other hand, to obtain the sample thermal diffusivities the BPPE configuration was used, in this configuration, the sample is enclosure between the pyroelectric detector and a metal sheet acting as thermal wave generator due to the absorbed light. The liquid sample allows conducting the thermal waves to the pyroelectric sensor where a PPE signal is generated and processed by the lock-in amplifier.
2. Experimental
2.1 Samples preparation
Aqueous solutions were prepared by mixing D-glucose (Baker analyzed 99.9% pure) and bi-distilled water, different concentrations were prepared. Adequate glucose quantities (x% w/v) were diluted into 90 ml of bi-distilled water, to obtain complete dissolution samples were magnetically stirred for 10 minutes at room temperature, all measurements were carried on at room temperature.
2.2.1 IPPE setup
Experimental setup used to obtain sample thermal effusivity (es),
is named IPPE Fig. 1. In this setup, the
sample is placed in a container, over the pyroelectric detector, while modulated
light strikes on the bottom side of the detector. The PPE signal, of the PVDF
detector (9 μm thick and thermal effusivity
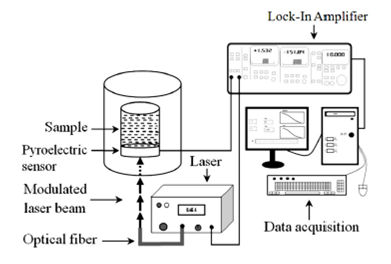
Figure 1 IPPE experimental setup for thermal effusivity measurements, the sample under analysis is placed over the pyroelectric detector.
For frequencies that leads to a thermally thick sample (i.e.
where
To warranty the modulated heat wave reaches the sample, the pyroelectric detector must remain thermally thin thus low frequencies are preferred, thus the high-frequency limit needs
to be calculated, the frequency at which pyroelectric detector becomes thermally thick is defined by:
Having pyroelectric thermal diffusivity value of
By fitting the Eq. (1) to the experimental data, for the IPPE geometry, it is possible to obtain the sample thermal effusivity. Furthermore, to avoid the pyroelectric sensor signal dependence on the light modulation frequency, the obtained 𝑉(𝜔) signal was normalized with the empty PPE cell signal.
2.2.2 BPPE configuration
BPPE configuration is formed by a chamber of variable length (𝑙) containing the liquid sample; the cavity is formed by a circular Cu foil 100 𝜇m thick and, Lanthanum modified lead zirconate (PLZT) 756 micron thick as pyroelectric sensor. A laser diode beam, modulated by the internal oscillator of a lock-in amplifier, impinges on the black painted inner surface of the metallic foil, which acts as light absorber as showed in Fig. 2.
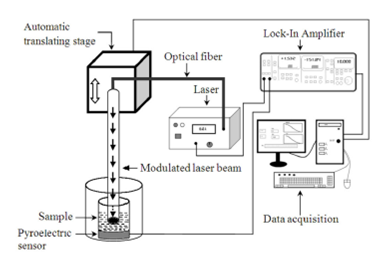
Figure 2 BPPE experimental setup for thermal diffusivity measurements, the sample is enclosed between the pyroelectric detector and a copper foil thus, the sample length can be varied.
As the modulated light strikes on the metallic foil, its temperature fluctuates periodically at the same modulation frequency of the incident beam; temperature oscillations at
where 𝐵 is a constant determined by the experimental conditions,
Dividing 4a by 4b
Where A is an arbitrary constant that depends on experimental conditions, Eq. (5) shows that the sample thermal diffusivity can be obtained from the slope of the logarithm of the normalized signal as a function of the square root of frequency, using
3. Results and discussion
Amplitude and phase, as a function of the light modulation frequency, obtained by IPPE technique are depicted in Fig. 3 for 0.7 mg/ml glucose concentration sample, solid line represents the result of carefully fitting using Eq. (1), having es as fitting parameter, ep was determined a priori, by using glycerol and water as reference samples.
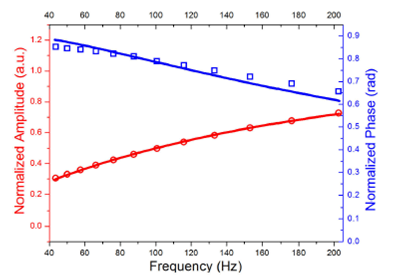
Figure 3 Example of the IPPE amplitude and phase signals as a function of the modulated frequency, solid lines represent the best fitting of Eq. (1) to the experimental data for a sample with 0.7 mg/ml glucose concentration.
Figure 4 shows the frequency dependence of the phase signal for 0.7 mg/ml glucose concentration sample, obtained by BPPE technique. The solid line represents the best fitting of the phase of Eq. (3) to the experimental data, using 𝛼 𝑠 as a fitting parameter, with 𝑙 𝑠 well controlled as mentioned.

Figure 4 BPPE normalized phase as a function of square root of the light modulation frequency for 0.7 mg/ml glucose concentration sample, obtained by BPPE configuration.
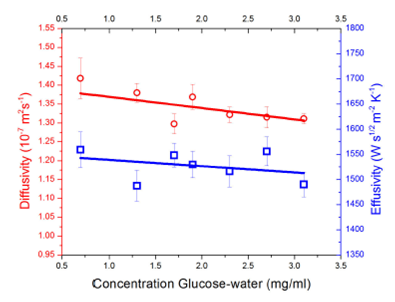
Performing a carefully fitting of Eq. (1) it is possible to get thermal effusivity values from frequency scan shown in Fig. 3, thermal diffusivity values were obtained similarly by fitting Eq. (5) to the experimental data shown in Fig. 4, Fig. 5 summarizes the obtained values as a function of glucose concentration as stated previously, solid lines are used as a reference to show tendency values. For thermal diffusivity, calculated values were obtained with a maximum of 2.7% of error.
In the case of the thermal effusivity, there is a slight decrease of this parameter when is increased the glucose concentration. As the thermal effusivity can be written as thermal conductivity divided by square root of the thermal diffusivity then, thermal effusivity diminish as result of the thermal conductivity and thermal diffusivity decrease15. In Fig. 5 it is possible to see the increase of the effusivity uncertainty after 1.5 mg/ml concentration. Dispersion data can be attributed due to the fitting process error. For this technique, the error is approximately the 3%. Despite the pointed increment, this deviation is in the nonstandard glucose region for humans. Therefore, the data dispersion does not play a significant role. Thermal diffusivity values present the same behavior as the thermal effusivity.
4. Conclusions
In the present study, the back (BPPE) and inverse (IPPE) photopyroelectric configurations were used to determine the thermal diffusivity and thermal effusivity of glucose-water mixtures. The experimental results show a decrease of the thermal diffusivity with increasing amount of glucose. In the case of thermal effusivity, the concentration dependence is roughly within the statistical uncertainty, even though this gives us the first sight on the behavior of glucose thermal properties as a function of concentration, to use thermal properties for determining glucose concentration.

