


 text new page (beta)
 English (pdf)
 Article in xml format
 Article references
 Send this article by e-mail
 Cited by SciELO
  Similars in
SciELO
Similars in
SciELO 
 Permalink
PACS: 78.67.Ch; 81.07.De; 81.15.Rs
1. Introduction
Transparent conducting films, TCFs, are electrically conductive in thin films they are widely used as a component of solar cells and many other optical electronic devices. Such films have been developed from different materials, including indium tin oxide, (ITO), tin oxide (SnO2), and zinc oxide (ZnO). According to several researchers 1,2,3,4,5,6,7,8,9,10 ITO is one of the most widely used transparent conducting oxides. Its popularity is mainly due to two good properties, one, its electrical conductivity, and the other, its optical transparency, in addition, it is ease to deposit as a thin film. However, ITO is the most expensive material because of the process of fabrication and the limited world reserves of indium. Recently, interest in developing TCFs on flexible materials has increased, and for this ITO is not viable because it is fragile and tends to break. As consequence, in the last few years the use of carbon nanotubes, CNTS, based TCFs have increased. This is in part because of the reduced cost, and higher flexibility.
There are several methods for manufacturing the CNTs including: electric arc discharge, laser evaporation/ablation and chemical vapour deposition (CVD). The oldest method for the carbon nanotube manufacturing is the electric arc discharge 11,12,13,14. This method was used in the early sixties by R. Bacon 15 for the synthesis of carbon fibres, that they called whiskers. In 1990 Krätschmer and Huffman used the method 16,17 to obtain fullerenes, and later the method was improved and extended for the synthesis of multiwall (MWCNT) and single wall (SWNT) carbon nanotubes.
The arc-discharge and laser-ablation techniques have limitations and purification of the product must be carried out to eliminate impurities. Another alternative is the chemical vapour deposition (CVD), with this method the nanotubes are produced by the decomposition of a carbon-containing gas in the presence of a catalyst. CVD method 18,19,20,21 is widely used to manufacture nanotubes because it is possible to obtain aligned CNTs of high purity, high density and in economical viable quantities. This method was originally developed in the 1960s and 1970s and has been successfully used for the production of carbon fibres and carbon nanofibres.
In this paper the fabrication and characterization of the transparent conducting films based on MWCNTs is presented.
2. Experimental
2.1. Fabrication, purification and characterization of the MWCNTs
To develop the transparent conducting films (TCF) the MWCNTs were fabricated using a CVD reaction of camphor and ferrocene in a nitrogen atmosphere, characterized and purified using various procedures 22,26,27.
The best experimental conditions had been established in previous studies and consisted of the use of a 38.4 mm interior diameter tube furnace temperature at 850°C, an evaporation temperature of 215°C for the 95 wt% camphor (96% Sigma-Aldrich) with 5 wt% ferrocene (98% Sigma-Aldrich) precursor mixture and a nitrogen (99.99% purity) gas flow of 100 ml/min at atmospheric pressure.
The MWCNTs were grown on 1.5 × 3 cm pieces of cleaned crystalline silicon, but the deposit formed on the interior wall of the alumina furnace tube was also collected and used. The MWCNT deposit on the silicon was mechanically removed for the characterization and the purification processes. One significant difference of our CVD setup to other reported systems is that a precursor injector was developed and used to prevent the condensation of the precursor vapour mixture before it was introduced to the hot region of the furnace, see Fig. 1.
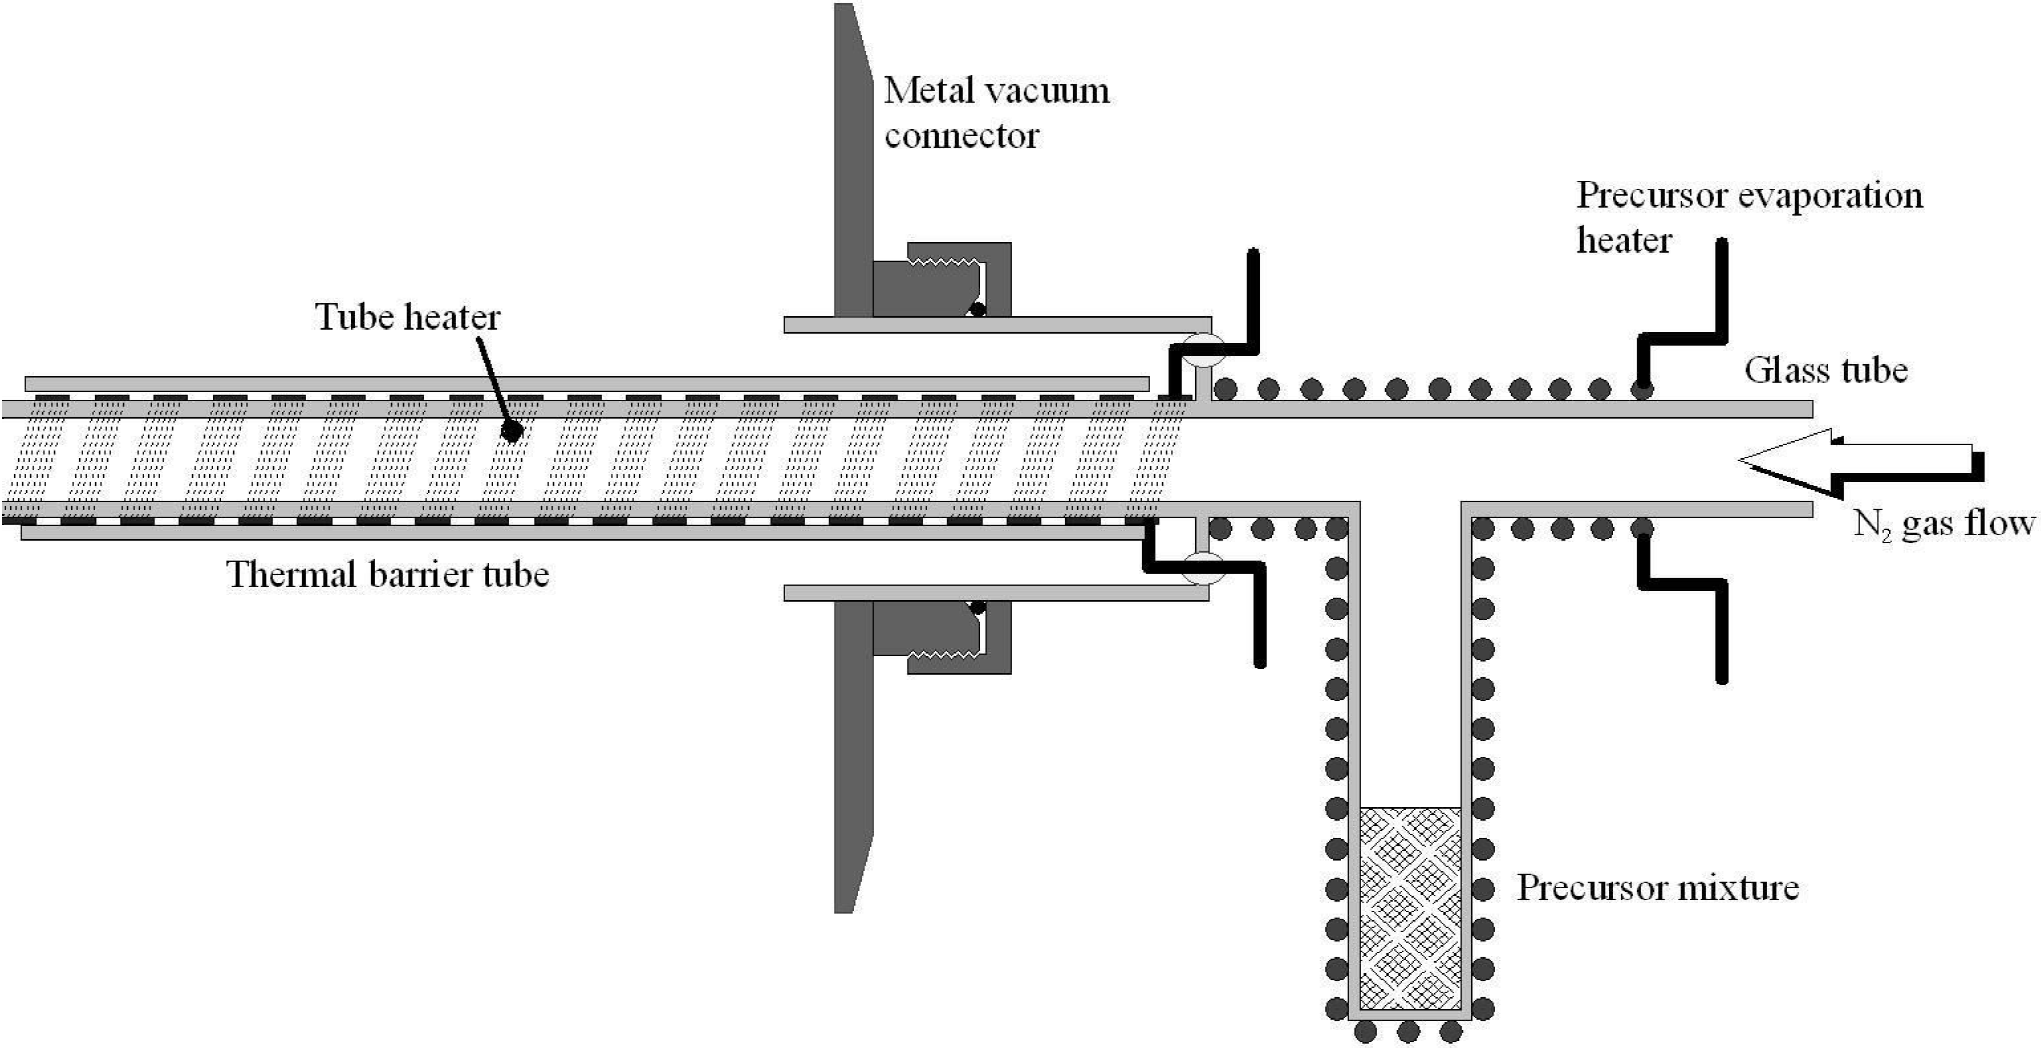
The injector and evaporation sections of the system can be heated independentally and tempertures of 225°C and 215°C, respectively, were used in these experiments. The length of the injector was sufficient to ensure that the exit is at a furnace temperature greater than 225°C, in this way the precurs vapour is always at a temperature greater than its boiling point (~175°C). The concentric outer tube, OT, and the inner thermal barrier tube ensured that the vacuum connector is sufficiently cool, < 60°C, to not suffer damaged during the experiment. The use of the injector assembly was found to significantly increase the production of MWCNTs and permit much better reproducibility in the experiments.
The collected material contained various types of impurities which could degrade the electrical and optical properties of the CNTs films. Therefore, we studied the purification of the deposit using three chemical procedures: a gas phase selective oxidation and two types of liquid phase selective oxidation. Initially, the MWCNTs samples were dispersed in either acetone or DI water (for the gas or liquid phase, respectively) and subjected to 60 minutes of room temperature ultrasonic bath agitation to separate the large a-C particles from the MWCNTs. Yu et al. 28 reported that longer times could cause significant fracture of the CNTs.
For the first purification method the acetone-MWCNT sample was dripped on a 70°C quartz plate to produce a dry solid deposit. This was then heated to 520°C in a 40 ml/min flow of air for 0.5, 1.5, 3.5 or 5 hrs. The material was then mechanical removed from the plates and mixed with hydrochloric acid. The mixture was placed in an ultrasonic bath for 1 min then left for 1 hr. to ensure as complete as possible removal of the iron particles. Finally, the majority of the acid on top of the precipitated MWCNTs was removed, DI water was added and again the excess liquid was removed after the MWCNTs had settled in the bottom of the recipient. This procedure was repeated three times after the sediment had dried, then ethanol was added and the agitated mixture was deposited on glass plates at 70°C, followed by a 30 min treatment in air at 120°C, this formula was used to make fully dry samples for the various characterization procedures.
The second purification method consisted of mixing 25 ml of the water-MWCNT sample with 160 ml of a 3.5% solution of hydrogen peroxide in DI water. This mixture was then subjected to ultrasonic agitation for 2 hrs. at 60°C, finally 100 ml of 38% HCl was added and the sample was left for 12 hrs. A dried solid sample was then prepared as in the case of the previous gas phase oxidation.
The third procedure was similar to the second process but 40 ml of the peroxide solution was added simultaneously with 20 ml of HCl. A dried solid sample was then prepared as for the other procedures.
Finally for all the sample types, the obtained material was heat treated at 340°C for 30 m.
The MWCNT samples were characterised using thermo-gravimetric analysis (TGA) performed in air with a flow rate of 40 ml/min using a heating rate of 10°C/min from 25 to 800°C, transmission electron microscopy (TEM), scanning electron microscope (SEM), energy-dispersion spectrometry (EDS), Raman spectroscopy, optical microscopy and X-ray diffraction.
2.2. Fabrication of the transparent conducting films
The starting point for fabrication the transparent conducting films (TCFs) based on the MWCNTs was the preparation of colloidal inks to facilitate the dispersion of the nanotubes when the glass substrates were spray coated. Three types of inks were used:
Isopropyl alcohol (IPA) (99.8% pure) with between 0.00056 - 0.00127%wt of MWCNTs.
Acetone (99.6% pure) with between 0.00056 - 0.284%wt of MWCNTs in a nitrocellulose-based varnish.
The acetone based colloid mixed in PMMA Poly (methyl methacrylate).
The different colloids were agitated in an ultrasonic bath for 50 min before being used to make the coatings.
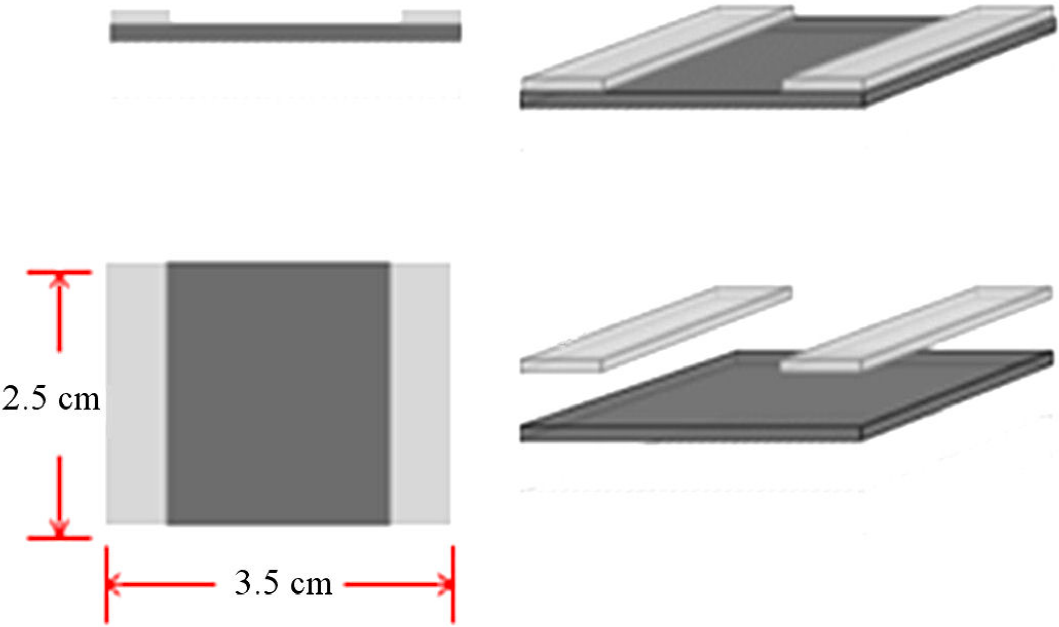
The transparent conducting films were prepared using a combination of spray and spin coating. The spray system consisted of an Adir Model 668 aerografo and the 3.5 × 2.5 cm. cleaned glass substrates were mounted on an in-house made system with an electric motor whose velocity could be controlled up to 15000 RPM. It was found that the optimum spray nozzle-to-substrate distance and the speed of rotation was different for the different liquids used for the colloids. The thickness of the TCFs could be controlled by the concentration of MWCNTs in the ink and the amount of ink (the spraying time) used to produce the coating. The polymer based inks gave good adhesion of the TCF’s to the glass substrates, and the IPA based one was found to give a worse but adequate adhesion.
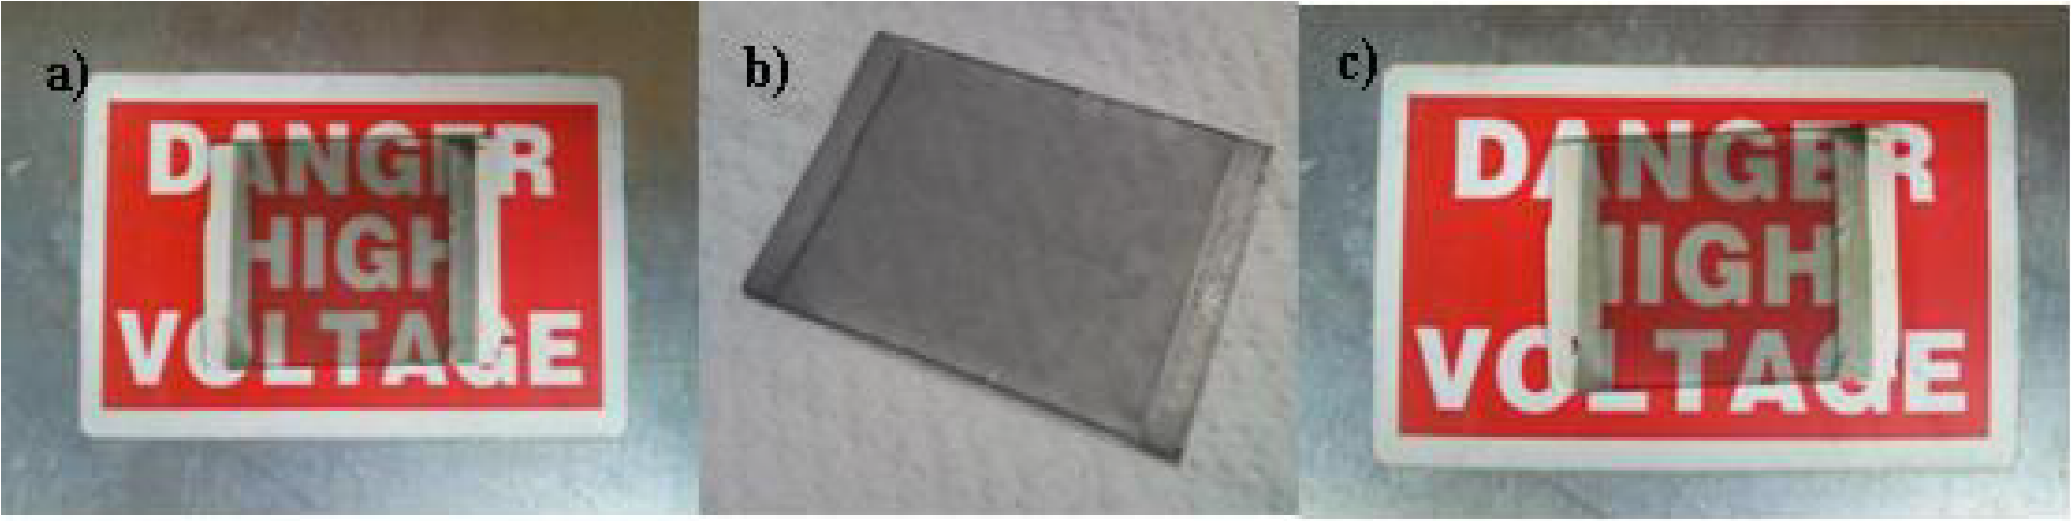
To facilitate the electrical measurements silver dag electrodes, 2.5 × 0.5 cm, were made on each edge of the coated substrates, see Fig. 2.
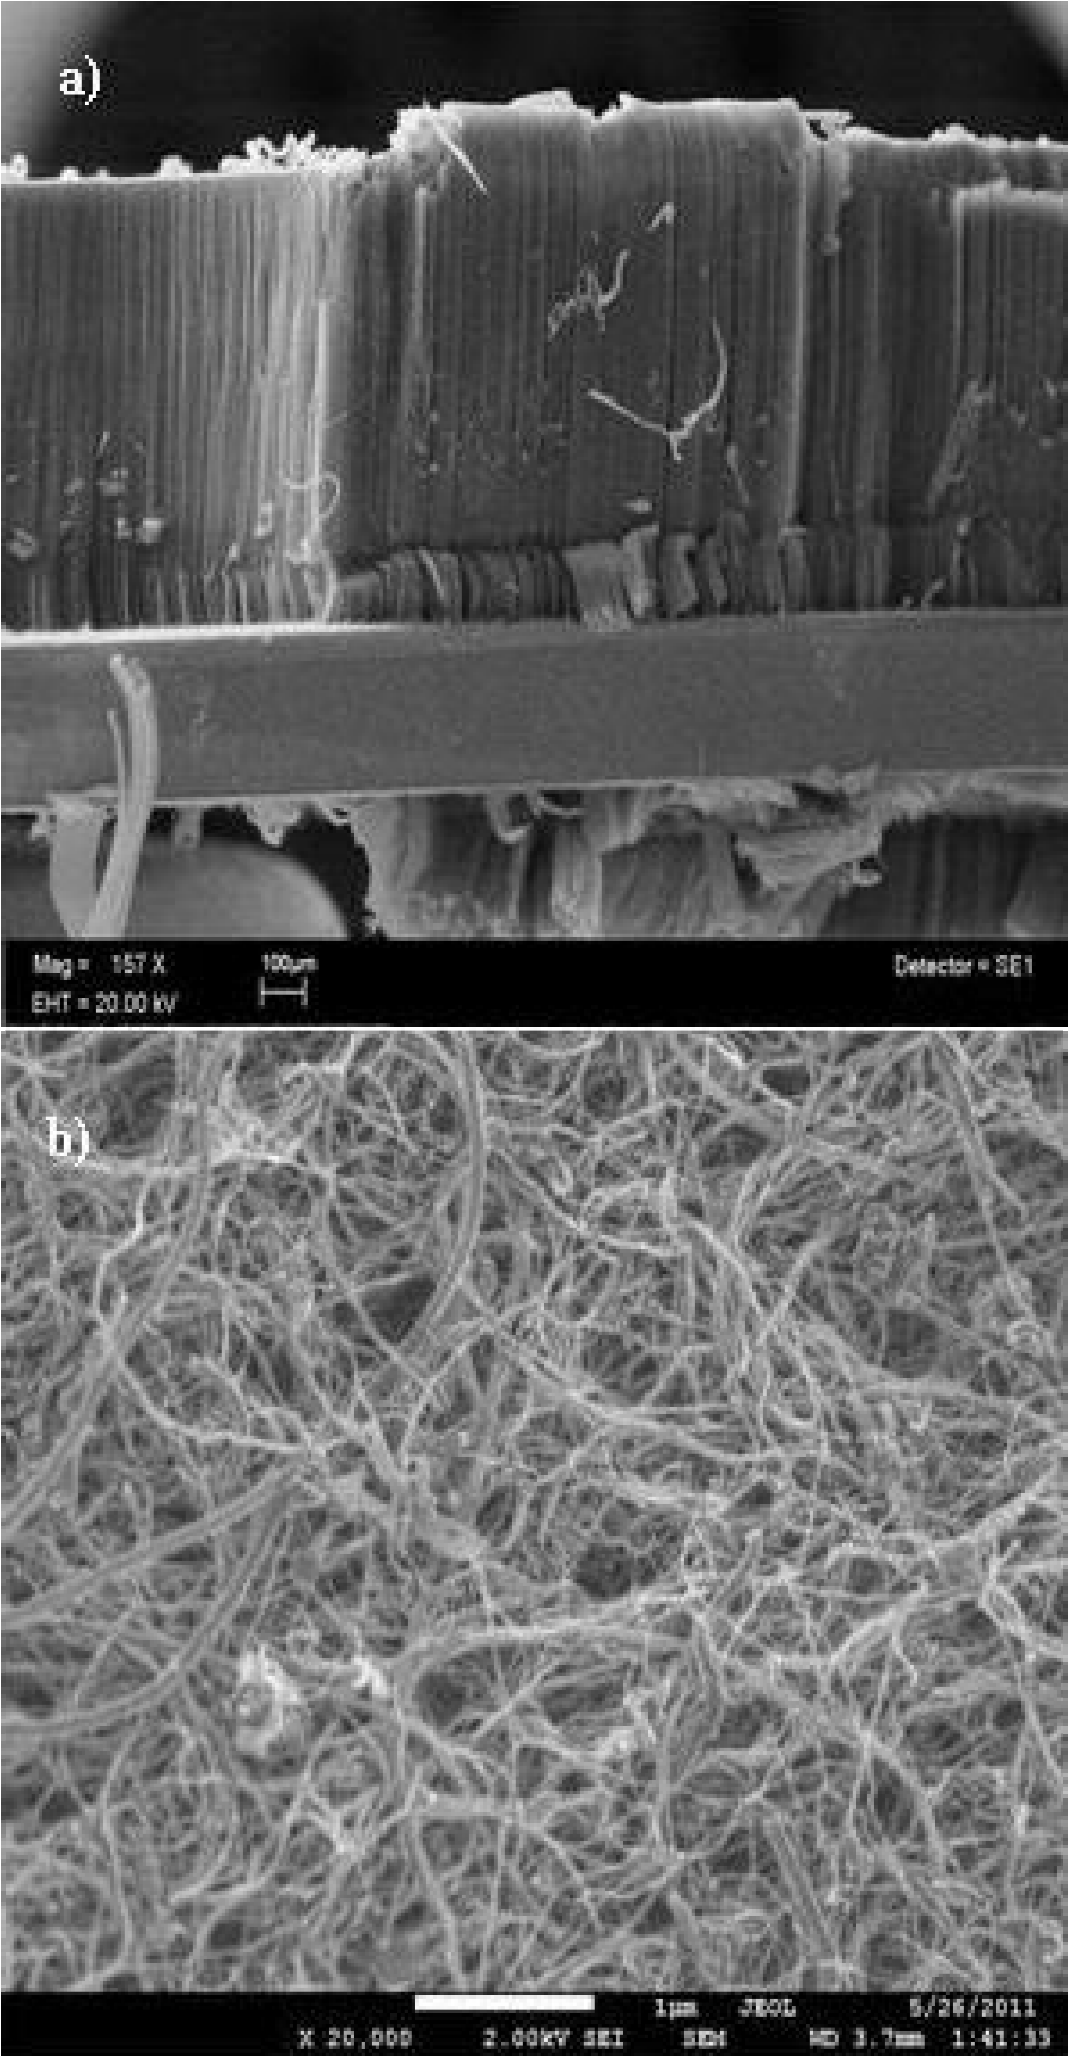
The characterization of the TCFs consisted of measurements of the sheet resistance, the optical transmission in the visible range using a Nicolet UV300 UV-visible spectrophotometer and the variation of the sheet resistance was measured as a function of the temperature from -110°C to 155°C at a pressure of 5 × 10⁻⁵ Torr. The Figs. 3a) and 3b) show micrographs of the MWCNTs grown on the silicon substrates and those collected from the furnace walls, respectively.
3. RESULTADOS
This study is made up of three interconnected stages; the production and treatment of the MWCNTs, the elaboration of the MWCNTs containing inks and finally the fabrication of the TCFs.
3.1. Characterization of the fabricated MWCNTs
Analysis of the SEM micrographs using the Imagefocus software indicated that the average length of the MWCNTs grown on the silicon substrate was 32
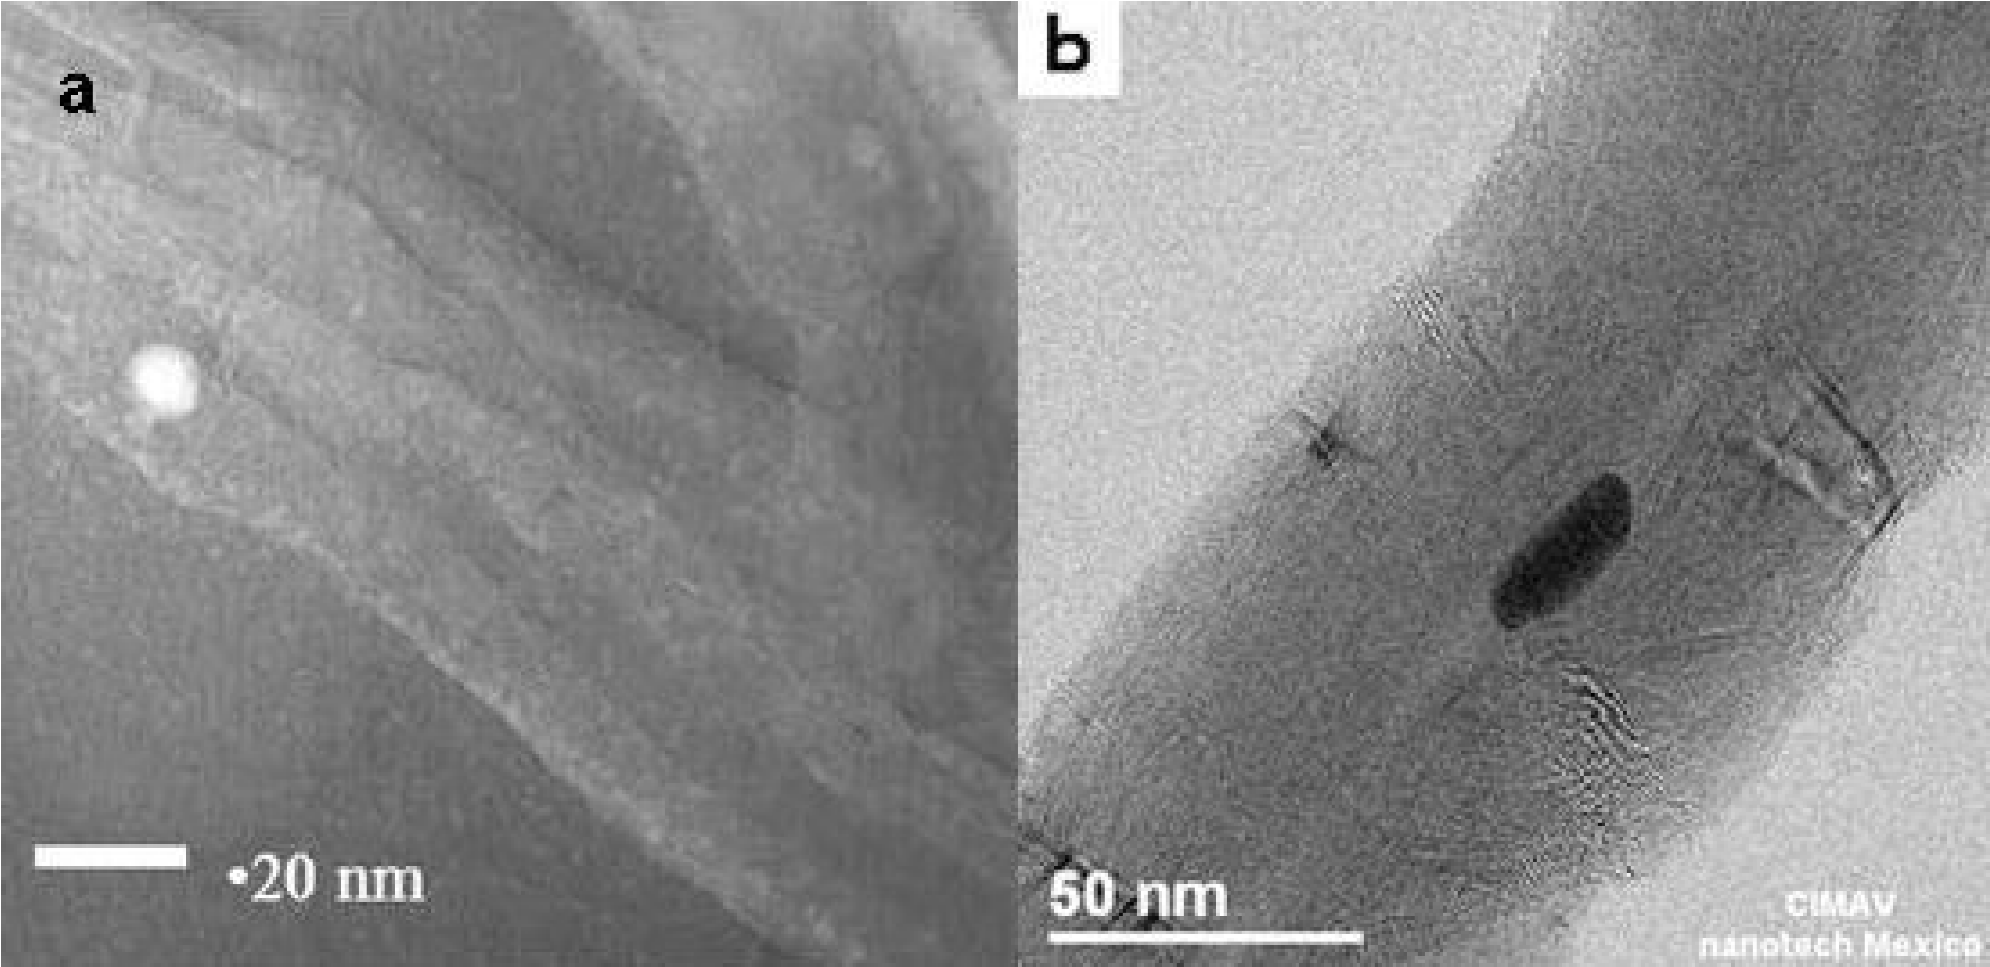
Figure 4. TEM micrographs: a) MWCNTs grown on the silicon substrates and those collected from the furnace walls, b) MWCNTs collected from the furnace walls.
Figures 4a) and 4b) show TEM micrographs of the MWCNTs grown on the silicon substrates and those collected from the furnace walls, respectively.
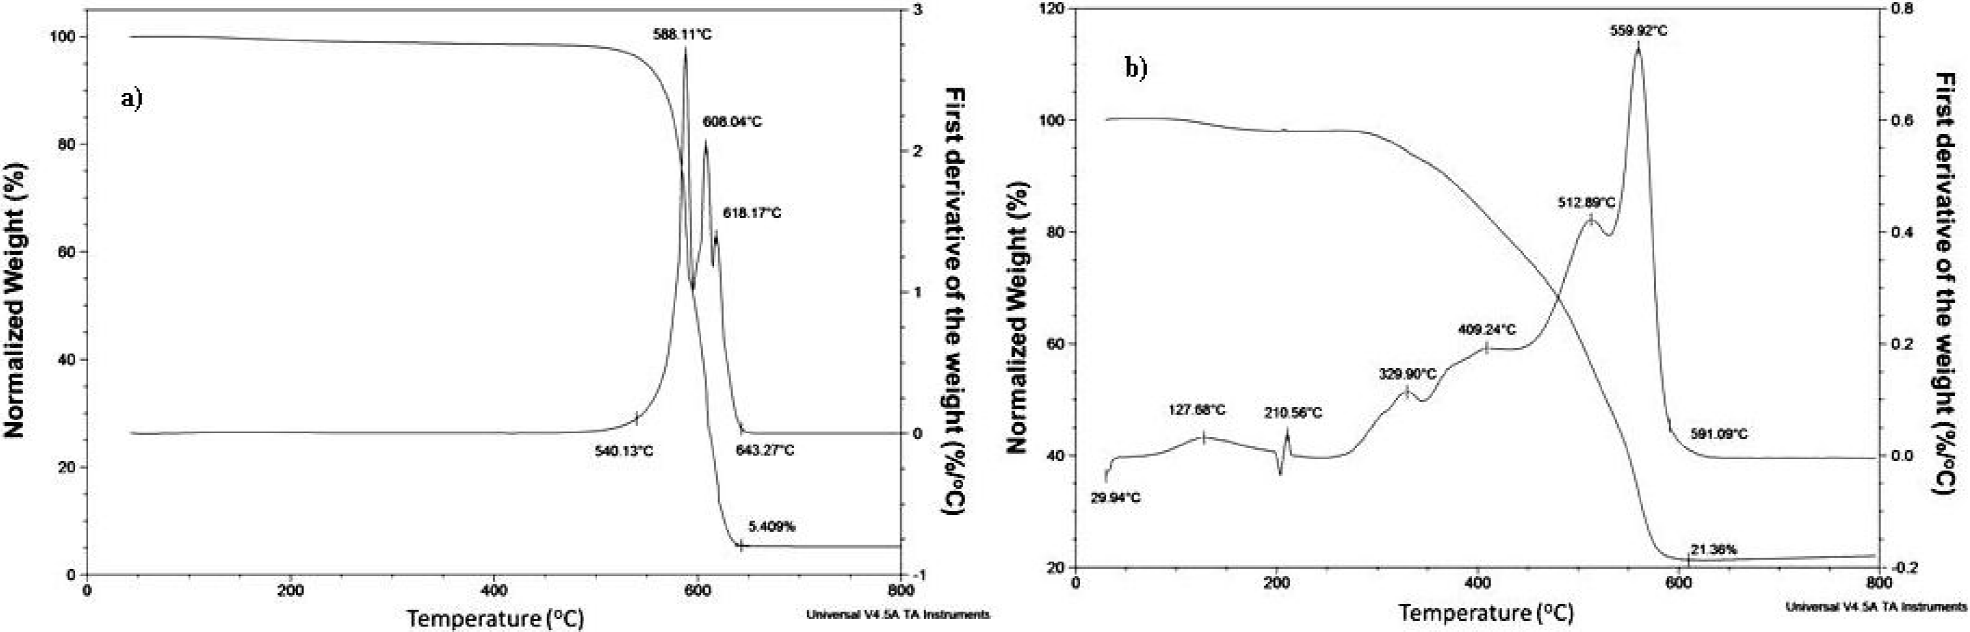
The Figs. 5a) and 5b) show the results of the TGA measurements for the silicon substrate and furnace wall MWCNTS, respectively. It can be clearly seen that the furnace wall deposit contained a much larger concentration of impurities. Furthermore, the residual mass (iron oxide) after heating the samples to 800°C in air, for the silicon substrate and wall deposits, was ~5%wt and ~22%wt, respectively. This indicated that much of the material seen on the outside layers of the MWCNTs was p|robable iron based compounds. The decomposition of the silicon substrate sample occurred at the temperatures of ~588 and ~608°C. For the furnace wall sample the main decomposition occurred at ~560°C.
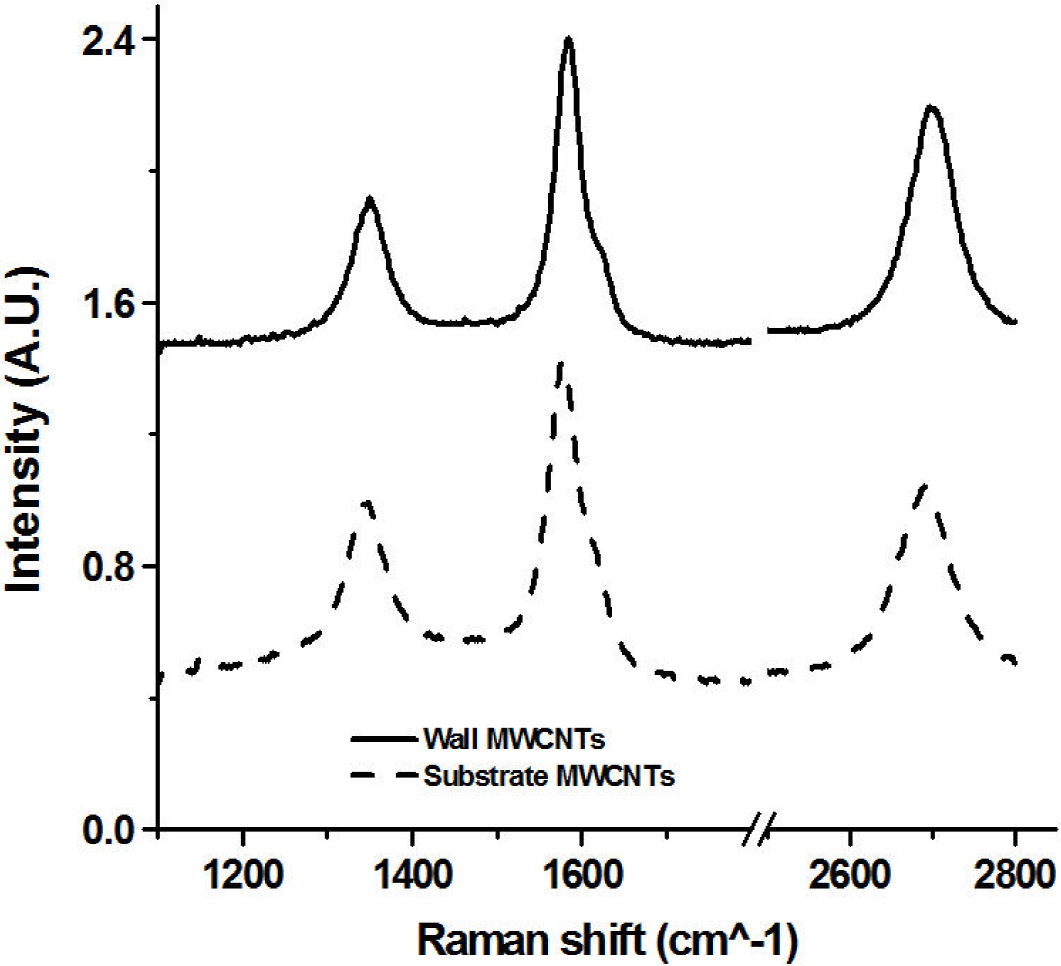
The majority of the Raman measurements were carried out in an apparatus that could register spectra of wavenumbers greater than 200 cm-1. A few measurements were made using a more sophisticated spectrometer at lower wavenumbers, but no evidence of the existence of radial breathing modes associated with single wall nanotubes was observed. The Raman spectra of both the silicon substrate and furnace wall samples were typical of MWCNTs, see Fig. 6. Three characteristic peaks were observed: the D band (~1350 cm-1), the G band (~1580 cm-1) and the G’ band (~2700 cm-1). The ratio of the intensity of the D/G, G’/G and G’/D peaks showed that the I(D/G)wall > I(D/G)Subs, I(G’/G)wall > I(G’/G)Subs and that I(G’/D)wall
3.2. Results of the refinement processes of the MWCNTs
The treatment of the MWCNTs was performed firstly to purify the samples by removal of the non-nanotube carbon products and the majority of the iron compounds, and secondly, to improve the dispersion of the MWCNTs during the TCF formation. Previous experiments had shown that an adequate mix of MWCNTs from the silicon substrates and the furnace wall was a mix 1:10 by weight.
The analysis by Raman, EDX, SEM, TEM and TGA techniques showed that the third purification process based on selective oxidation using a combination of H2O2 and HCl was the best treatment method of the MWCNTs. With this procedure up to 94% of impurities were eliminated, including amorphous carbon, graphite, and metallic compounds and particles. Both of the other methods eliminated approximately 86% of the impurities. Therefore, for the rest of this study we will only report the results of the MWCNTs purified using the third method.
3.3. Fabrication of the MWCNT thin films using the combined spray and spin coating techniques
The conducting thin films were fabricated from the MWCNT inks by a combination of spray and spin- coating. For this work the TCF films were prepared using both purified MWCNTs, by the second selective-oxidation method, and non-purified MWCNT inks.
To obtain a stable colloid (little or no sedimentation in 30 mins) with well-dispersed nanotubes, the best results were obtained using 0.00056%wt and 0.00127%wt of MWCNTs in acetone and isopropyl alcohol, respectively. The best adhesion between the MWCNTs films and the substrate, evaluated by rubbing the film with a Q-tip, was obtained with the rate of 1:100 of MWCNTs films in the nitrocellulose-based varnish. The optimum spraying distance to produce a uniform coating was 23 cm and 38 cm, respectively for the acetone-based and isopropyl alcohol inks, and the optimum spin velocity was determined to be 1300 rpm independent of the type of ink. Examples of various uniform TCF films are shown in Fig. 7.
3.4. Characterization of the surfaces of the MWCNTs films using SEM technique
The morphology analysed by SEM of the surfaces of the MWCNTs films fabricated from non-purified and purified inks based on isopropyl alcohol, are shown in Figs. 8a) and and 8b). It can be seen that the non-purified sample contains obvious particulate impurities but the nanotubes appear to be very similar in both samples. The sheet resistance of both samples was within the experimental error the same; approximately 3 k
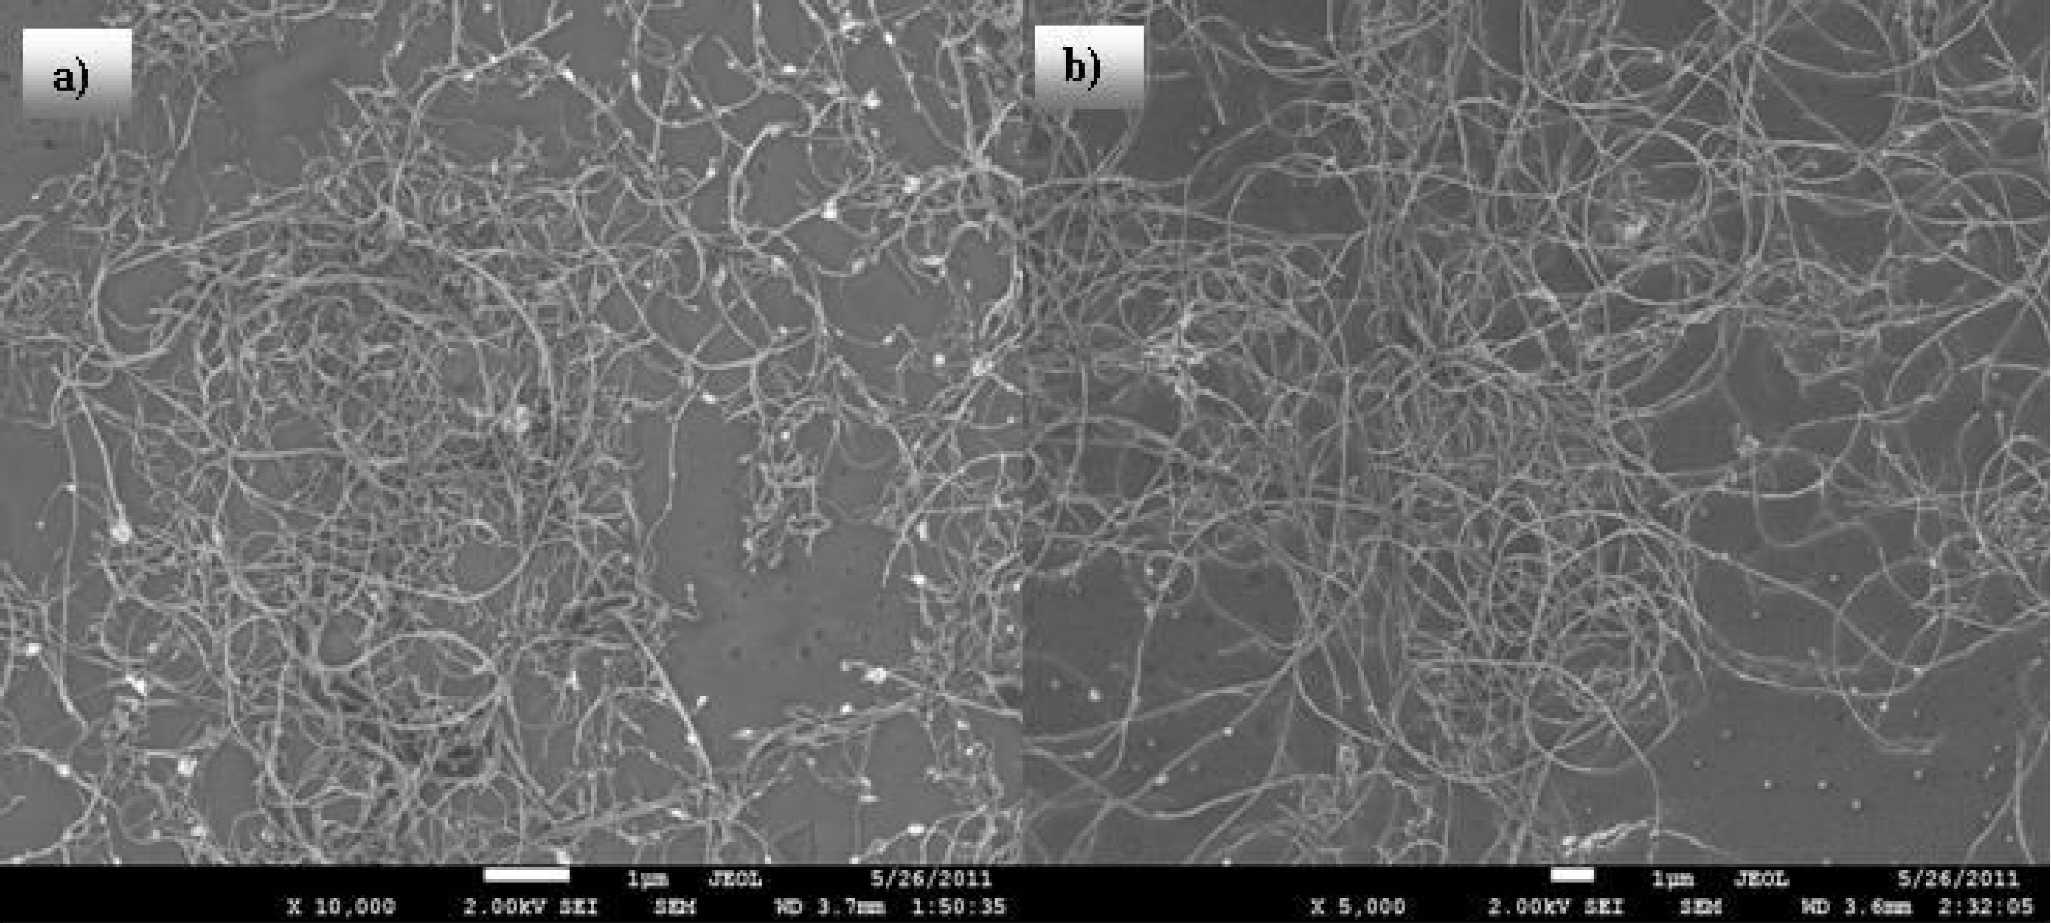
Figure 8. The morphology of TCFs made using MWCNTs isopropyl alcohol colloid, a) contains the non-purified MWCNTs (
To allow an easy comparison of the images the size of each has been adjusted so that the magnification is approximately the same.
Figures 9a) and 9b) show micrographs of TCFs made using acetone MWCNTs colloids mixed nitrocellulose-based varnish. Again several large pieces of contaminants can be seen in the non-purified sample and these pieces appear to disturb the intermixed mesh of CNTs, and this possibly explains the significantly larger sheet resistance of this sample. In the larger magnification micrographs it can be seen that the MWCNTs have a conformal coating of the varnish, but they are not completely immersed in the varnish.
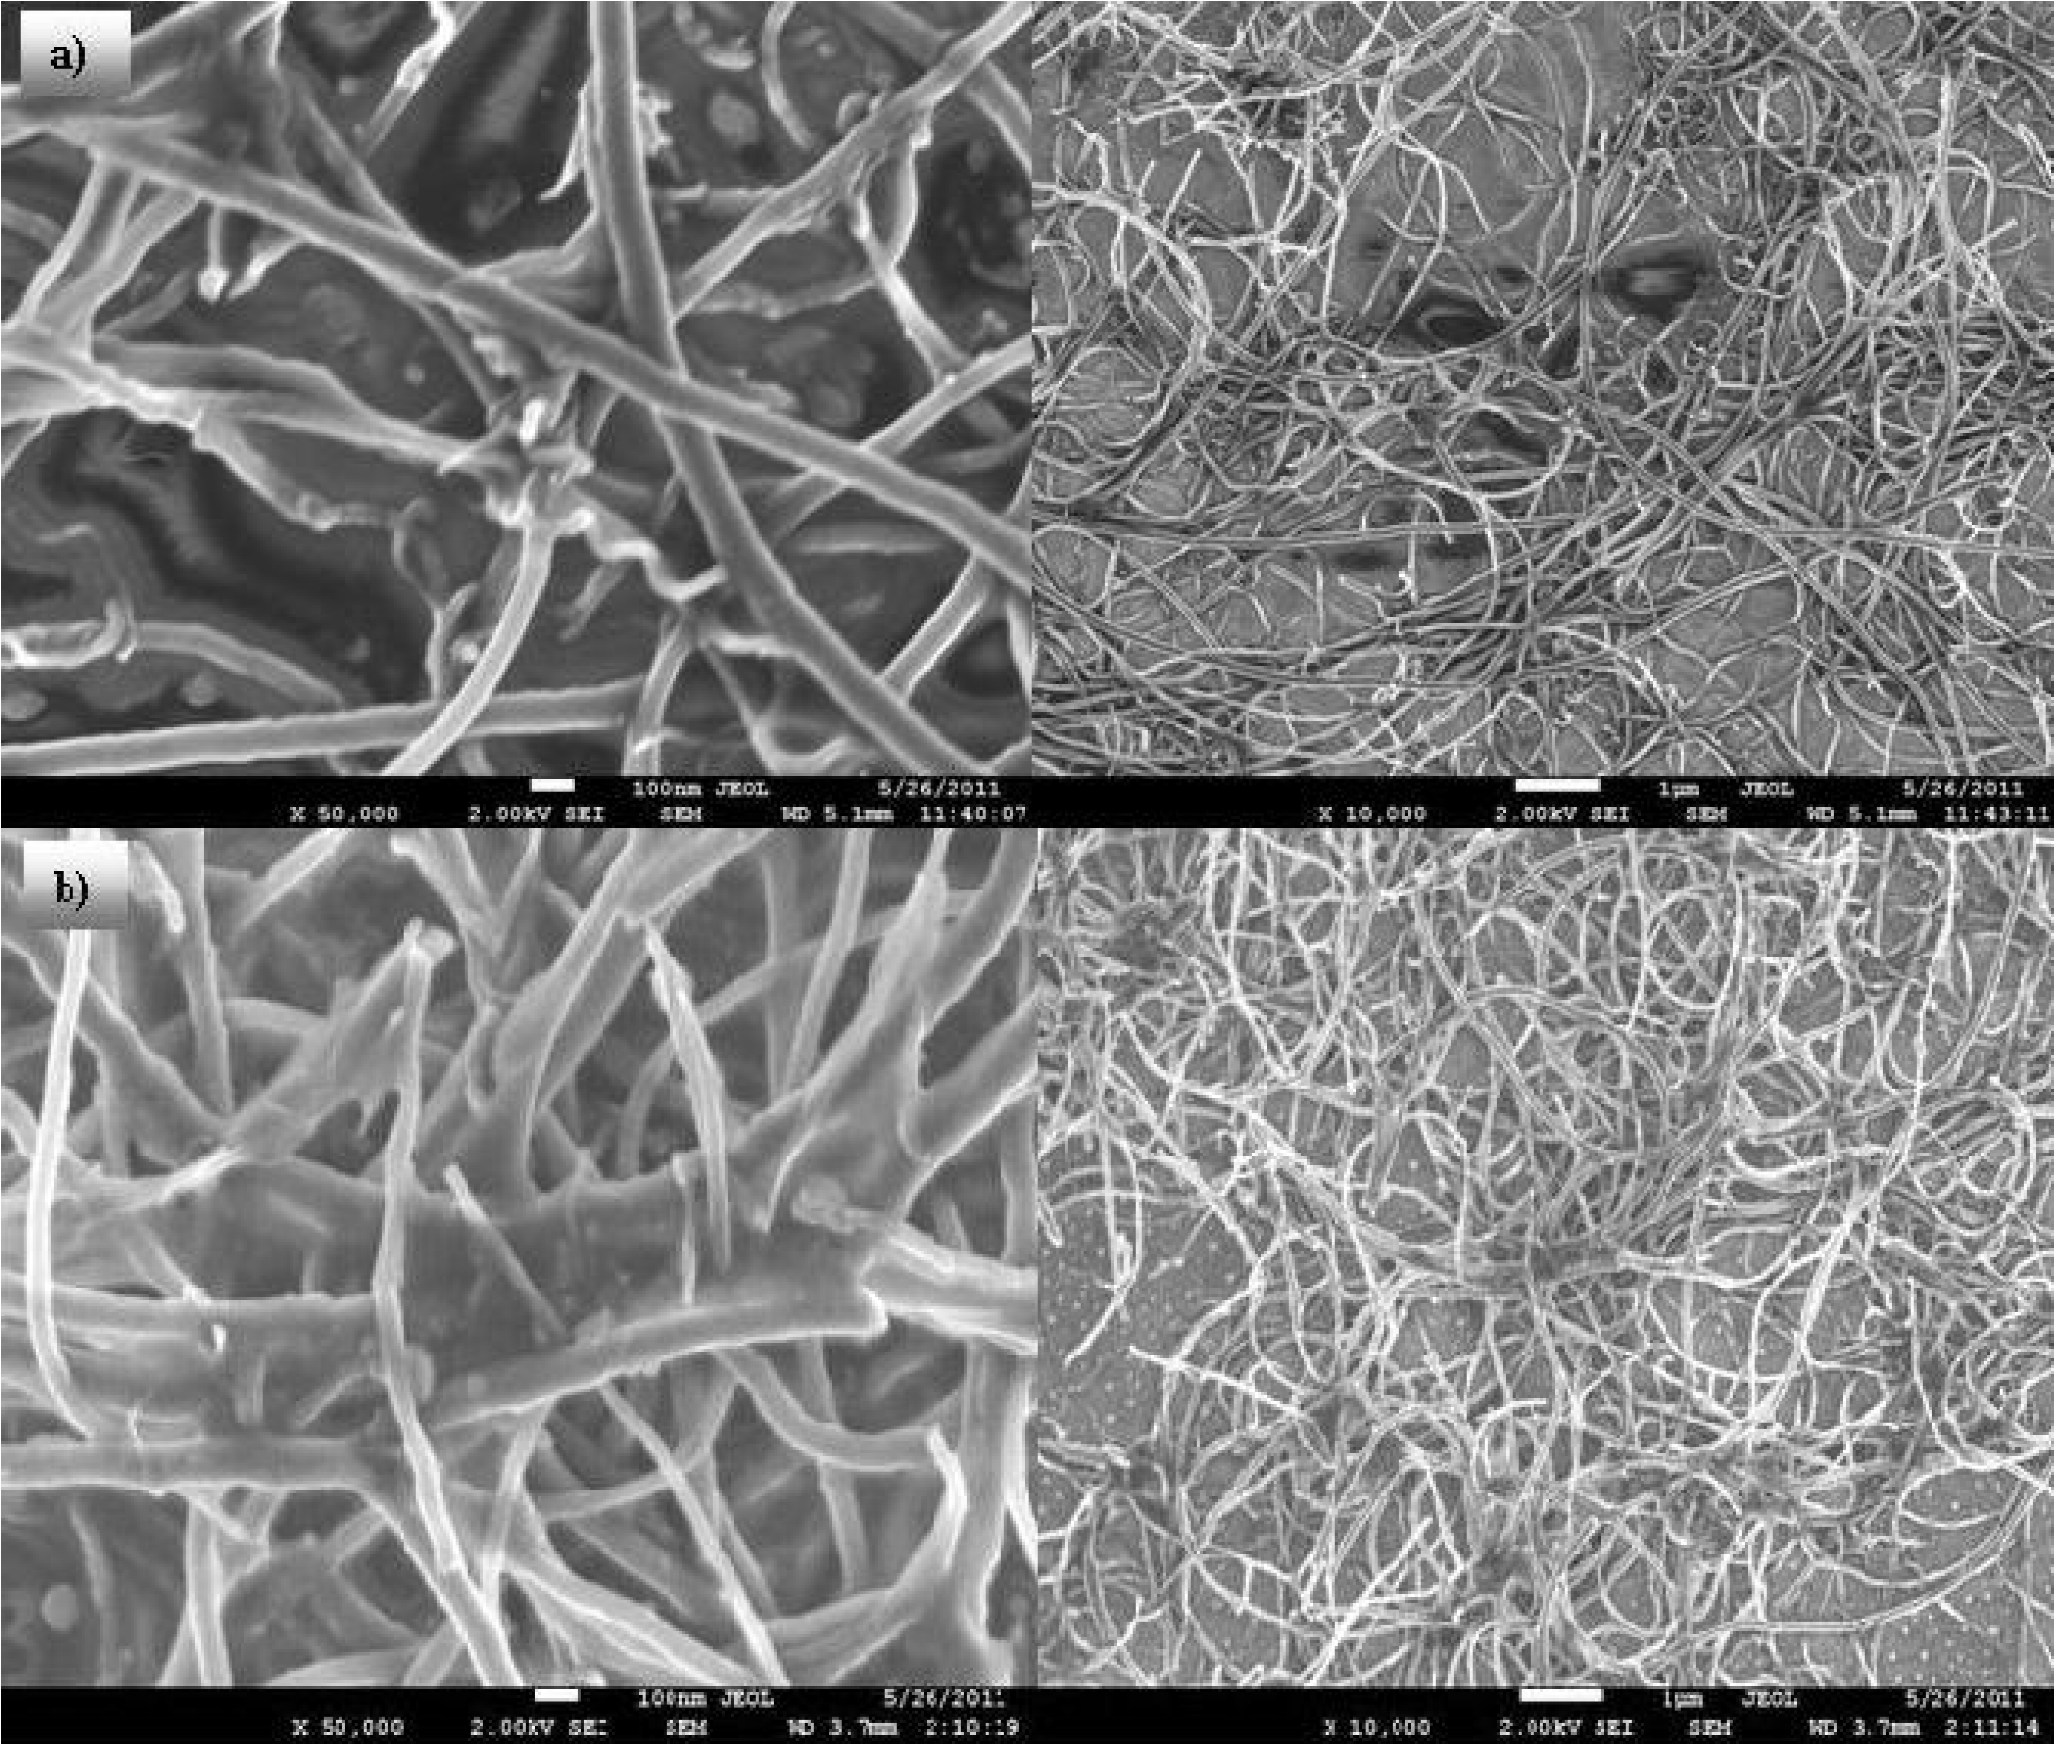
Figure 9. The morphology of TCFs made using MWCNTs mixed with nitrocellulose-based varnish, a) contains the non- purified MWCNTs (
The Fig. 10 shows micrographs of TCFs made using the colloids of the purified MWCNTs in acetone mixed with PMMA. Even though the concentration of polymer was the same as for the samples shown in the Figs. 8b) and 9b) the structure of the film is different; the nanotubes appear to be immersed in a gelatinous medium. However, the sheet resistance of the film is similar to that of the other purified MWCNTs samples.

3.5. Optical and electrical characterization of the TCFs
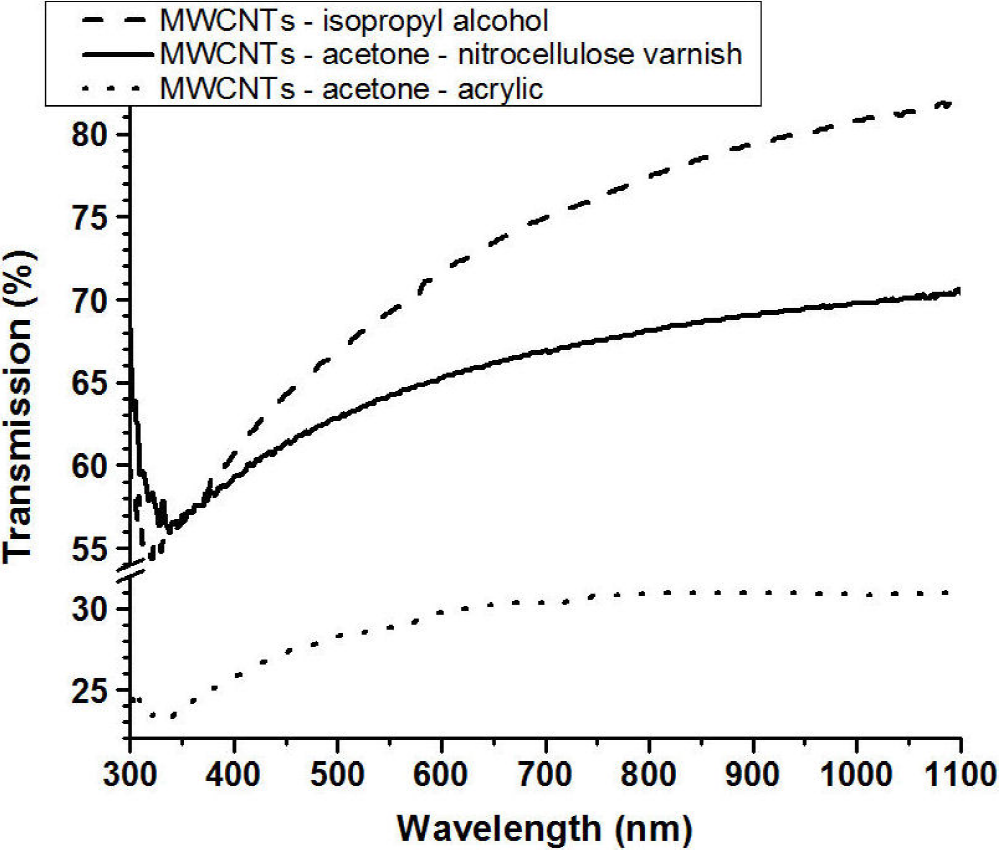
Figure 11 shows the transmission spectra of the TCFs made using isopropyl alcohol, acetone-acrylic and acetone-nitrocellulose colloids; all samples were approximately the same thickness and contained the same weight percentage of purified MWCNTs. The increase in the spectra at wavelengths (300-340 nm) lower than for the minimum in the transmission is an artefact of the measurement due to interference effects related to the glass substrate. The difference between the transmission for wavelengths greater than ~400 nm is due to the relative absorption of the of the different matrix materials, but the form of the three spectra is similar.
3.6. Resistance as a function of the temperature
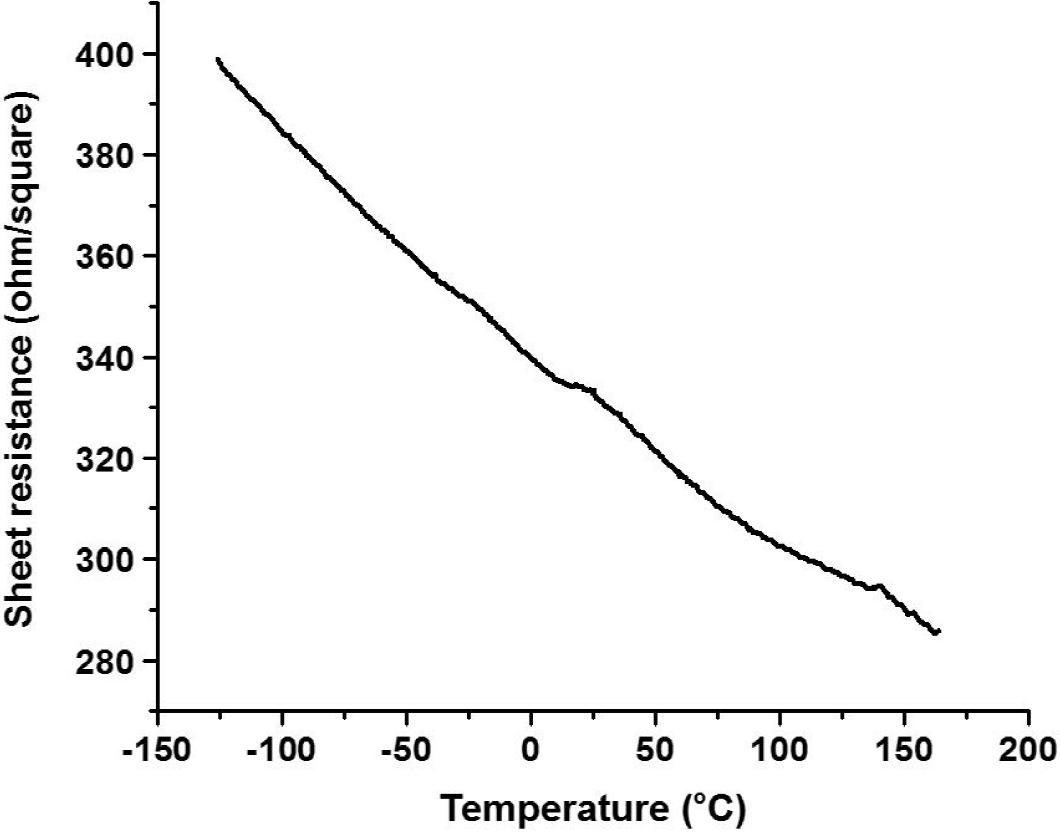
Figure 12 shows the resistance of the MWCNTs films as a function of the temperature for TCF samples made from MWCNTs-isopropyl alcohol colloid. It can be observed that the resistance decreased as the temperature was increased. This behaviour was found for all the TCF samples.
3.7. Resistivity surface as a function of transparency
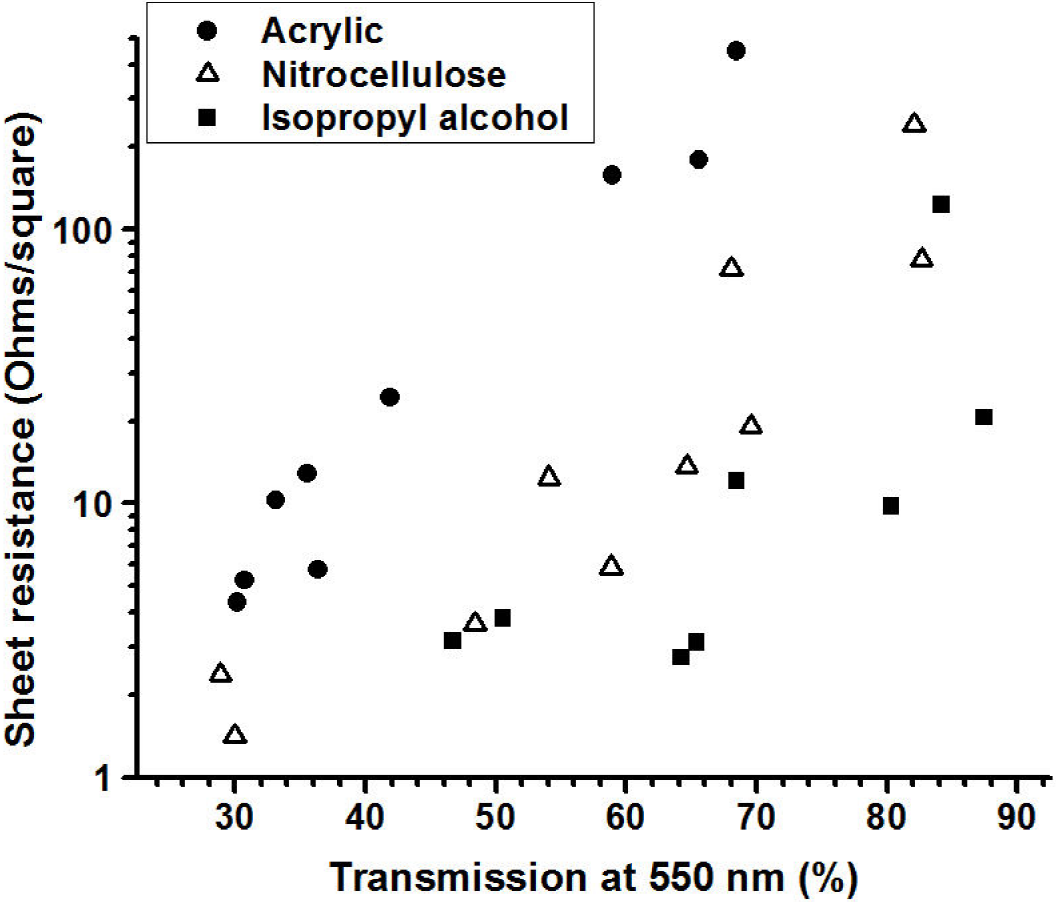
The Fig. 13 shows the variation of the sheet resistivity of the TCFs, deposited on glass substrates, as function of the optical transmission of the sample at 550 nm. It can be seen that, as expected, for each group of films the transparency was larger for the more resistive films indicating that the properties are strongly determined on the concentration of MWCNTs incorporated in the film. In agreement with the data shown in the Fig. 11 the films with the highest transparency, for a given resistivity, where the TCFs made using isopropyl alcohol, followed by the acetone-nitrocellulose and finally the acetone-acrylic samples.
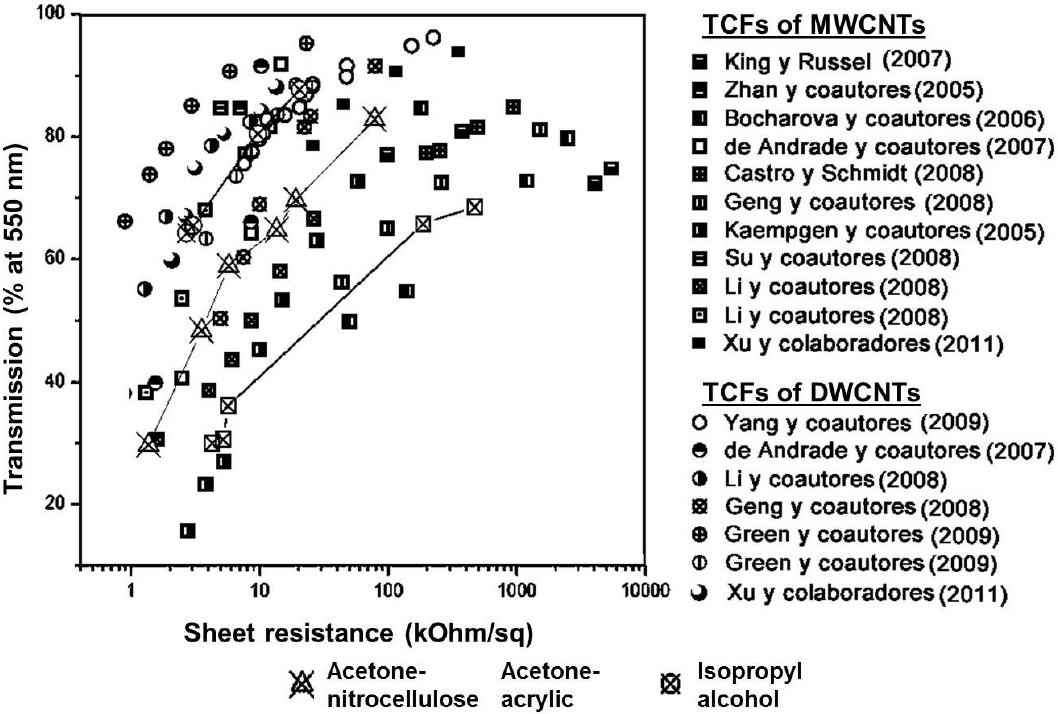
Guang-Hui Xu et al. 30 in 2011 published a comparison of the results of the surface resistivity versus transmittance at 550 nm of samples prepared by a large number of groups. In the Fig. 14 we have show the graph Guang-from the Hui Xu paper and have added the data for the three types of TCFs from this work. It can be seen that our results are very similar to the previous studies.
4. Conclusions
The CVD method using camphor and ferrocene as precursors was seen to provide a reproducible fabrication process for MWCNTs. Two different groups of CNTs were obtained one from deposits on silicon substrates placed in the centre of the tubular furnace and the other was collected from the wall of the furnace. The fabrication process was sufficiently efficient that more than 2 gr of MWCNT could be collect from the two sources.
It was observed that the MWCNTs collected from the wall typically had more than 70 layers while the MWCNTs from the silicon substrates had approximately 30 layers.
The best purification procedure of the MWCNTs was by the selective oxidation in H2O2 combined with hydrochloric acid. With this method MWCNTs with purities up to 94%, without metallic and carbons nanoparticulas, could be obtained. In addition, this process did not appear to cause severe damage to the nanotubes and a total of 70% of the initial weight was maintained.
A combination of spray and spin coating was used to fabricate the uniform MWCNT films on glass substrates.
The quality of the TCFs defined as the optical transmission at 550 nm divided by the sheet resistance, was highest for the MWCNTs-isopropyl alcohol colloid precursors, followed by the MWCNTs in acetone-nitrocellulose and the lowest for the MWCNTs in the acetone-acrylic colloid. This was mainly due to the lower transparency of the acrylic.
The sheet resistance and the transparency of the TCFs prepared in this study were similar to the values reported by other groups.

