SciELO - Scientific Electronic Library Online

 
vol.63 issue1Geometry of classical particles on curved surfacesOn the anisotropic advection-diffusion equation with time dependent coefficients author indexsubject indexsearch form
Home Pagealphabetic serial listing  

Services on Demand

Journal

Article

Indicators

Related links

  • Have no similar articlesSimilars in SciELO

Share


Revista mexicana de física

Print version ISSN 0035-001X

Rev. mex. fis. vol.63 n.1 México Jan./Feb. 2017


Research

Structural refinement, photoluminescence and Raman spectroscopy of Wurtzite Mn-doped ZnO pellets

J. Marquinaa  * 

J. Martína 

J. Luengoa 

F. Veraa 

L. Roaa 

G.E. Delgadod 

F. Rodríguezc 

C. Renero-Lecunae 

R. Valientee 

J. Gonzálezb  c 

aCentro de Estudios Avanzados en Óptica (CEAO), Facultad de Ciencias, Universidad de Los Andes, Mérida 5101, Venezuela.

bCentro de Estudios de Semiconductores (CES), Facultad de Ciencias, Universidad de Los Andes, Mérida 5101, Venezuela.

cMalta Consolider Team, CITIMAC, Facultad de Ciencias, Universidad de Cantabria, Santander 69005, Spain.

dLaboratorio de Cristalografía, Departamento de Química, Facultad de Ciencias, Universidad de Los Andes, Mérida 5101, Venezuela

eMalta Consolider Team, Departamento de Física, Facultad de Ciencias, Universidad de Cantabria, Santander 69005, Spain.


Abstract

We report the results of the Rietveld refinement, photoluminescence and Raman spectroscopy of Mn-doped ZnO ceramic pellets. Rietveld refinement shows that samples crystallize in the wurtzite structure and for the Mn-doped sample indicates that the Mn atoms substitute the Zn tetrahedral crystallographic sites in the ZnO host lattice. The emission and absorption spectra of Mn-doped ZnO have been investigated in the Visible-UV region and the data have been interpreted in terms of the wurtzite ZnO electronic structure. Two broad bands, one due to superposition between donor bound excitons (DX) and free excitons (FX) and other due free-to-bond excitonic recombination (FB) dominates the low-temperature photoluminescence spectra of Mn-doped ZnO bulk. In the Raman spectrum, an extra mode at 520 cm-1 has been observed in agreement with earlier works, and it is an indicator for the incorporation of Mn+2 ions into the ZnO host matrix since it is not is observed in ZnO pristine.

Keywords: DMS; Photoluminescence; Raman spectroscopy; ZnO

PACS: 75.50.Pp; 78.55.Et; 78.30.Fs; 81.05.Dz

1. Introduction

Zinc oxide (ZnO) is a direct wide band gap ( 3.3-3.4 eV at room temperature) semiconductor with good optical transparency (up to 65%) in the visible range1. It shows a large exciton binding energy of 60 meV at ambient conditions and it is one the most technologically relevant binary compound2. However, pure (i.e. undoped), ZnO material/crystals have certain limitations in their application. In order to widen the potential areas where ZnO crystals can be applied, dopant ions (transitions metal (TM) ions, such as Cr, Mn, Fe, Co, and Ni and others) have to be incorporated into the ZnO host lattice to get certain desired properties like wider or narrower band gap 3, ferromagnetism 4, etc. The semiconductors that are formed through the doping with TM, are commonly known as diluted magnetic semiconductors (DMS). The term DMS refers to the fact that some fractions of the atoms in a nonmagnetic semiconductor host (in this case, ZnO) are randomly replaced by magnetic ions. It is well-known that the substitution of the cations of the host by TM ions affect its electronic structure. This is due to the strong coupling of the 3d orbitals of the magnetic cations and the p orbitals of the neighboring anions. Mn-doped ZnO DMS is now studied due to its potential applicability in the field of spintronics5 as diluted magnetic semiconductors (DMS)6, transistors7, optoelectronics8, and others.

A ferromagnetic ordering with Curie temperatures above 425 K in Mn-doped ZnO bulk ceramic and thin films was reported9,10. It was also observed that, for temperature above 600°C, some Mn start to cluster into the Mn2O3 form, whereas the best ferromagnetic behavior was found for the samples prepared at 500°C. Other groups have reported higher Curie temperatures for ferromagnetic ordering in Mn-doped ZnO thin film11,12,13. More recently, Chang et al. have demonstrated ferromagnetism in samples of Mn-doped ZnO nanowire5. The capacity to produce powder, pellets, transparent thin films, as well as nanowires of Mn-doped ZnO open up a variety of possibilities to fabricate a lot of components for spintronic devices with ferromagnetic behavior at room temperature, and components for novel magneto-optic components.

In this paper, we report detailed Photoluminescent (PL) spectra of Mn-doped ZnO ceramic pellets in the excitonic region. An important issue to take into account is whether the resulting materials are indeed alloys of transition metal elements within the host material instead of remains as the host material with clusters, precipitates, or secondary phases aggregations. Rietveld refinement of the X-ray diffraction patterns, Energy-dispersive X-ray spectroscopy (EDS) technique, and Raman spectroscopies were performed to study these effects. For Mn-doped ZnO polycrystalline pellets, it was found that the better crystallinity takes place at temperatures below 550°C 9,10 as well as the highest 3d metals solubility of 3d metals in ZnO15. The Mn-doped ZnO pellets were prepared at two different synthetizing temperatures (500°C and 900°C) and the samples structure and propriety’s were compared. Our interest in optical properties study of bulk samples was motivated by a study recently that show that the optical properties in the DMS ZnO:Co2+ are independent of the structural conformation of the host and the cobalt concentration (for concentration less than 5% of Co2+)14.

2. Experimental details

2.1. Preparation of ZnO pure and Mn-doped ZnO

The ceramic pellets of polycrystalline Mn-doped ZnO were prepared following a similar procedure as given by Sharma et al.10. An Ar flow was used, at the beginning, to clean the system as de-scribed below. To prepare the samples in Oxygen atmosphere, a long quartz tube of length 1.20 metre (23.80 mm outer diameter) was kept coaxially inside a horizontal tubular furnace. Samples with 2 at.% Mn-ZnO were prepared through the solid-state reaction route using high-purity ZnO (2.9269 g) and MnO2 (0.0705 g) powder (at least 99.9 %), which were mixed together and ground during at least 15 min. Then, it was axially pressed into disks at 5 ton/cm2. After this, the pellets was placed in a ceramic boat and inserted in the center of a horizontal tubular furnace. Then, the temperature was raised to 400°C at 40 K/h and held at this temperature for 8 h. After, the disks were exposed to a second thermal treatment at two different temperatures (500 and 900°C) for 12 h, using a heating rate of 25 K/h. A constant oxygen flow (1 L/min) was used at the highest temperatures in both treatments. The processed samples had a nominal composition of x = 0.02 (Zn0.98Mn0.02O). The samples prepared at 500 and 900°C are named ZnO500 and Zn900, respectively.

2.2. Instrumental analysis

The Raman spectra were taken at various temperatures under atmospheric pressure in backscattering geometry, with a confocal microscope and a 100X objective, with a Horiba T64000 triple spectrometer using the 514.5 nm line of a Coherent Innova Spectrum 70C Ar+-Kr+ laser. The Raman signal was detected using a nitrogen cooled CCD (Jobin-Yvon Symphony). The integration time was 40 s and the laser power was kept below 5 mW to avoid laser-heating effects on the tested material and the concomitant softening of the observed Raman peaks.

Photoluminescence (PL) measurements were carried out with a double excitation and emission monochromator Edinburg Instruments FSLP 920 fluorimeter with a spectral resolution in both emission and excitation of 0.1 nm. A Xe ozone free quartz 450 W lamp was used for excitation. The absorption spectra, at room temperature, of the Mn-doped ZnO pellets were measured using an Acton SpectraPro-500 spectrometer from 350 nm to 800 nm. For these measurements, the powdered ZnO samples were mixed with KBr powder in a ratio of 1:2 parts by weight and pressed into pellets.

X-ray powder diffraction (XRD) data were collected on a Bruker D8 automatic diffractometer in Bragg-Brentano geometry. The Cu-Kα radiation (λ=1.5418 Å) was employed with steps of 0.02° in 2θ and fixed time counting of 16 s in the range 10-90°. In addition, a scanning electron microscope (SEM) Hitachi S-2500 coupled to an energy dispersive X-ray microanalyzer Thermo Noran for the elemental analysis was employed for compositional analysis.

Table I. EDS results for Zn0.98Mn0.02O pellets. The values are averaged over three different sample sites. 

3. Results and discussions
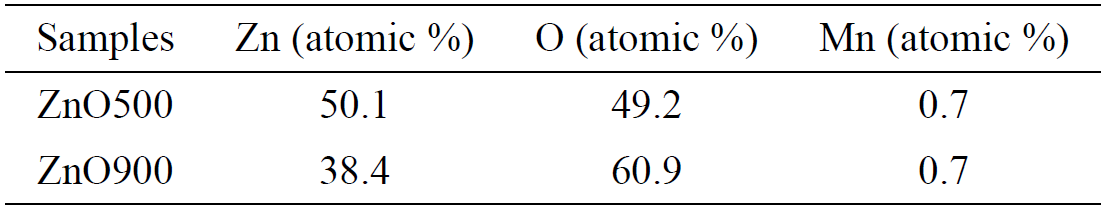
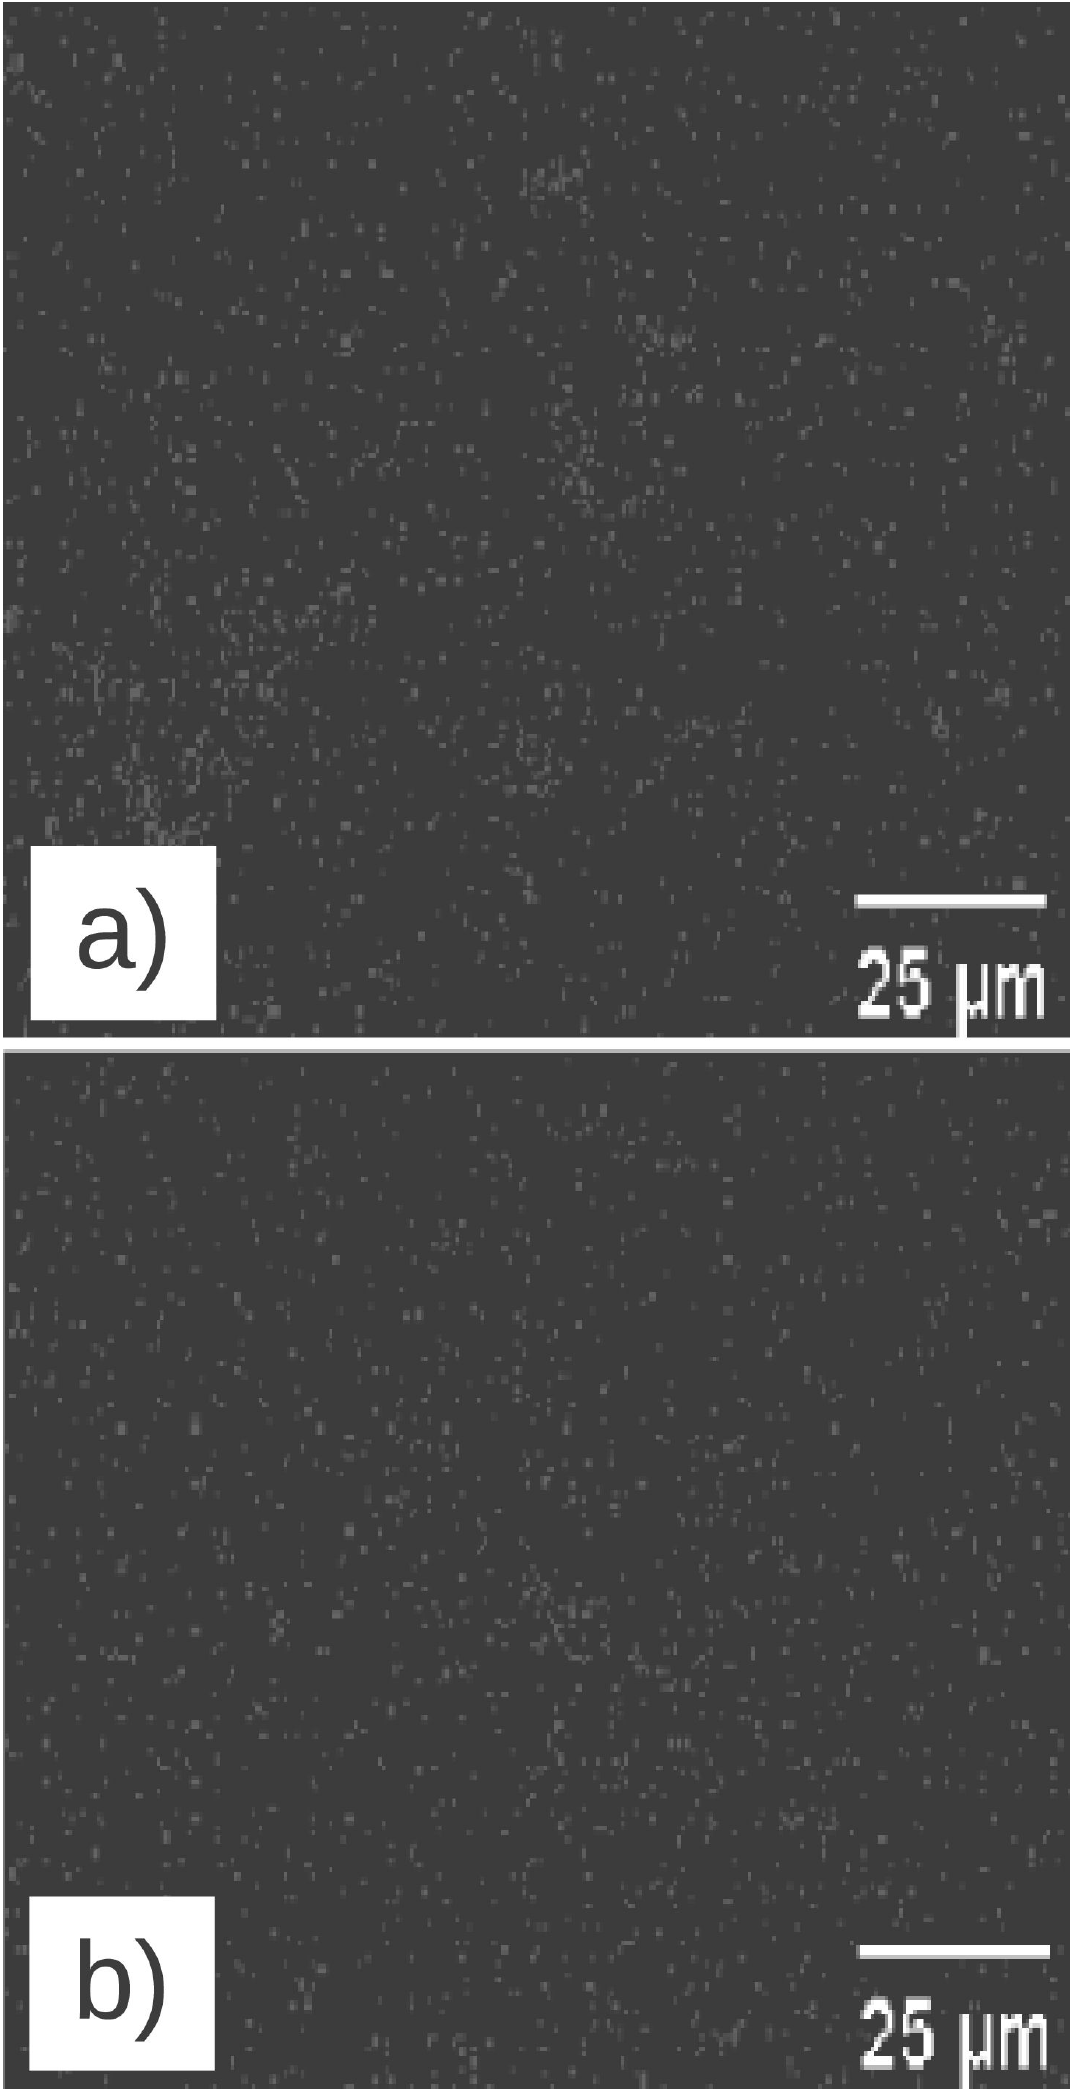
3.1. EDS studies

Figure 1 shows an elemental mapping for the samples ZnO500 and ZnO900 showing a uniform distribution of Mn atoms in the sample. However the average local Mn concentration, determined by the EDS technique was found to be very low (
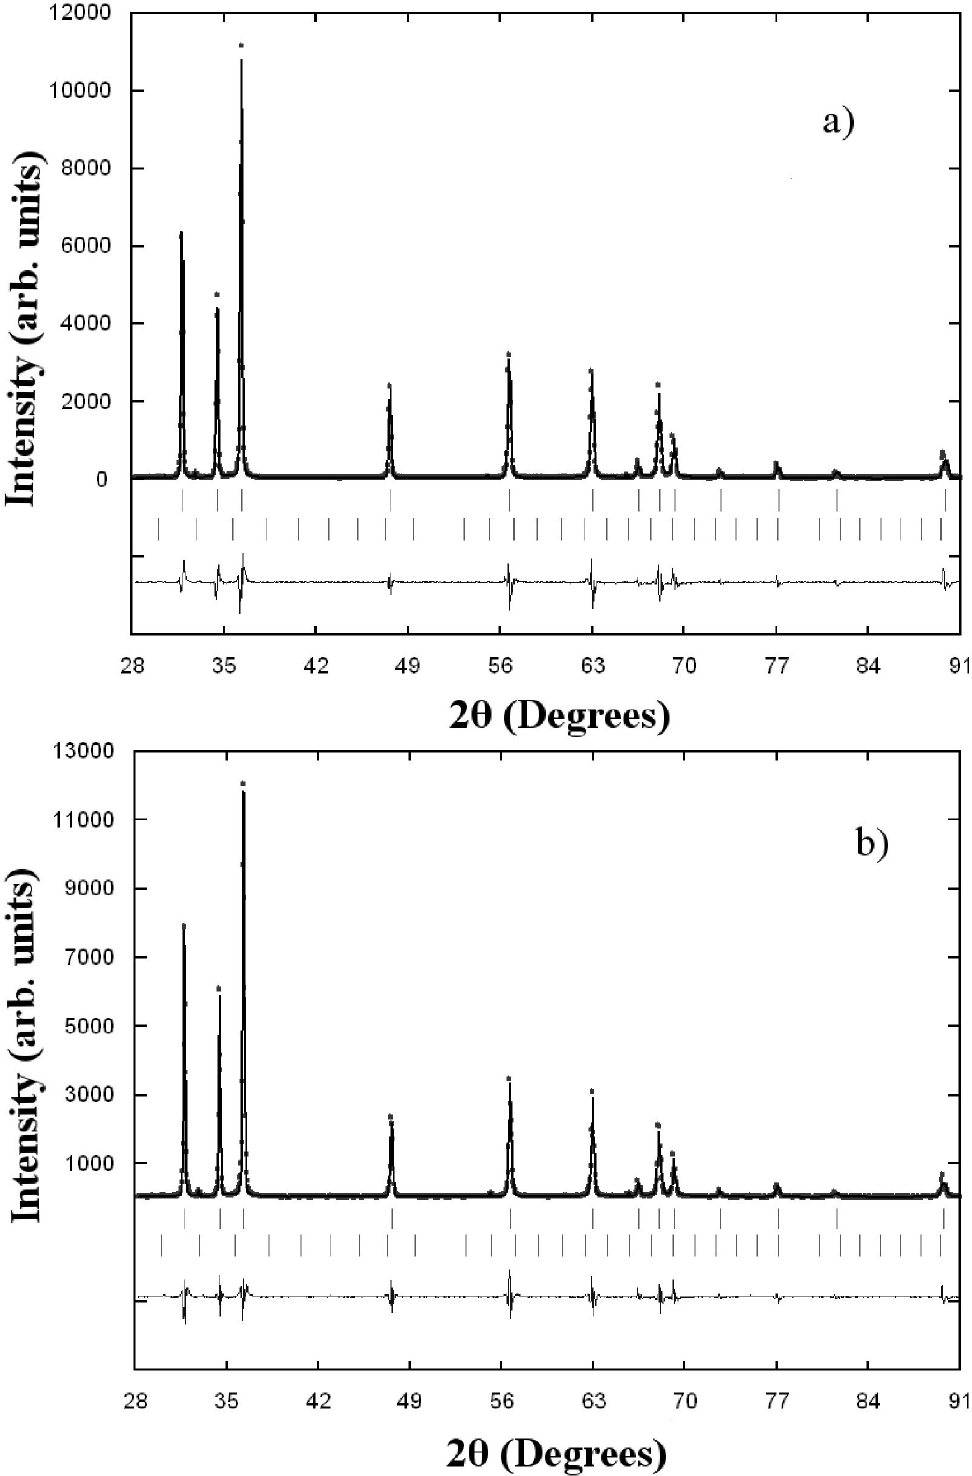
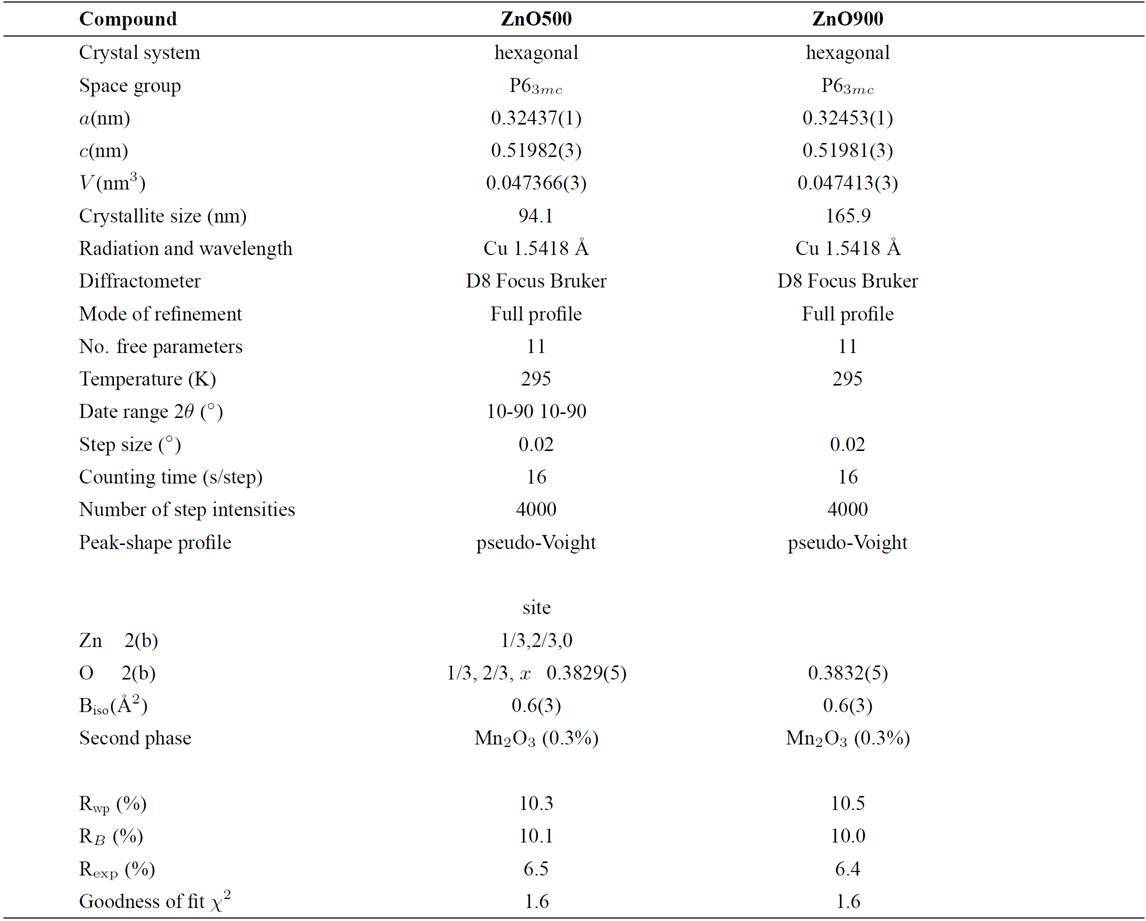
0.7 at.% instead the 2 at.%). However, there is the literature is evidence at least in some cases, that the non-stochiometry can be due to presence of defect complex or to the presence of large cluster of point defects randomly distributed in the lattice, instead of to simple point defects. Indeed, in our samples, regions clusters having high Mn content (up to 36.11 at.%) has been observed. A possible reason for formation of clusters in the sample is due to powder mixing process, because that there is a slower substitutional diffusion mechanics at low-temperature, as a result, regions cluster occur in the sample. Therefore, further investigations are required to clarify the effect of mixing on Mn distribution in the sample.

Figura 1. a) Elemental mapping for Mn (white points) in Zn0.98Mn0.02O pellets (ZnO500 a) and ZnO900 b)). 

3.2. XRD studies

The Zn0.98Mn0.02O pellets were characterized by X-ray diffraction at room temperature, and the results are shown in Fig. 2. A search in the ICDD-PDF database16 using the software available with the diffractometer was performed, and one known phase present in small quantities were readily identified: Mn2O3 (PDF N° 76-015) for the samples doped with Mn. The crystal structure refinement was performed by Rietveld technique17,18, using the Fullprof program19,20. Details of the Rietveld refinement results for each compound are given in Table II. The initial positional parameters used were the ZnO bulk values taken from literature21. Atomic positions of the binary Mn2O3 compound were included as a secondary phase in the refinement. Since the amount of Mn2O3 phase (cluster) present in the samples is small (0.3%), and no other phase are seen, this seems to indicate that some Mn atoms might have been substitutionally incorporated in ZnO lattice. These Mn2O3 clusters are too small to be seen by conventional X-ray techniques, however from the Rietveld refinement results the formation of cluster, in both samples, seem to be independent of temperature sintering process. The chemical kinetic reaction deal in inhomogeneous samples of Mn-doped ZnO sintered at high temperature is difficult from the present experimental data, and requires further investigations.

Figure 2. Rietveld refinement plot for Zn0.98Mn0.02O pellets (ZnO500 a) and ZnO900 b)). 

Table II. Rietveld refinement results for Zn0.98Mn0.02O pellets. 

3.3. Raman studies

In order to check the tetrahedral coordinated Mn+2 ions into the ZnO host lattice and due to the limited sensitivity of the X-ray powder diffraction technique, Raman spectroscopy was carried out. The room temperature Raman spectrum of Zn0.98Mn0.02O pellets sintered at 500°C is shown in Fig. 3. The strongest peaks at 99 and 438 cm+1 belong to the low- and high-frequency branches of the E 2 mode of ZnO, which dominates the spectra. The 410 cm-1 peak is typically ascribed to E 1-TO phonon. The Raman peak at 382 cm-1 is assigned to A1 transverse optical (TO) mode. A peak at 538 cm-1 had been previously assigned to 2B2low with possible contributions of LA overtones along L - M direction and the H point22. However, the assignment of the prominent peak observed at 207 cm-1 is quite controversial. It can be attributed to an overtone, in Ref.23 this mode was assigned to 2TAL, in Ref.24 to 2E2low with possible contributions of 2TA at the M point, and in Ref.22 to 2TA at the H point. This latter assignment is assumed in this work. Also, a combination mode is observed at 331 cm-1 and has been ascribed to E2high-E2low difference mode. Our results are consistent with the previous studies collected in Table III from Refs. 22,24,25,26.

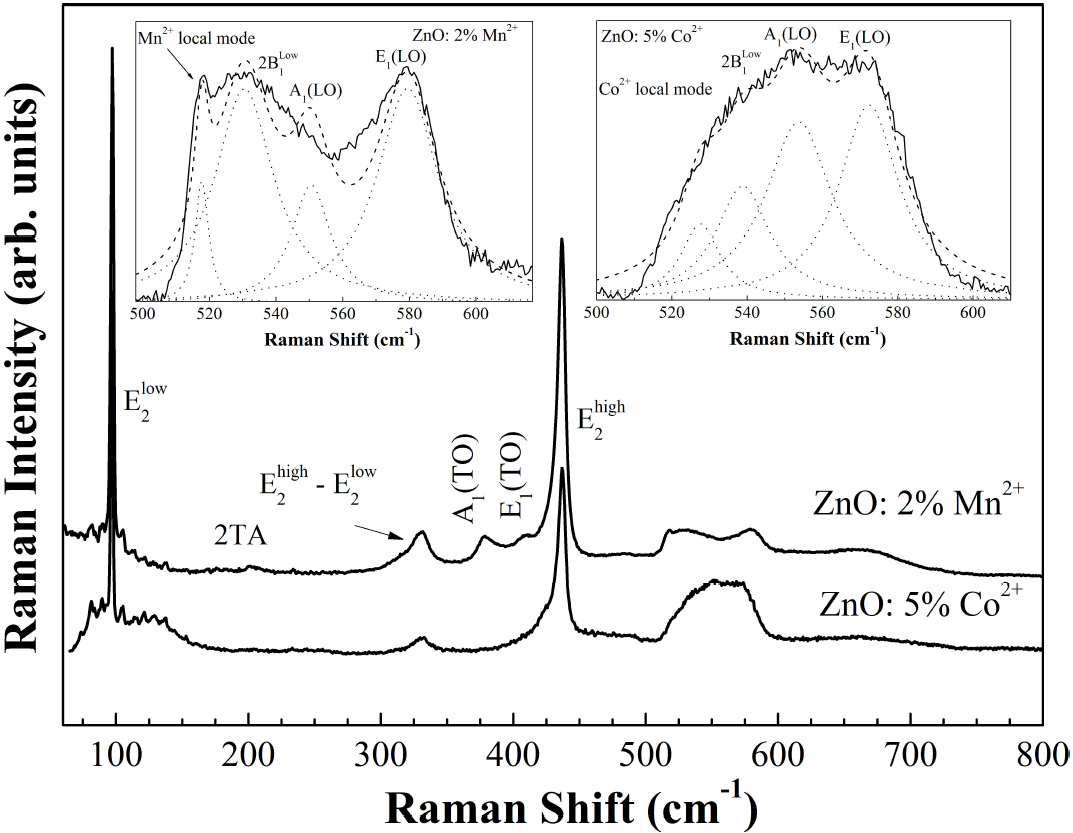
Figure 3. Raman spectra of ZnO500 pellets and Co-doped ZnO from Ref.33. The total fitting (dashed line) with four Lorentzian functions (dot lines) are shown in the inset figures. 

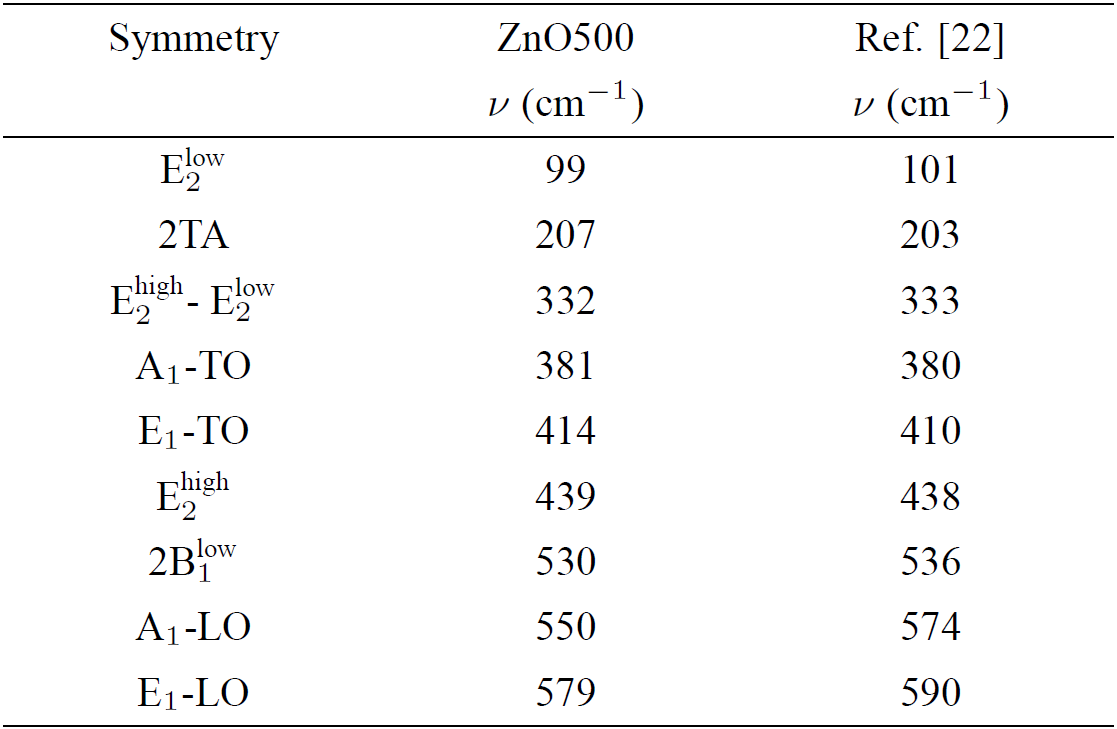
Table III. Room temperature frequencies (v) and symmetry of the first- and second-order Raman spectra observed in the ZnO500 sample. Our results are compared with previous data in Ref.22

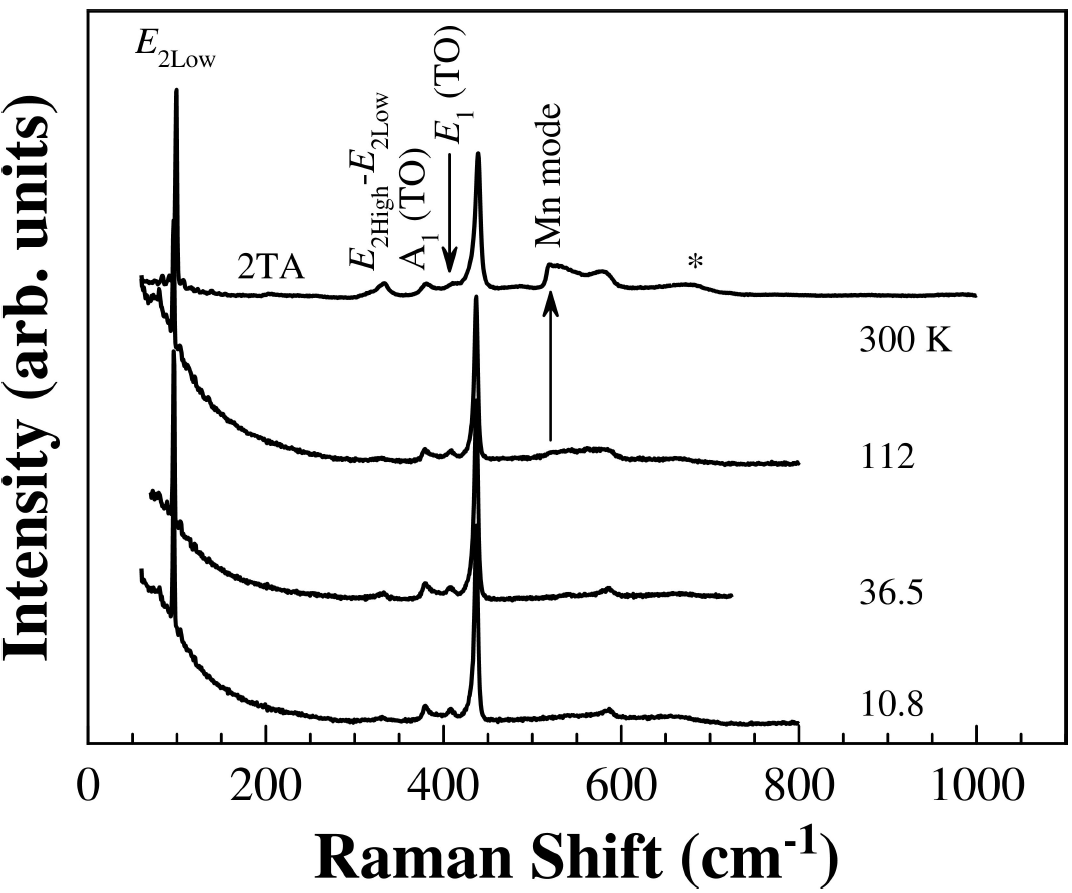
Doping ZnO with Mn2+ ions introduces an extra mode at 520 cm-1 (see Fig. 3), that appears in both Mn-doped samples (ZnO900 sample shows a similar Raman spectrum). Therefore, the appearance of 520 cm-1 can be used to characterize Mn2+ doped into ZnO lattice compared with this of bulk pure ZnO. An extra mode at about 525 to 530 cm-1 has been observed before in ZnO:Mn thin-film and polycrystalline samples26,27,28. Various explanations have been given about its origin, such as local mode due to Mn substituting Zn in a lattice site27, with Mn2+ ions or atoms28,29, and to defect-induced modes30. A recently study, with ab initio calculations using the density functional theory (DFT), shows that the density of vibrational states in hexagonal ZnO doped with cobalt, present an additional band associated with the vibrational states of Co-O-Co chain complexes31. However, our results seems to be in agreement with Alaria et al.28, i.e., this extra mode is probably associated with Mn2+ impurities due to an increasing number of lattice defects. This assumption agrees with the increasing intensity and the softening of the, A 1 (LO), and E 1 (LO) modes (see inset in Fig. 3). The 665 cm-1 peak, which has been ascribed to a two-phonon process (A1-LO+E2low)32, is another indication of the Mn insertion into the host lattice. The presence of this peak indicates the existence of Mn-based phases, which perfectly agrees with the trace of the Mn2O3 phase that we have observed in the X-ray diffractograms.

The scattering of the electrons and holes on the impurities can relax the selection rule of the dipole-allowed Raman scattering. Therefore, one can expect that phonons participating in the scattering will be a mixture of A1-LO, E1-LO, 2B1low and Mn modes because of the symmetry breaking introduced by the impurities. It explains the observed bands (see inset Fig. 3) in the spectral region between 500 cm-1 and 600 cm-1. For comparison purposes, the Raman spectrum at room temperature of Co-doped ZnO single crystal previously reported33 was too plotting in Fig. 3. It shows an unresolved complex mixture of modes in same region. In order to determine the symmetries of unresolved modes we employed the deconvolution method using Lorentz functions. Thus, The E1-LO, A1-LO, 2B1low, and Mn local modes were resolved in the spectra of Mn-doped ZnO and Co-doped ZnO by using 4 peaks with Lorentzian line-shape. The values 528, 539 cm-1 and 520, 530 cm-1 corresponding to, 2B1low and Mn local modes for Co-doped ZnO and Mn-doped ZnO, respectively, agreement good with experimental values (see Table III) previously reported. A softening of the A 1 - LO, and E 1 - LO modes was observed in both samples. The values 554 and 572 cm-1 corresponding to, A 1 - LO, and E 1 - LO modes were obtained from the RT Raman spectrum of Co-doped ZnO. These are similar to values obtained for Mn-doped ZnO, as expected. Thus, the deconvolution procedure used seems to be physically reasonable. On the other hand, the Raman spectra at various temperatures are shown in Fig. 4. For temperature above 112 K, the Mn mode become more visible and, as expected, its peak position did not shift with temperature.

Figure 4. Raman spectra of ZnO500 sample at various temperatures. 

3.4 Optical properties studies

The band gap energy of samples were determined by taking the intersection of the vertical dashed line near the band edge, as shown in Fig. 5. Thus, the band gap of both samples of Zn0.98Mn0.02O is 3.2 eV which is in good agreement with other preceding studies34. The observed decrease (or red shift) in the band gap energy of the studied low Mn content samples present in the present work (3.2 eV instead 3.3-3.4 eV) can be explained due to a strong sp - d exchange interaction present between d electrons of Mn2+, and the s and p electrons of the host lattice. A similar behavior was found in polycrystalline samples of Co-doped ZnO prepared through hydrothermal method35. Additionally, a shoulder between 2 to 2.5 eV seems to correspond with the typical green emission36.

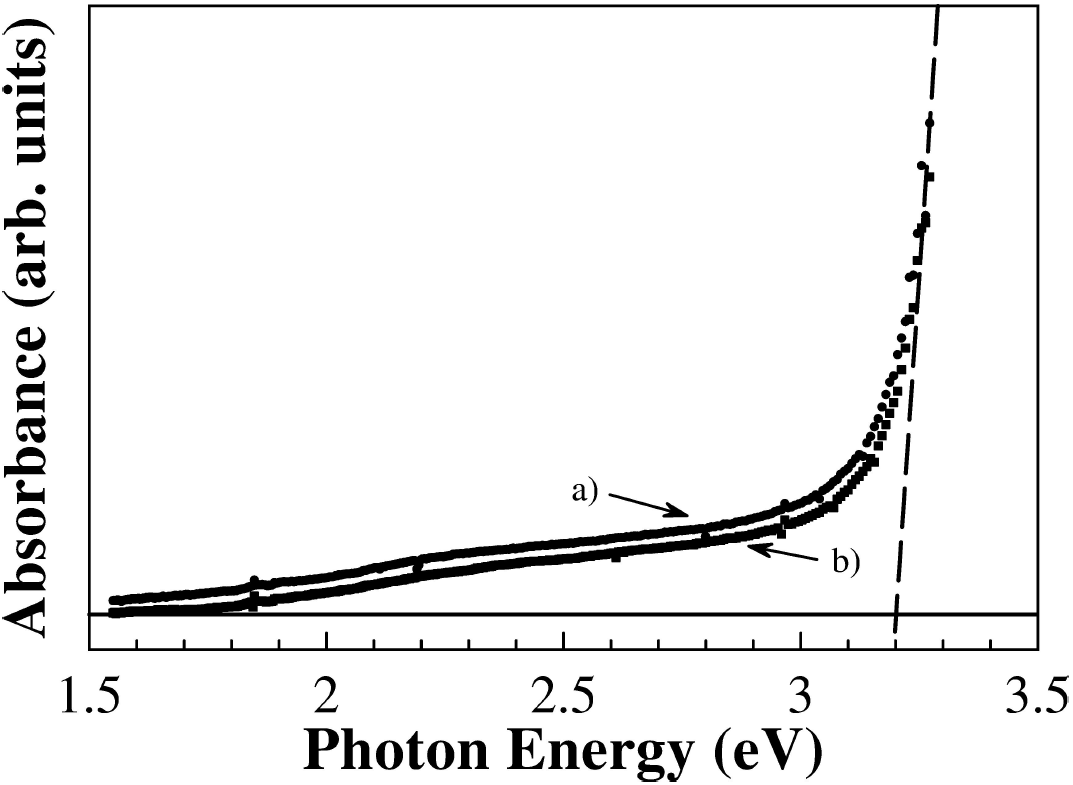
Figure 5. UV-Vis absorbance spectra at room temperature of Zn0.98Mn0.02O pellets (ZnO500, full circles a) and ZnO900, full squares b)). The horizontal line is the baseline and the vertical dashed line is a guide to eyes. The interception point is 3.2 eV. 

The PL spectrum, at 10 K, of ZnO500 sample is shown in Fig. 6a, in which two emission bands at 3.309 and 3.365 eV are clearly seen. Although, the presence of only two bands, the assignments of these emissions are not obvious. Indeed, concerning the energy range of our 3.365 eV band, a recent PL study37 performed on high-pure ZnO bulk samples show that the near-band-edge emission is dominated by several bound excitons. Namely, in the energy region of 3.356 to 3.369 eV has been observed up to seven excitons bound to neutral (D0X) or ionized (D+X) donors, and up to four lines more on the high-energy side attributed to the excited states or excited rotator states of the neutral-donor-bound excitons38,39,40,41,42. Moreover, on the low-energy side, other two weak emissions have been observed and attributed to neutral acceptor bound excitons. Thus, the emission peak centered at 3.365 eV (labeled as DX in Fig. 6a) can be attributed to a process that involves both the recombination of excitons bound to neutral and/or ionized donor. It should be noted that this emission peak is broad and has an asymmetric shape on the lower energy side.

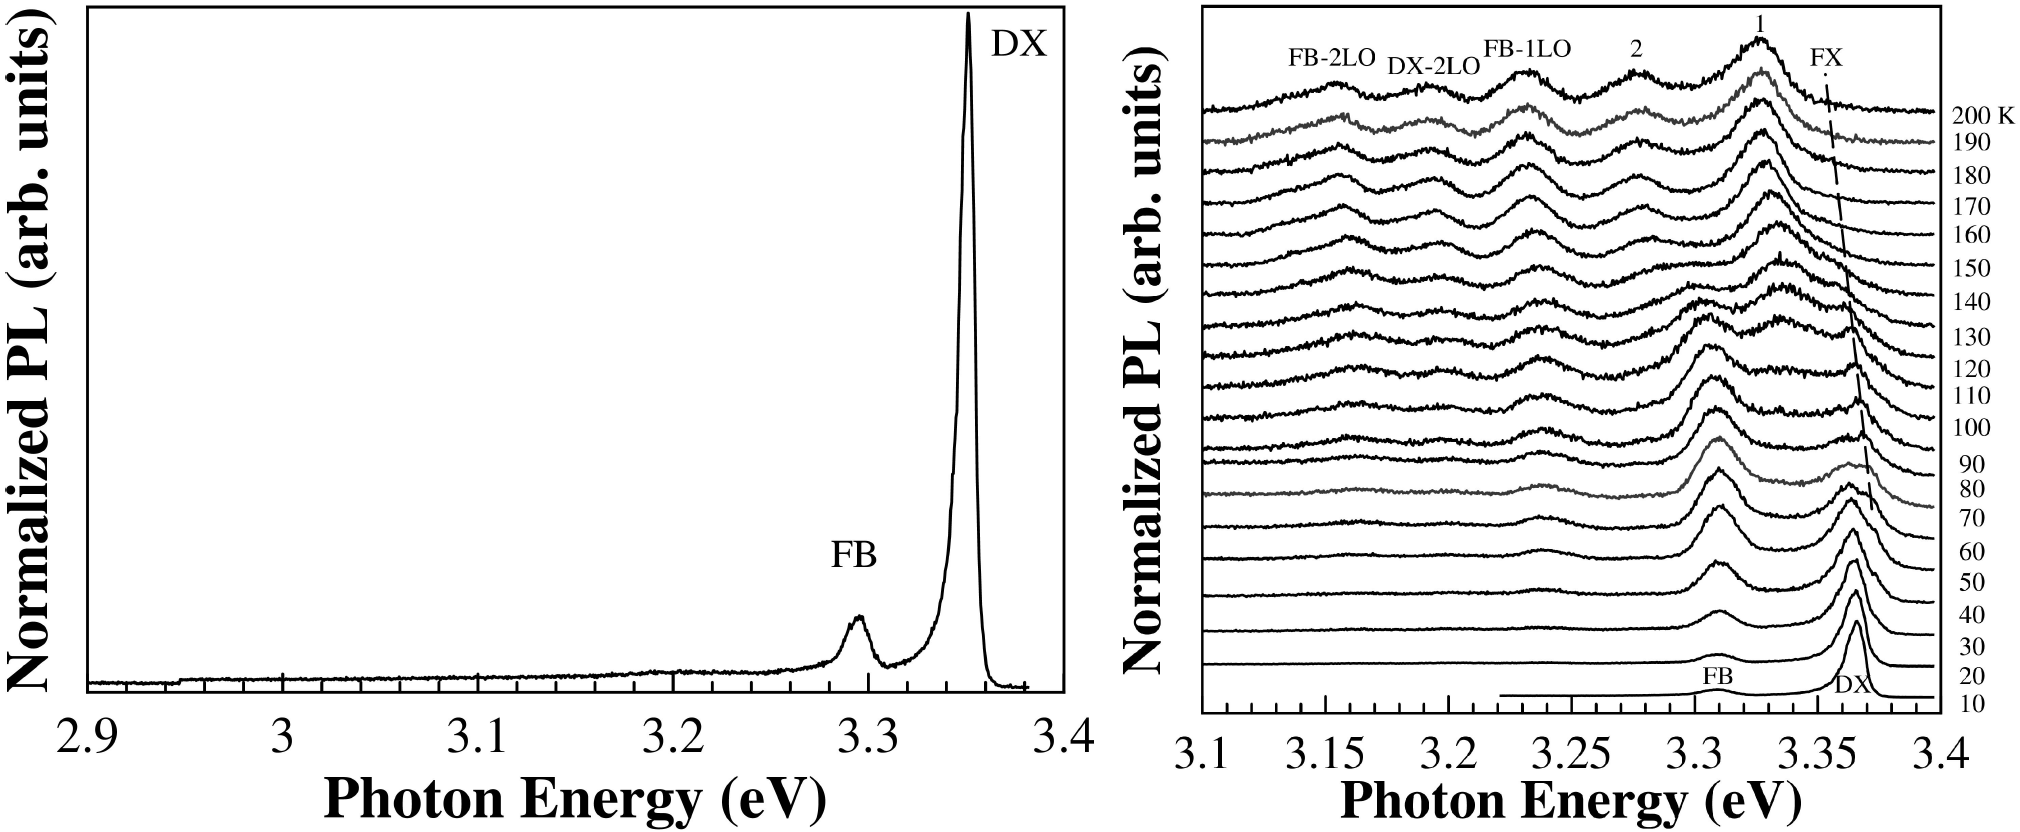
Figure 6. a) PL spectra of ZnO500 sample with the excitation 345 nm at 10 K. Temperature-dependence photoluminescence spectra of b) ZnO500 sample. The spectrum for each temperature is displaced vertically for clarity. 

Concerning the low energy band (3.309 eV) seen in our samples (Fig. 6a), although commonly observed in high-pure ZnO bulk samples, the origin is not completely understood. Different mechanisms have been considered and are summarized in Ref.37. The energy distance between the FX line and this emission line, although almost constant (61-62 meV) is smaller than the energy of an LO phonon (71 meV). Based on (i) the temperature behavior of this band, namely the asymmetric lineshape on the high energy side at a higher temperature (see Fig. 6b) and (ii) on the PL results obtained in ZnO nanowires 37, we proposed that this emission may come from a free-to-bond (FB) recombination.

Figure 6b) show the PL spectra of ZnO500 sample as a function of temperature. It is clearly seen the decrease in intensity and a shift to lower energies of the main bands as also the presence of new PL features in the lower energy side of DX with the increase of the temperature. Figure 7a) shows the peak position of all the bands as a function of the temperature. It is seen that the energy separation between these new features is constant with temperature and can be attributed to optical phonon replicas, indicated as FB-1LO and FB-2LO emissions (see Fig. 7a) have an energy separation between 70 to 75 meV in good agreement with the energy value (574 cm-1 = 71 meV) for A 1 - LO phonon. The emission labeled as FB-2TO has an energy separation between 101-109 eV consistent with twice the energy value (410 cm-1 = 51 meV) for E 1 - LO phonon.

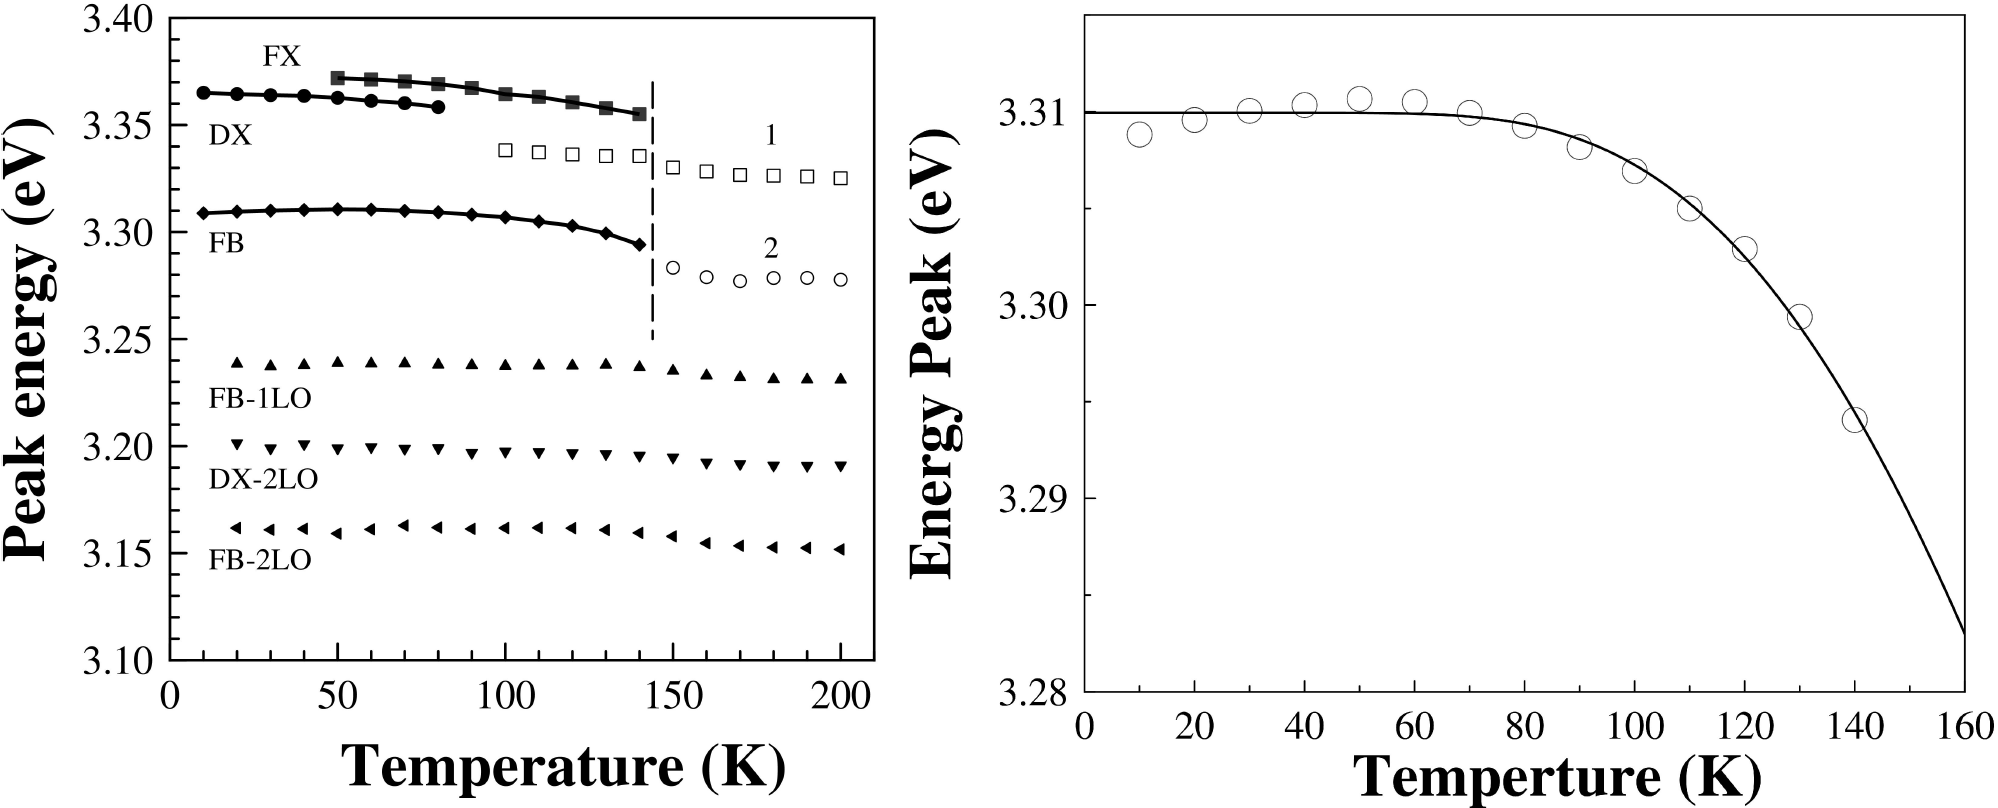
Figure 7. a) The peak energy is plotted against the temperature. The solid lines represent fits with Eq. (2). The dashed vertical line at 150 K is a guide for eyes. b) FB emission peak against the temperature, the solid line represent fits with Eq. (2). 

The temperature dependence of the exciton energies was analyzed by fitting a single Bose-Einstein frequency according to43

E(T)=E0+A12nBE(E1/kBT)+1, (1)

where A 1 is a parameter that describes the variation of the energy with the temperature and n BE is the Bose-Einstein factor:

nBE(E1/kBT)=1/exp(E1/kBT)-1 (2)

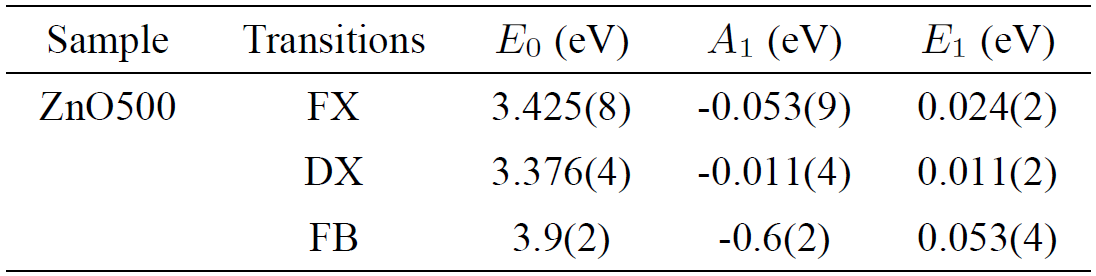
The fitted values E 0, E 1 and the weight A 1 are summarized in Table IV. The fitted values of A 1 and E 1 were found to be similar to the previous report for exciton energies of CuGaS2, CuGaSe2 and CuGaTe243. The choice of the Bose-Einstein model was motivated by the reported limitations44 of the well-known Varshni equation45.

Table IV. Parameters obtained from a fit of a single Bose-Einstein frequency, according to Eq. (1), to the experimental data of Zn0.98Mn0.02O pellets displayed in Fig. 7b). 

The FX and FB emissions disappear at 150 K (see Fig. 7a). For above of 100 K appears a peak starting from 3.3382 eV (open squares) labeled as 1 and at 150 K appears to emerge another peak labeled as 2 that starting 3.2833 (open circle) and the signal intensity of it peaks goes up as the temperature is raised from 100 K to room temperature. We think that emission peaks involving phonon replicas of FX dominate the high-temperature spectra. On the other hand, the FB emission shows a slight anomalous temperature behavior with a maximum at 50 K followed by a decrease of the peak energy above that maximum (see Fig. 7b). It nonmonotonic temperature dependence is particularly noticeable in the chalcopyrites involving Ag 4d valence electrons and is related to p-d-electron hybridization43. We ascribed it to the Mn 3d valence electrons because it has not been observed in FB emission of ZnO pristine37.

4. Conclusions

This paper reports the structural, electronic and vibrational properties of hexagonal ZnO doped with Mn2+ by means of SEM, XRD, UV-Vis absorption, PL spectroscopy and Raman spectroscopy. An extra mode at 520 cm-1 has been observed in the Zn0.98Mn0.02O sample in agreement with previous works. Since it is not observed in the pure ZnO Raman spectrum, this peak is assigned to a vibrational mode associated with Mn2+ ions substituting Zn atoms in the host lattice. In the ZnO500 and ZnO900 samples, EDS results show show a uniform distribution of the Mn atoms into the sample. However, a trace amount of the secondary phase of Mn2O3 was found by Rietveld refinement of the X-ray diffraction patterns, evidincing the presence of Mn3+ ions and showing that Mn-phase segregation was not completely suppressed. The PL temperature dependence of free and bound excitons and their phonon replicas in Zn0.98Mn0.02O sample has been studied in detail. The results show that the room-temperature PL of Zn0.98Mn0.02O pellets is dominated by emission peaks involving phonon replicas. PL spectrum at low temperature are dominated by two peaks labels DX and FB, the former is ascribed to superposition between donor bound excitons and free excitons and the latter has been attributed to free-to-bound excitonic recombination.

Acknowledgments

This work was partially supported by the CDCHT-ULA (Projects No. C-1425-06-05-B and C-1426-06-05-A). The authors thank the (LAQUEM)-ULA, Venezuela for provides access to scanning electron microscopy. We would like to thank the reviewers for their insightful comments and suggestions.

References

1. A. Mang, K. Reimann, and S. Rübenacke, Solid State Commun. 94 (1995) 251. [ Links ]

2. D.C. Look, Mater. Sci. Eng. B 80 (2001) 383. [ Links ]

3. D. Paul Joseph and C. Venkateswaran, J. At. Mol. Opt. Phys. 2011 (2011) 1. [ Links ]

4. S. J. Pearton et al., J. Appl. Phys. 93 (2003) 1. [ Links ]

5. L.-T. Chang et al., Nano Lett. 14 (2014) 1823. [ Links ]

6. K. Wu et al., J. Magn. Magn. Mater. 324 (2012) 1649. [ Links ]

7. J.F. Wager, Science 300 (2003) 1245. [ Links ]

8. H. Kawazoe et al., Nature 389 (1997) 939. [ Links ]

9. P. Sharma, A. Gupta, F.J. Owens, A. Inoue, and K.V. Rao, J. Magn. Magn. Mater. 282 (2004) 115. [ Links ]

10. P. Sharma et al., Nat. Mater. 2 (2003) 673. [ Links ]

11. D. Mukherjee, T. Dhakal, H. Srikanth, P. Mukherjee, and S. Witanachchi, Phys. Rev. B 81 (2010) 205202. [ Links ]

12. M. Venkatesan, C. Fitzgerald, J. Lunney, and J. Coey, Phys. Rev. Lett. 93 (2004) 177206. [ Links ]

13. Z. Yang, J.L. Liu, M. Biasini, and W.P. Beyermann, Appl. Phys. Lett. 92 (2008) 42111. [ Links ]

14. C. Renero-lecuna, G. Almonacid, A. Segura, D.R. Gamelin, and R. Valiente, Chem. Mater. (2013). [ Links ]

15. C.H. Bates, W.B. White, and R. Roy, J. Inorg. Nucl. Chem. 28 (1966) 397. [ Links ]

16. Int. Cent. Diffr. Data (2007). [ Links ]

17. H.M. Rietveld, J. Appl. Crystallogr. 2 (1969) 65. [ Links ]

18. L.B. McCusker, R.B. Von Dreele, D.E. Cox, D. Louër, and P. Scardi, J. Appl. Crystallogr. 32 (1999) 36. [ Links ]

19. J. Rodríguez-Carvajal, Comm. Powder Diffr. (IUCr). Newsl. 26 (2001) 12. [ Links ]

20. J. Rodríguez-Carvajal, Phys. B Condens. Matter 192 (1993) 55. [ Links ]

21. E.H. Kisi and M.M. Elcombe, Acta Crystallogr. Sect. C Cryst. Struct. Commun. 45 (1989) 1867. [ Links ]

22. R. Cuscó et al., Phys. Rev. B 75 (2007) 165202. [ Links ]

23. J. Serrano, A. Romero, F. Manjón, R. Lauck, M. Cardona, and A. Rubio, Phys. Rev. B 69 (2004) 94306. [ Links ]

24. J. Calleja and M. Cardona, Phys. Rev. B 16 (1977) 3753. [ Links ]

25. C.A. Arguello, D.L. Rousseau, and S.P. S. Porto, Phys. Rev. 181 (1969) 1351. [ Links ]

26. T.C. Damen, S.P.S. Porto, and B. Tell, Phys. Rev. 142 (1966) 570. [ Links ]

27. L.W. Yang, X.L. Wu, G.S. Huang, T. Qiu, and Y.M. Yang, J. Appl. Phys. 97 (2005) 14308. [ Links ]

28. J. Alaria et al., J. Appl. Phys. 99 (2006) 08M118. [ Links ]

29. M.F. Cerqueira et al., Phys. Status Solidi 7 (2010) 2290. [ Links ]

30. C. Bundesmann et al., Appl. Phys. Lett. 83 (2003) 1974. [ Links ]

31. I.M. Kupchak, N.F. Serpak, V.V. Strelchuk, and D.V. Korbutyak, Semicond. Physics, Quantum Electron. Optoelectron. 18 (2015) 86. [ Links ]

32. J.B. Wang, H.M. Zhong, Z.F. Li, and W. Lu, J. Appl. Phys. 97 (2005) 86105. [ Links ]

33. M. Millot et al., J. Alloys Compd. 423 (2006) 224. [ Links ]

34. S.V. Bhat and F.L. Deepak, Solid State Commun. 135 (2005) 345. [ Links ]

35. M. Bouloudenine, N. Viart, S. Colis, and A. Dinia, Chem. Phys. Lett. 397 (2004). 73. [ Links ]

36. Y. Gong, T. Andelman, G.F. Neumark, S. O’Brien, and I.L. Kuskovsky, Nanoscale Res. Lett. 2 (2007) 297. [ Links ]

37. K.W. Liu, R. Chen, G.Z. Xing, T. Wu, and H.D. Sun, Appl. Phys. Lett. 96 (2010) 23111. [ Links ]

38. A. Teke et al., Phys. Rev. B 70 (2004) 1. [ Links ]

39. D. Reynolds et al., Phys. Rev. B 57 (1998) 12151. [ Links ]

40. H. Alves et al., Opt. Mater. (Amst). 23 (2003) 33. [ Links ]

41. C. Boemare, T. Monteiro, M.J. Soares, J.G. Guilherme, and E. Alves, Phys. B 308-310 (2001) 985. [ Links ]

42. K. Thonke, T. Gruber, N. Teofilov, R. Schönfelder, A. Waag, and R. Sauer, Phys. B Condens. Matter 308-310 (2001) 945. [ Links ]

43. J. Bhosale et al., Phys. Rev. B 86 (2012) 195208. [ Links ]

44. J.C. Manoogian, A. Woolley, Can. J. Phys. 62 (1984) 285. [ Links ]

45. Y.P. Varshni, Physica 34 (1967) 149. [ Links ]

Received: June 13, 2016; Accepted: October 17, 2016

*e-mail: castella@ula.ve; marquinajesus@gmail.com

Creative Commons License This is an open-access article distributed under the terms of the Creative Commons Attribution License