


 text new page (beta)
 English (pdf)
 Article in xml format
 Article references
 Send this article by e-mail
 Cited by SciELO
  Similars in
SciELO
Similars in
SciELO 
 Permalink
PACS: 07.07.Df; 47.54.Jk; 41.90.+3
1. Introduction
Gas detection is one of the most important research subjects not only in laboratory, but also in several topics as: environment, farming, industry and, in variety of applications like fire detection, environmental monitoring, alcohol breath tests, home safety, grading agroproducts, health, car combustion, etc. 1-8, its importance is so high that, several sensors and sensing techniques are already developed in order to detect gases.
Among all different gases that can be present in the atmosphere, Carbon Dioxide (CO2) stands out, because this gas is responsible for infrared light absorption which comes from solar radiation, is the main greenhouse gas, responsible for global warming, is used for plants in photosynthesis process, it can be used as food spoilage indicator, and many other applications, on basis of its importance for daily life it is necessary to find effective ways to measure CO2 accurately.
Most used techniques for CO2 detection are based on infrared detectors, this is due to quick response, reliability, compact size, etc. 9,10, infrared detection is based on absorption spectra, where Beer-Lambert Law (BLL) is used, this law relates absorbed radiation with sample concentration, it also makes use of the distance between emitter and receiver. Beer-Lambert law establish that concentration is directly proportional to, absorbance, in certain wavelength, and trajectory length for constant temperature and pressure, it is important to point out that there are some deviations of the linear behavior of this law, where some factors as particles dispersion, parasite radiation and electrostatic interaction among particles in the vicinity.
Among those systems based on the BLL it can be mentioned: single wavelength systems, double wavelength systems and, variable wavelength systems; in single wavelength, the presence of a compound is measured on the basis of the radiation absorption, of that compound to a specific wavelength, by means of the relationship of the detected radiation with and without sample; the main problem with this methodology is that, it requires frequent calibration, mainly because measurements are affected by sample temperature, emission intensity, emitter and receiver alignment, and emitter lifetime.
For variable wavelength systems, there are two main techniques, the first one using band pass filters made with thin layers, which change its central wavelength under deformation process due to an applied voltage, the second makes use of Fabry-Perot chambers, that acts as selective filters based on resonance chamber, which wavelength is tuned by moving the distance between those mirrors that forms the chamber 11.
In double wavelength case two detectors are used, one detector with a working wavelength centered to specimen absorption band and, the second one with wavelength close to absorption band, in this way first detector is responsible for measuring sample absorption while the second monitors emission variation, in this way error due to emission intensity variation is avoided.
Light absorption is not only a pure optic phenomenon; it also implies thermal phenomena like thermal expansion, heat generation, etc. Taking into account heat generation a pyroelectric detector can be used as gas detector if the suitable conditions are set.
In a classical photopyroelectric experiment, the setup is as follows, frequency modulated light (

According with our experimental conditions and based on photopyroelectric spectroscopy theory 12, if the pyroelectric sensor is optically opaque and, the sample is optically transparent (
where
As it was mentioned previously, by using a pyroelectric detector with an optical window which allows the wavelength in the sample absorption band (
2. Materials and methods
A dual pyroelectric sensor (LHi814 G2/G20 Perkin Elmer) was used; this sensor was chosen due to its build with two infrared narrow band windows, each one with its own central band (4.00±0.08 and 4.26±0.04 μm) respectively, then one channel can be used as reference channel which allows to measure outside of the CO2 absorbance band and the second one as measure channel, with is central band in the CO2 absorbance band 13,14.
By using this sensor the experimental setup showed in Fig. 1 changes and takes form of dual photopyroelectric cell like, as Fig. 2 shows.

Figure 2 Dual window scheme for CO2 concentration measurement, A is a narrow infrared optical window with central wavelength of 4 μm B is a narrow infrared optical window with central wavelength of 4.26 μm (2347.42 cm - 1) central wavelength.
As it can be seen from experimental setup showed in Fig. 3, two signals are obtained, those signals are called reference and sample signal, reference signal is used for normalizing reference signal in order to avoid instrumental factors like pyroelectric constants.

Figure 3 Experimental setup used for CO2 concentration measurement, A and B are narrow band optical windows, light source is an halogen bulb.
Halogen bulb with tungsten filament was chosen in this work based on its tested emission spectra and the fact that has been used in instruments with NDIR technology; in this case 10 W lamp is used. Light source is frequency modulated at 250 mHz,
A chamber with a volume of 1 cm3 was designed as sensor housing; designed chamber has a controlled inlet that allows to control the gas injection, measuring chamber was thermally isolated in order to avoid temperature variations; this chamber also provides the correct environment to control CO2 concentration, and external light isolation, optical windows in front of light source and sensor were used.
Pyroelectric signals were amplified using an electronic circuit proposed by the manufacturer; electronic circuit provides adequate signal amplitude and also adds an AC to DC stage, an analog to digital converter (ADC) was also implemented working at 100 samples per second, finally a processor was added in order to drive a display to show results and save obtained data.
In order to guaranty 0% CO2 concentration, measuring chamber was fill with N 2, in such way the atmospheric CO2 is displaced, then CO2 (99.8% pure) was introduced in the chamber in desired concentrations.
3. Results and discussion
Eight measurements were made every second during twenty-four seconds, for five different concentrations, Fig. 4 shows pyroelectric signals as function of time for five different concentrations, due to gas dynamics after sample under study is introduced into the measured chamber, pyroelectric values present different values within first two seconds after measurements starts, therefore it is necessary to wait until sample fills the chamber in order to obtain reliable measurements, stable state is reached around 10 seconds after measurement begins, therefore under experimental conditions this is the minimum time need for correct measurements.
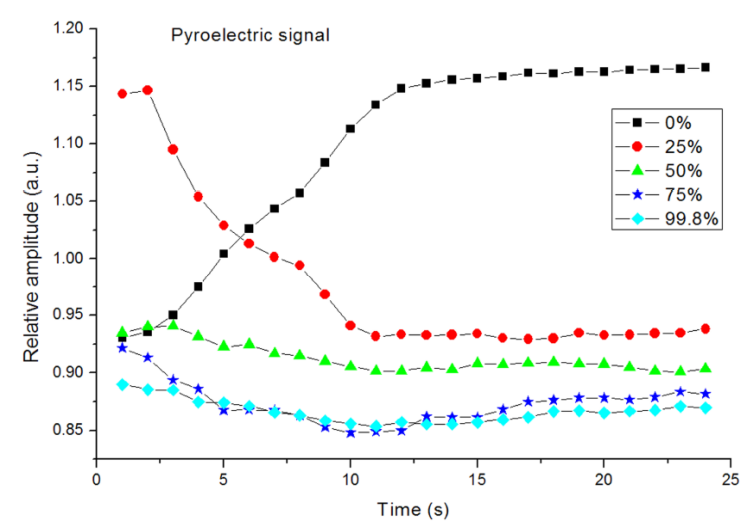
In the case of 0% CO2 pyroelectric signal tends to increase its value because there is not CO2 absorbing IR radiation having as consequence that more IR radiation reach the pyro detector and, consequently amplitude signal increase its value.
Figure 5 presents stable state regime values for different CO2 concentrations, solid squares represent experimental points and, red line is a proposed equation that represents the sensor behavior with concentration, each experimental point results from averaging eight measurements, error bar results from standard deviation of averaged points.

Figure 5 Stable state pyroelectric values for different CO2 concentrations; squares represent experimental values and, solid line the proposed behavior of signal amplitude.
From results presented in Fig. 5, normalized pyroelectric signal, as concentration function, takes the form:
With P S normalized pyroelectric signal and, c sample concentration. Using proposed equation and error bar, it is estimated that lower limit detection is up to 1%.
As cross validation, sample concentrations were measured using a Thermo scientific Nicolet iS5 spectrometer, Fig. 6 shows the FTIR measurements for studied samples.

This system presents advantages over resistance based sensors, especially about recovering, in resistance sensors, it is necessary to overheat the sensor in order to promote desorpcion, whereas in the proposed system since, there is not interaction between sensor and gas under study, there is not adsorption, even though when new measurement starts, it is necessary to empty the measuring chamber.
4. Conclusions
A commercial dual pyroelectric sensor was used as heart of CO2 measurement system, experimental results shows a favorable response to gas under analysis for concentrations lower than 75%, for higher concentrations is still possible to get CO2 value but uncertainty increase its value, an equation that models system behavior was proposed, and concentration of 1% was estimated as the lower detection limit, furthermore more concentrations measurements are needed in order to obtain better mathematical model and to find out the lower sensor limits.
Due to the election of sensors wavelength, humidity effects can be neglected, behind condensation limits, because the water absorption band is far from the sensor 15.
System time response is around 10 seconds, which is fast when compared with resistance based sensors, that can take up to 10 minutes to give a measurement point, the implementation of an artificial intelligence can help to reduce system response time. There is under research a new experimental setup that allows us, to avoid the thermally isolated chamber in order that this system can be used in open environments.

