


 text new page (beta)
 English (pdf)
 Article in xml format
 Article references
 Send this article by e-mail
 Cited by SciELO
  Similars in
SciELO
Similars in
SciELO 
 Permalink
INTRODUCTION
Colorectal carcinoma is the fourth cause of cancer-related mortality in the world1,2. This rate is higher in high-income countries but has been increasing in developing countries2 and young adults3.
Colon carcinoma (CC) is treated with radical surgery4. Although metastatic disease is common at the time of diagnosis, some patients present recurrences after apparently curative surgical resection due to the presence of distant microscopic cancer cells4,5. Adjuvant treatments are designed to eliminate these cells and prevent recurrences2. Notwithstanding, 50% of CC patients die as a result of recurrent or progressive disease, and recent reports have described distinct prognostic subgroups with great heterogeneity in their course and in their response after chemotherapy2-6.
A prevailing paradigm explains that distant hematogenous metastases are implanted after locoregional lymph node metastases. This concept is the causalistic basis of the TNM staging system and also the rationale for regional lymphadenectomy2,4,5. In this regard, the presence of regional lymph node metastases at the time of apparently curative resection is well-recognized as a major negative prognostic factor4,7,8. Overall, patients with N0 disease (including Stages I and II) have a favorable prognosis. However, 10% of patients with Stage I and 20% to 30% of cases with Stage II, present recurrence9,10. Conversely, 40% to 60% of cases with distant recurrent disease will develop in patients with N0 lymph node disease, implying that distant metastases can certainly develop in the absence of lymph node metastases8-10; in 65% of cases, lymphatic and distant metastases arise from independent subclones of the primary tumor11.
In the past, the AJCC had been reluctant to include prognostic factors other than the classical tumor, node, and metastasis components, to modify stage groupings. At present, the TNM staging system has been shown to require complements to increase its reliability, define prognosis, and design treatment modalities in the era of precision medicine12,13. Many CC prognostic models have been published, and are based on staging groups, univariate or multivariate analyses, and clinical or molecular markers14,15, but studies on CC in Stages I-II are scarce and insufficient. Thus, we conducted this study to define several risk and prognostic models by multivariate analysis in a cohort of patients with Stages I and II CC, treated at a single cancer center.
METHODS
Patients
A retrospective cohort of consecutive patients with pTNM Stage I or II CC evaluated at the Instituto Nacional de Cancerología (INCan) in Mexico City, between January 1992 and December 2016. Inclusion criteria admitted patients older than 17, with a colonoscopy- and biopsy-confirmed diagnosis of CC; with imaging studies, and a surgical pathology result reflecting pT1-4, N0, and M0 disease; imaging studies included chest X-rays, liver ultrasonography, and computed tomography (CT). Tumor location was classified as: right, transverse, left, or sigmoid colon as a consensus of the results of these studies. Patients were treated with radical colectomy (right, right extended, left hemicolectomy, or sigmoidectomy) with complete mesocolon resection depending on the tumor’s location. After inclusion, patients were randomly allocated to a "modeling set" or a "validation set" in a 60-40% ratio, using a random number generator.
The Research and Ethics Committees of the INCan reviewed and approved this study protocol (Register Rev/01/15). All methods were conducted in accordance with pertinent national guidelines and regulations.
Prognostic factors
Data were collected from the clinical records and included the patients’ clinical history, physical examination; blood cytology and biochemistry and tumor markers obtained at the time of diagnosis; description of surgical procedures, surgical pathology reports, and whether adjuvant chemotherapy were registered. Baseline carcinoembryonic antigen levels, the Neutrophil/Lymphocyte Ratio (NLR), Neutrophil/Platelet Ratio, Platelet/Lymphocyte Ratio (PLR), Albumin/Globulin Ratio, Albumin/Monocyte Ratio (AMR), the prognostic nutritional index ([serum albumin in g/dL × 10] + [0.005 × total lymphocyte count in cells/mm3]), and the body mass index were recorded as well. Patient restaging was based on the TNM staging system (8th edition)8. The status of microscopic residual disease after radical surgical resection was also registered and patients with R2 disease were excluded from the study. The number of harvested lymph nodes and surgical morbidity as reported by Clavien-Dindo16 was also recorded. The degree of neoplastic differentiation was established by light microscopy17. Adjuvant chemotherapy was mainly used in patients with T3-4 disease, poorly/undifferentiated neoplasms, or in the case of bleeding and/or ulcerated tumors, or in the presence of intestinal occlusion, or perforation. The follow-up visits to the clinic were programmed at 4-month intervals for the first 2 years and annually thereafter.
Immunohistochemistry
The expression of CDX2 and MUC2 in cancer cells was evaluated in formalin-fixed tissue and paraffin blocks. The diagnosis and CC stage were reviewed. The optimal sites in the paraffin blocks to sample for immunoreactions were selected, and 4 µm slices were obtained with the Hyrax M25 Rotary Microtome (Carl Zeiss Microscopy Deutschland GmbH; Oberkochen, Germany). Immunoreactions to detect CDX2 and MUC2 protein expression were conducted with CDX2 (rabbit monoclonal [EPR2764Y] CDX-2 antibody, Cell Marque Corporation; Rocklin, CA) or MUC2 (mouse monoclonal [GTX11197] MUC2 antibody [clone: 996/1], GeneTex; Irvine, CA) antihuman antibodies, both at 1:100 dilutions. Samples were automatically stained with the Ventana Benchmark Automatic Stainer (Roche Diagnostics; Indianapolis, IN). Antigen recovery and detection were performed with the Ultra View Universal equipment (DAB Detection kit, Roche Diagnostics, Indianapolis, IN), and with the Nordic Immunohistochemical Quality Control Organization automated protocol (www.nordiqc.org).
All slides were reviewed by two onco-pathologists, blinded to all patient information, with an AxioScan Z1 digital microscope (Carl Zeiss Microscopy Deutschland GmbH; Oberkochen, Germany). Immune reactions were classified as negative, low, intermediate, or intense, as previously reported (Figs. 1 and 2)18.


Statistical analysis
Continuous variables were preferred for statistical analysis, and categorization wa into quintiles when multi-modal associations were found19. Student’s t or the Chi-squared test was used for between-group comparisons, as necessary. A logistic regression model was constructed to define those prognostic factors associated with recurrence20. Odds ratios (OR) and their 95% confidence intervals (CI) were obtained as a measure of association. The Kaplan–Meier method was used to construct disease-free survival (DFS) and overall survival (OS) curves, and the log-rank method was used to establish differences21. DFS was calculated from the date of surgical resection to the date of recurrence or last visit of the patient, and OS was calculated from the date of diagnosis to the death or last visit of the patient. Median follow-up was calculated after the inverse Kaplan-Meier method. Cox’s proportional hazards model was used for the multivariable analysis of factors associated with DFS or OS, and the Hazards ratios (HR) were calculated as a measure of association, with their 95% CI21. Interaction terms, collinearity, goodness-of-fit, the presence of confounders or suppressors, and the models’ assumptions were tested in the final models20,21. The multiple imputation method was used to account for missing data22.
Once the final models were determined in the "modeling set", they were tested in the "validation set". The predicted probability values for each patient in the logistic regression model were validated with the receiver operating characteristic (ROC) analysis. The predicted DFS/OS survival functions of each patient in the "validation set" were estimated, divided into prognostic groups by terciles or quintiles, and the performance of the final models was evaluated. Two-tailed statistics were used in all cases, and the SPSS statistical software for Mac version 28 was employed for computations (IBM Corp., Armonk, NY, USA).
RESULTS
Patients
Throughout this study’s duration, 556 patients fulfilled the inclusion criteria: 266 women (47.8%) and 290 men (52.2%) with a mean age of 57.9 years (Standard Deviation [SD] 15.2; range, 22-94) were included. The neoplasm was located in the right colon in 269 cases (48.4%), 37 were in the transverse (6.7%), 58 in the left colon (10.4%), and 192 in the sigmoid (34.5%). In terms of T classification, 52 patients were classified as T1 (9.4%), 431 as T2 (77.5%), 36 as T3 (6.5%), and 37 as T4 (6.7%). R0 resection was possible in 548 cases (98.6%). A mean of 18.31 lymph nodes was retrieved (SD 14.3, range: 1-80). Grade II or more surgical morbidity (Clavien-Dindo classification) was recorded in 42 cases (7.6%) and 8 patients (1.4%) had surgery-related mortality. Adjuvant chemotherapy was administered to 205 patients (36.9%). After randomization, 339 patients (61%) were allocated to the "modeling set" and 217 (39%) to the "validation set". Table 1 lists a comparison of the clinical, histopathological, and immunohistochemical factors by cohort.
Table 1. Covariate comparison after randomization in the "modeling set" and "validation set"
| Covariates | "modeling set" (n = 339) | "validation set" (n = 217) |
|---|---|---|
| Age | 58.3 (15.4) | 57.4 (14.8) |
| Gender | ||
| Femalea | 165 (48.7) | 101 (46.5) |
| Male | 174 (51.3) | 116 (53.5) |
| Location | ||
| Ascending colona | 167 (49.3) | 102 (47) |
| Transverse colon | 21 (6.2) | 16 (7.4) |
| Descending colon | 38 (11.2) | 20 (9.2) |
| Sigmoid | 113 (33.3) | 79 (36.4) |
| Differentiation degree | ||
| Wella | 77 (22.7) | 37 (17.1) |
| Moderate | 202 (59.6) | 141 (65) |
| Poor | 37 (10.9) | 22 (10.1) |
| Undifferentiated | 23 (6.8) | 17 (7.8) |
| Carcinoembryonic antigen | 239 (1403) | 313 (1920) |
| Hemoglobin (g/dL) | 12.4 (2.6) | 12.3 (2.7) |
| Hematocrit (%) | 38.2 (6.9) | 37.6 (7.5) |
| Neutrophil count (cells/mm3) | 4752 (1735) | 4653 (1755) |
| Lymphocyte count (cells/mm3) | 1940 (678) | 1904 (691) |
| Platelet count (1000 cells/mm3) | 373 (157) | 371 (165) |
| Monocyte count (cells/mm3) | 598 (249) | 663 (386) |
| Neutrophil/lymphocyte ratio | 3.16 (3.7) | 3.23 (4.9) |
| Platelet/lymphocyte ratio | 0.24 (0.22) | 0.25 (0.25) |
| Serum albumin (g/dL) | 3.56 (0.67) | 3.53 (0.65) |
| Serum globulin (d/dL) | 3.71 (0.85) | 3.73 (0.87) |
| Albumin/globulin ratio | 1.02 (0.33) | 1 (0.33) |
| Albumin/monocyte ratio | 7.28 (5.2) | 6.63 (3.8) |
| Body mass index | 24.4 (3.8) | 24.4 (4) |
| Nutritional prognostic index | 45.3 (8) | 44.8 (8) |
| Negative CDX2 IHCa | 42 (12.4) | 27 (12.5) |
| Negative MUC2 IHCa | 63 (18.6) | 40 (18.4) |
| Vascular lymphatic infiltrationa | 65 (19.2) | 37 (17.1) |
| Perineural invasiona | 24 (7.1) | 7 (3.2) |
| Vascular venous invasiona | 51 (15) | 28 (13) |
| T classification | ||
| T1a | 33 (9.7) | 19 (8.8) |
| T2 | 263 (77.6) | 168 (77.4) |
| T3 | 19 (5.6) | 17 (7.8) |
| T4 | 24 (7.1) | 13 (6) |
| Number of lymph nodes harvested | 18.6 (14.8) | 17.4 (13.4) |
| R0 (no residual disease)a | 334 (98.5) | 214 (98.6) |
| R1 (microscopic residual) | 5 (1.5) | 3 (1.4) |
| Surgical morbidity (Clavien-Dindo 0-1) | 315 (92.9) | 199 (91.7) |
| (Clavien-Dindo >1) | 24 (7.1) | 18 (8.3) |
| Received adjuvant chemotherapy: Noa | 222 (65.5) | 129 (59.4) |
| Received adjuvant chemotherapy: Yesa | 117 (34.5) | 88 (40.6) |
aFor continuous variables, numbers represent means (SD) of ordinal or categorical variables, numbers represent the number of cases (%). IHC: immunohistochemistry.
Recurrence
Of the 556 patients, 61 had recurrent disease (11%); 36 (59%) were locoregional recurrences, 19 (31.1%) were distant hematogenous recurrences (9 liver, 3 lung), and 4 (6.6%) were both, locoregional and distant. Neither CDX2 nor MUC2 expression was associated with the event of "recurrence". Undifferentiated tumor (OR 2.7, 95% CI 1.03-7.2), lymphocyte count (OR 0.99, 95% CI 0.99-1), NLR (OR 1.08, 95% CI 1.02-1.13), PLR (OR 3.04, 95% CI 1.34-6.9), AMR (OR 1.06, 95% CI 1.01-1.1), number of harvested lymph nodes (OR 0.96, 95% CI 0.93-0.99), T4 classification (OR 14.1, 95% CI 1.7-118), and the use of adjuvant chemotherapy (OR 1.8, 95% CI 1.1-3.1) were associated with recurrence by bivariate analysis.
The final model of the multivariate analysis of covariables associated with recurrence in the "modeling set" is described in table 2. A ROC curve reflecting the predicted probability of recurrence after this model versus the observed event of recurrence in the "validation set" is presented in Supplementary figure 1 (area under the ROC curve 0.691, 95% CI 0.582-0.801; p = 0.00065).
Table 2. Logistic regression model of the multivariate association of several covariates with the event of "recurrence" in 339 patients in the "modeling set" (adjusted for location in the right or left colon)
| Covariates | β | SE | Exp β | 95% CI | p-value |
|---|---|---|---|---|---|
| Right colon locationa | – | – | 1 | – | – |
| Left colon location | 0.186 | 0.428 | 1.204 | (0.52-2.8) | 0.664 |
| Lymphocytes >1000 cells/mm3 | −3.74 | 1.187 | 0.024 | 0.002-0.243 | 0.002 |
| Neutrophil/platelet ratio | 0.021 | 0.012 | 1.021 | 0.997-1.046 | 0.089 |
| Albumin/monocyte ratio | 0.054 | 0.028 | 1.056 | 0.099-1.115 | 0.053 |
| Neutrophil/lymphocyte ratio <2.35a | – | – | 1 | – | 0.034 |
| 2.35-4 | 0.787 | 0.475 | 2.198 | 0.867-5.574 | 0.097 |
| > 4 | −2.042 | 1.207 | 0.13 | 0.012-1.381 | 0.091 |
| R0 (no residual disease)a | – | – | 1 | – | – |
| R1 (microscopic residual) | 2.889 | 1.049 | 17.98 | 2.3-140.6 | 0.006 |
| Constant | −0.893 | 0.655 | 0.409 | – | 0.173 |
aReference category (-2 LogLikelihood 171.1; model p = 0.00002; Hosmer & Lemeshow test p = 0.057; Nagelkerke r2 0.197). β: regression coefficient; SE: standard error; Exp β: exponent of the regression coefficient or odds ratio; CI: confidence interval of the Exp β; p: probability values.
Disease-free survival
The median DFS of all patients was not reached, neither in the "modeling set" nor in the "validation set". The T classification and the expression of CDX2 and/or MUC2 were not associated with the DFS (Supplementary Fig. 2A and B). The final multivariate model of covariates associated with DFS in the "modeling set" is described in table 3. With these estimators, the predicted survival functions were calculated in the "validation set", and values were categorized by terciles. The resultant Kaplan–Meier DFS curves, depending on these terciles, are shown in figure 3A.
Table 3. Cox proportional hazards model of the multivariate association of several covariates with "disease-free survival" in 339 patients in the "modeling set" (adjusted for location in the right or left colon)
| Covariates | β | SE | Exp β | 95% CI | p-value |
|---|---|---|---|---|---|
| Right colon locationa | – | – | 1 | – | – |
| Left colon location | 0.132 | 0.37 | 1.141 | 0.553-2.354 | 0.721 |
| Monocytes (cells/mm3) | −0.001 | 0.001 | 0.999 | 0.997-1 | 0.071 |
| Lymphocyte >1200 cells/mm3 | −1.441 | 0.398 | 0.237 | 0.108-0.517 | 0.0003 |
| R0 (no residual disease)a | – | – | 1 | – | – |
| R1 (microscopic residual) | 2.639 | 0.762 | 13.998 | 3.146-62.3 | 0.0005 |
aReference category (−2 LogLikelihood 295.4; model p = 1.2 × 10⁻⁷). β: regression coefficient; SE: standard error; Exp β: exponent of the regression coefficient or risk ratio; CI: confidence interval of the Exp β; p: probability values.
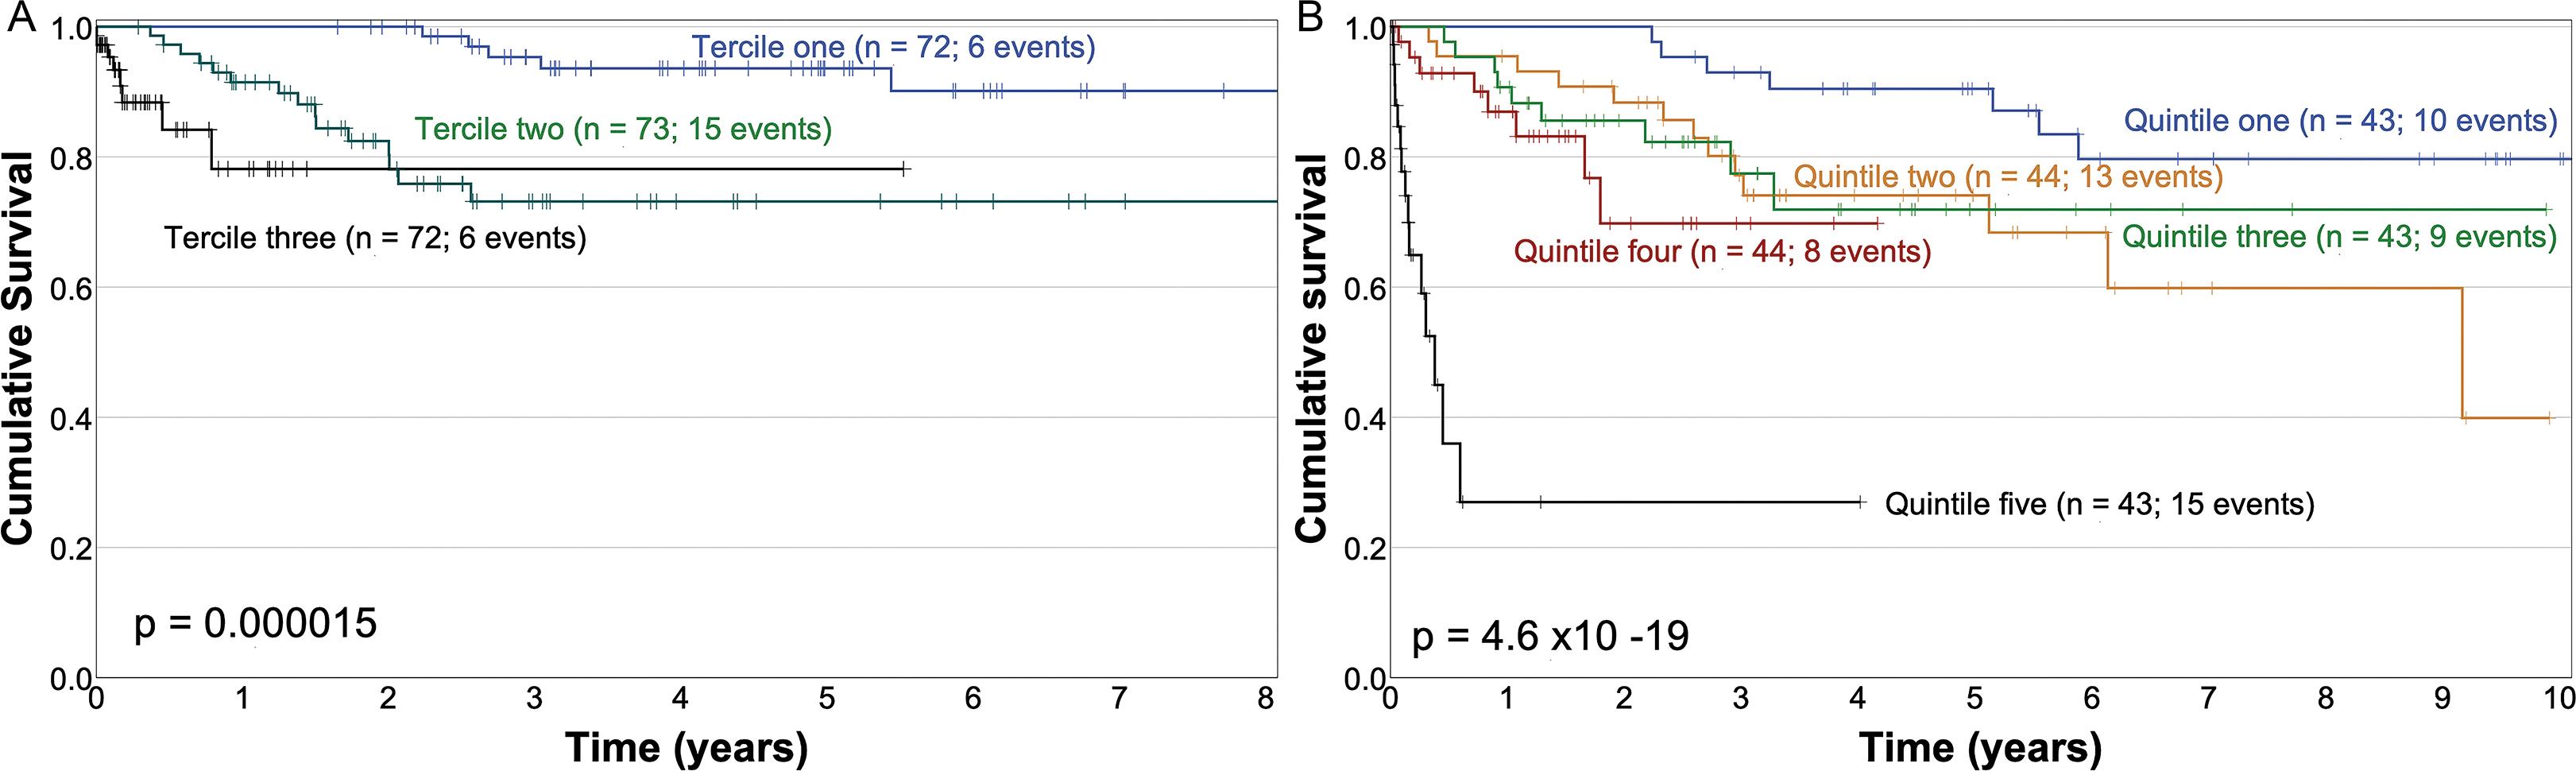
Figure 3. Kaplan–Meir overall survival curves in sub-groups of the "validation set" corresponding to: terciles of the expected survival function obtained with the parameters described in table 3 (disease-free survival) (A); quintiles of the expected survival function obtained with the parameters described in table 4 (overall survival) (B).
Table 4. Bivariate association of prognostic factors with "overall survival" in 556 patients from the entire cohort
| Factor | Hazards ratio | 95% CI | p-value |
|---|---|---|---|
| Male gender | 1.074 | 0.765-1.507 | 0.679 |
| Age | 1.003 | 0.992-1.015 | 0.552 |
| Location | |||
| Right colona | 1 | – | 0.282 |
| Transverse colon | 0.759 | 0.346-1.665 | 0.491 |
| Left colon | 1.143 | 0.655-1.996 | 0.638 |
| Sigmoid | 1.361 | 0.938-1.973 | 0.105 |
| Differentiation | |||
| Wella | 1 | – | 0.536 |
| Moderate | 1.122 | 0.719-1.751 | 0.613 |
| Poor | 1.524 | 0.812-2.86 | 0.189 |
| Undifferentiated | 1.395 | 0.686-2.839 | 0.358 |
| Carcinoembryonic antigen | 1.0000 | 1-1 | 0.074 |
| Hemoglobin | 0.961 | 0.902-1.023 | 0.209 |
| Hematocrit | 0.975 | 0.953-0.998 | 0.036 |
| Neutrophil count | 1.035 | 0.942-1.136 | 0.475 |
| Lymphocyte count | 1 | 0.999-1 | < 0.0001 |
| Platelet count | 0.999 | 0.997-1 | 0.03 |
| Monocyte count | 0.75 | 0.397-1.417 | 0.375 |
| Neutrophil/Lymphocyte ratio | 1.034 | 1.012-1.056 | 0.002 |
| Platelet/Lymphocyte ratio | 1.69 | 1.006-2.839 | 0.047 |
| Neutrophil/Platelet ratio | 1.013 | 1.001-1.024 | 0.03 |
| Serum albumin | 0.884 | 0.682-1.145 | 0.35 |
| Serum globulin | 0.999 | 0.814-1.228 | 0.996 |
| Albumin/globulin ratio | 0.826 | 0.48-1.422 | 0.49 |
| Prognostic nutritional index | 0.975 | 0.955-0.995 | 0.017 |
| Body mass index | 0.974 | 0.905-0.99 | 0.017 |
| Number of lymph nodes retrieved | 0.98 | 0.964-0.997 | 0.022 |
| T classification | |||
| T1a | 1 | – | 0.012 |
| T2 | 3.189 | 1.175-8.657 | 0.023 |
| T3 | 3.329 | 0.974-11.38 | 0.055 |
| T4 | 5.86 | 1.956-17.557 | 0.002 |
| R1 residual disease | 3.531 | 1.443-8.641 | 0.006 |
| Vascular lymphatic invasion | 1.095 | 0.596-2.011 | 0.769 |
| Vascular venous invasion | 0.923 | 0.456-1.867 | 0.823 |
| Perineural invasion | 1.323 | 0.48-3.648 | 0.589 |
| Use of adjuvant chemotherapy | 0.803 | 0.562-1.148 | 0.229 |
aReference category, numbers in bold characters represent statistical significance. CI: confidence intervals; p: probability values.
Overall survival
The median follow-up of both cohorts was 2.83 years (95% CI 2.6-3.1). Death during this period occurred in 136 patients (24.5%), and 420 (75.5%) cases were censored. Median OS was 11.7 years (95% CI 8.3-15.1). There were 81 death events in the "modeling set," and the median OS survival was 10.3 years (95% CI 9.1-10.96). There were 55 death events in the "validation set", and the median OS survival was 16.3 years (95% CI 4.59-27.9).
The bivariate association of prognostic factors with OS in both cohorts is described in detail in table 4. The expression of CDX2 and/or MUC2 was not associated with OS (Supplementary Fig. 2C and D). The bivariate association of the T classification and OS is shown in figure 4.

The final Cox model of the multivariate analysis of covariates associated with OS in the "modeling set" is described in table 5. This final model was analyzed for interaction terms and none were found; the model’s proportional assumptions were satisfactorily fulfilled. The estimated survival functions in each case in the "validation set" were calculated with the covariates and their estimators, as described in table 5, and were categorized by quintiles. Figure 3B shows the Kaplan–Meier OS curves of these quintiles in the "validation set".
Table 5. Cox proportional hazards model of the multivariate association of several covariates with "overall survival" in 339 patients in the "modeling set" (adjusted for location in the right or left colon)
| Covariates | β | SE | Exp β | 95% CI | p-value |
|---|---|---|---|---|---|
| Right colon locationa | – | – | 1 | – | – |
| Left colon location | 0.453 | 0.232 | 1.573 | 0.998-2.477 | 0.051 |
| Lymphocyte count > 1200 | −0.771 | 0.271 | 0.463 | 0.272-0.787 | 0.005 |
| Monocyte count | −0.001 | 0.001 | 0.999 | 0.998-1 | 0.026 |
| Neutrophil /platelet ratio < 2.35a | – | – | 1 | – | 0.009 |
| 2.35-4 | 0.274 | 0.291 | 1.315 | 0.743-2.328 | 0.347 |
| > 4 | 0.845 | 0.285 | 2.327 | 1.331-4.071 | 0.003 |
| Albumin/monocyte ratio > 2.4 | −0.844 | 0.358 | 0.430 | 0.213-0.868 | 0.018 |
| R0 residual diseasea | – | – | 1 | – | – |
| R1 residual disease | 2.168 | 0.529 | 8.741 | 3.096-24.674 | 0.00004 |
aReference category (−2 LogLikelihood 782.3; p = 1.07 × 10⁻⁷). β: regression coefficient; SE, standard error; Exp β: exponent of regression coefficient (hazard ratio); CI: confidence interval of Exp β; p: probability values.
DISCUSSION
The TNM staging system is the most valuable currently available tool to define the prognosis and guide treatment decisions in patients with colorectal cancer8. However, it has significant limitations when used to predict prognoses in specific patient sub-groups8,12. There is substantial variability in oncological outcomes that are not fully explained by the TNM staging system or other prognostic factors13. For instance, some patients with rectal cancer are less likely to obtain a permanent colostomy if they are treated in centers with high caseloads, older age is associated with less frequent use of adjuvant chemotherapy, African American patients are treated less aggressively and are more likely to die than white patients, low socioeconomic status is also associated with decreased OS, variations in treatment may also be associated with inadequate physician knowledge of updated treatment guidelines, there are regional differences in the availability of resources, patient or physician preferences of treatment alternatives, and the effects of molecular heterogeneity2,23.
The decision to use adjuvant chemotherapy in patients with Stage II CC is currently a controversial issue. This study intended to define prognostic factors by integrating demographic, clinical, biometrical, biochemical, histopathological, and immunohistochemical variables in terms of recurrence frequency, DFS, and OS, in a "modeling set," and the performance of these models was tested in a "validation set."
The total lymphocyte count is an independent prognostic factor in all three models (Tables 2, 3, and 5). The monocyte count is an independent prognostic factor in two models as well (Tables 3 and 5), and the AMR is an independent prognostic factor for recurrence and OS (Tables 2 and 5). These factors have been scarcely reported, underscoring the relevance of inflammatory markers in CC when accounting for various outcome measures15,24,25.
A potential pitfall of our study is the lack of determination of T lymphocytes and T lymphocyte subsets in the tumor microenvironment.
Immunonutritional factors have been reported to distinguish right from left CC, and aside from its role in the TNM classification, tumor location is also an important prognostic factor, since laterality is very relevant in this heterogeneous disease26.
We detected laterality as an independent prognostic factor for OS, but not for recurrence or DFS. We, therefore, adjusted all models for this covariate.
The main limitations of this study are the retrospective nature of the data and the long period over which the patients were treated at the institute. Further, in the selection of prognostic factors, we did not intend to test all those that have been previously studied but rather include the most accessible, least expensive, simplest, and most probable, so clinicians could easily apply this model when deciding whether or not to administer adjuvant chemotherapy.
The prognostic value of lymph node micrometastases identified with pancytokeratin was not evaluated due to the enormous number of resources required for immunohistochemical analysis -over 10,000 slides-, and because currently available information is scarce; it has been evaluated with low-powered analyses and not in a multivariate context27. Several studies have suggested various distinct ways in which CC tumors, either independently from or simultaneously as the primary neoplasm, present recurrence in patients with pN0 CC28. The molecular mechanisms mediating the dissemination of CC cells through lymph nodes and lymphatic vessels, blood vessels, or directly into the peritoneal cavity, remain to be established. There is a possibility that tumor cells might enter blood vessels directly, bypassing the lymph nodes11,29.
In this study, the ctDNA-guided approach was not investigated. This technology appears to be potentially useful when deciding to administer adjuvant chemotherapy in patients with Stage II CC, or when precluding its use, without compromising recurrence-free survival30. However, this is still an experimental approach, it is not readily available worldwide, and the OS has not been evaluated.
The main strength of our observational report is that it integrates data from a single cancer center with consistent treatment policies, based on readily available prognostic factors. Many of these prognostic factors have been reported occasionally, in small cohorts, by bivariate analyses, with poor statistical adjustments. These factors can be readily obtained by routine blood cytology or biochemistry analyses.
The loss of CDX2 expression has been reported as a prognostic factor associated with poor survival in patients with CC in Stages II and III31, and this information has been confirmed in many publications32. Loss of CDX2 and/or MUC2 expression has been reported as a biomarker of high recurrence risk and poor survival in CC18. However, CDX2 expression is strongly associated with other histopathological prognostic factors obtained with a basic hematoxylin-eosin histopathology analyses33, and these findings are consistent with our study. The expression of these markers plays no clear prognostic role in neither the bivariate nor the multivariate analysis in our data.
In our study, IHQ markers for mismatch repair were not evaluated. The prognostic value of deficient mismatch repair in colorectal cancer treated with chemotherapy has been extensively reported, and it appears to improve OS in some settings. However, in the specific case of Stage II CC, its prognostic role has not been defined, nor has its role in the decision-making process on the use of adjuvant chemotherapy34-36.
CC treatments have substantially improved in the past two decades and have led to superior outcomes. After curative treatment, however, 20% of patients with Stage I or II CC develop recurrent disease, and the use of adjuvant chemotherapy still hinges on empirical data, with a low evidence level.
Our study aimed to use routine, accessible clinical factors – basic blood cytology and chemistry – as a complement to the T classification. We described three models, one that can predict recurrence, a second one that predicts DFS, and a third to predict OS. The performance of the three models is acceptable, but they can be undoubtedly improved. Perhaps, adding factors such as the type of tumor budding and the maturity of the tumor stroma, variables in terms of gene expression, and the presence of mutations, could further improve their performance.
Patients with CC are consistently offered different surveillance protocols to detect recurrent disease or new neoplasms at an early and asymptomatic stage, and thus improve OS. Nevertheless, the optimal surveillance protocols remain controversial. Some possible implications of our study can aid in determining whether to apply intensive or conservative follow-up protocols, depending on the risk of recurrence, DFS, or OS. In Stage I or II CC, intensive follow-up may provide early identification of recurrences, timely treatment initiation, and improved outcomes after recurrence. Further, close management of comorbidities and early identification of incident comorbidities could also lead to superior outcomes37.
OS curves by T stage are presented in figure 4. The sub-group of patients with disease limited to the mucosa and submucosa (T1) has an excellent prognosis, and only four patients died (7.7%). Then, the prognostic model for OS is of limited utility in these cases. Conversely, patients with T4 disease have a dire prognosis, but there is a sub-group of patients in the OS model that had a worse prognosis than that established solely on the basis of the T4 classification (Fig. 3B). Thus, this OS model may be able to identify patients with the worst prognosis and can certainly guide the use of adjuvant chemotherapy in randomized controlled clinical trials.
These models are simple and readily available virtually at any center and could distinguish the risk and prognosis in patients with Stages I and II CC; these models require less expensive processes than the use of more sophisticated molecular biology techniques, including cDNA or identification of miRNA or nanovesicles. They may guide the need for adjuvant therapy versus post-operative surveillance only; additionally, they could also be tested as a stratification method in randomized clinical trials designed to define the role of adjuvant chemotherapy in patients with no disease.

