text new page (beta)
 English (pdf)
 Article in xml format
 Article references
 Send this article by e-mail
 Cited by SciELO
  Similars in
SciELO
Similars in
SciELO 
 Permalink
Nomenclature
A |
Core cross -sectional area [L 2] |
c o |
Storage coefficient [M -1 LT 2] |
c f |
Fluid compressibility [M -1 LT 2] |
c s |
Solid grain compressibility [M -1 LT 2] |
D |
Core diameter [L] |
E |
Drained Young modulus [ML -1 T -2] |
g |
Gravity acceleration [LT 2] |
G |
Shear modulus [ML -1 T-2] |
k |
Permeability [L 2] |
k o |
Initial permeability [L 2] |
k |
Permeability tensor [L 2] |
K |
Drained bulk modulus [ML -1 T -2] |
K s |
Bulk modulus solid [ML -1 T -2] |
L |
Core length [L] |
∆p |
Pressure drop [ML -1 T -2] |
p |
Fluid pressure [ML -1 T -2] |
p ∂ |
Pressure at the boundary [ML -1 T -2] |
p 0 |
Initial pressure [ML -1 T -2] |
p in |
Inlet pressure [ML -1 T -2] |
p out |
Outlet pressure [ML -1 T -2] |
q f |
Fluid source term [T -1] |
Q max |
Maximum flow rate [L 3 T -1] |
R |
Core radius [L] |
R e |
Reynolds number [-] |
T |
Time [T] |
t s |
Time to reach steady state flow [T] |
T |
Traction [ML -1 T -2] |
T ∂ |
Traction at the boundary [ML -1 T -2] |
u |
Fluid velocity [LT -1] |
u in |
Injection flow rate [L3 T -1] |
u ∂ |
Fluid flow at the boundary [LT -1] |
V r |
Rock volume [L 3] |
ω |
Displacement [L] |
ω δ |
Displacement at the boundary [L] |
ω 0 |
Initial displacement [L] |
W d |
Core dry weight [M] |
Greek
α |
Biot-Willis coefficient [-] |
β 1 , β 2 |
Permeability fitting parameters[-] |
ε ν |
Volumetric strain [-] |
λ |
First Lamé constant [ML -1 T -2] |
μ |
Fluid viscosity [ML -1 T -1] |
ν |
Drained Poisson ratio [-] |
φ |
Porosity [fraction] |
φ 0 |
Initial Porosity [fraction] |
ρ |
Fluid density [ML -3] |
ρ e |
Effective density [ML -3] |
ρ s |
Solid density [ML -3] |
σ 1 , σ 2 , σ 3 |
Main stresses [ML -1 T -2] |
σ c |
Confining stress [ML -1 T -2] |
σ e |
Effective stress [ML -1 T -2] |
σ T |
Total stress [ML -1 T -2] |
Ω |
Simulation domain |
Introduction
The behavior of saturated rocks under stress changes has been a recurring issue in several areas given the importance of knowing and predicting, for example, future production scenarios of a reservoir, storage of residual gas, basin subsidence, etc. The importance lies in the fact that, the coupling between fluid flow and mechanical behavior impacts the flow capacity of the porous medium as a consequence of the stress on its porous structure, altering the porosity and permeability of the rock. In oil reservoirs, it has been found that oil recovery can be importantly overestimated if the geomechanical effects are neglected (Ojagbohunmi et al. (2012).
Diverse publications on rock geomechanics have been devoted to experimentally analyze the stress-fluid coupling due to stresses in poroelastic media under diverse conditions (among others, Brace (1965), Jones and Smart (2002), Ma et al. (2012), Huo and Benson (2016), Han et al. (2016) and Belmokhtar et al. (2017)), and to analyze the permeability dependence on applied stress (Zhu et al. (1997), Zhu and Wong (1997), Lion et al. (2004), Fortin et al. (2005), Al-Quraishi et al. (2010), Takahashi et al. (2013) and Wang et al. (2016)). Simultaneously, other works have developed poroelastic models to mathematiccally describe the stress effects on permeability (Mandel (1953), Abousleiman et al. (1996), Cui and Abousleiman (2001) and Lamb and Gorman (2010)), and have also proposed empirical and theoretical correlations of the porosity and permeability dependence on stress and pore pressure (Kozeny (1927), Carman (1956), Walder and Nur (1984), David et al. (1994),Touhidi-Baghini (1998), Mainguy and Longuemare (2002) and Ma (2015)). Also, some few numerical simulations of this flow-stress coupling in homogeneous and fractured rocks have also been published (Bai et al. (1997), Rinaldi and Rutqvist (2016), Roded and Holtzman (2017), Agheshlui et al. (2018), Goral et al. (2020) and Sasaki and Rutqvist (2021)). Some of the conclusions are in general, that permeability changes result from a competetion between two mechanisms, (i) rock structure compaction that increases tortuosity and causes a decrease in permeability, and (ii) dilation of voids, that increases pore volume and increments permeability (Jones and Smart, 2002; Han et al., 2016). The presence of micro-fractures and large fractures in the rock can also importantly impact permeability response to stresses (Barthelemy, 2009).
Despite of its relevance, only few of the published experimental works consider carbonate rocks, and only few of them apply mathematical and numerical models to analyze and describe the observed permeability results as function of confinement stress. This work analyzes that little-explored part of experimental tests on carbonate rocks combined with their numerical simulation using a permeability-stress relationship linearly dependent on volumetric strain and pore pressure.
The paper is organized as follows. In the first section an introduction and a literature review is provided. In the second section a description of the experimental setup, the laboratory tests and the test results are given. In the third section, the poroelastic model is presented including the mathematical formulation, the initial and boundary conditions, the numerical discretization and its computational implementation. In the fourth section the application of the model to the hydrostatic and non-hydrostatic experimental tests is shown. In this section, also a comparison between the numerical simulation and the permeability experimental results is presented. The concluding remarks are shown in the last section.
Experimental Setup
The Bedford limestone samples employed in this study (see Fig. 1) were characterized by X-ray diffraction analysis (XDR), X-ray micro-tomography and geomechanical testing. Their composition is 97 %w calcium carbonate and 3 %w silicon oxide. They have an average effective porosity of 13.8 %, a pore throat size in the range of 40-52 µm, very irregular grain shapes with grain density of 2,711 kg/m3, a drained Young modulus ( E ) of 16.1 GPa, and a drained Poisson ratio (ν) of 0.15 (Coronado, 2019).

The permeability study was performed in two cylindrical samples (A and B) which were cored from a Bedford limestone block. The dimensions and physical properties of the cores are shown in Table 1. The displacement fluid used in the test was distilled water in order to prevent pore obstruction due to scale formation and deposition, and also to avoid calcite dissolution.
Table 1 Physical properties of the Bedford limestone samples.
| Property | Dimensions | Bedford A | Bedford B |
|---|---|---|---|
| Core length (L) | m | 0.127 | 0.123 |
| Core diameter (D) | m | 0.1016 | 0.1016 |
| Porosity (φ) | % | 13.6 | 14.0 |
| Permeability (k) | m2 | 1.51 × 10⁻¹³ | 1.23 × 10⁻¹³ |
| Core cross-sectional area (A) | m2 | 8.17 × 10⁻³ | 8.17 × 10⁻³ |
| Rock volume (V r) | m3 | 1.03 × 10⁻³ | 1.00 × 10⁻³ |
| Core dry weight (W d ) | kg | 2.25 | 2.18 |
Traditionally, Hoek and Hassler coreholders are used in laboratory to measure dynamical properties as function of the rock mechanical properties. Instrumented Hoek triaxial coreholders can handle independently axial and confining (radial) stress and allow strain measurements in both radial and axial directions (Hoek and Franklin, 1968). In contrast, Hassler coreholders used in SCAL testing (McPhee et al., 2015) (Figure 2) can work in two possible test configurations: hydrostatic and non-hydrostatic. In the first case the radial confining stress equals the stress on the sample endfaces. On the other hand, in the second case, the radial confining stress differs from the endface stress. Sample A was employed in the non-hydrostatic tests, and sample B in the hydrostatic ones. Here, for evaluating stress effects on samples permeability a Hassler coreholder was used. The core is loaded in a Viton rubber sleeve and its endfaces are set in contact with the stainless steel difusser at each end. These are attached to the inlet and outlet fluid lines.

The fluid displacement system is composed by a Quizix pump Q5000, a back pressure regulator (BPR) controlled by a Teledyne Isco 260D syringe pump, pressure and temperature sensors and a National Instruments data acquisition unit. The pressure sensors measure the pressure at the sample endfaces, and the differential pressure transducer measures the pressure drop across the sample. The temperature sensor was set at coreholder body. The data adquisition system was programmed in LabVIEW 2018. A schematic view of the displacement system is shown in Figure 3.

The confining stress was applied by pressurizing the hydraulic fluid (distilled water) between the wall of the coreholder and the Viton sleeve. This confining stress was servo controlled by the Quizix pump. The Viton sleeve used to seal the sample was capable of withstanding a maximum confining pressure of 27.5 MPa without rupture. The sample pore pressure was set by pressurizing distilled water inside the sample, controlled by the BPR. A clean and dry sample covered by the viton rubber was set in the coreholder. After assembling the system and calibrating the pressure and temperature sensors, all the fluid lines together with the sample was air evacuated for 45 min.
Following the standard method, the sample was saturated at a confining stress (σ c) of 13.8 MPa and at a room temperature (295 K). A constant flow rate of 0.1 ml/min was applied until the inlet pressure (p in ) reaches a plateau (approximately after 48 h) at 6.9 MPa. The resulting differential pressure (σ c -p in ) of 6.9 MPa was enough to avoid core-sleeve interface flow and provides a seal between the sleeve and the coreholder.
The initial connected porosity was calculated from the saturated sample density, by considering distilled water and the rock matrix densities (Ramos da Silva et al. (2010). The resulting porosity values are 13.6 % and 14.0 % for A and B samples, respectively.
Four permeability tests on samples A and B were carried out using the steady state method at constant flow rate (1, 2, 3 and 4 ml/min). The pressure drop was used to evaluate the permeability by the Darcy’s law. The laminar flow assumption behind Darcy’s law (Glowacki and Seladurai (2016) Selvadurai and Selvadurai (2010) holds, since the estimated maximum interstitial fluid velocity is 5×10⁻⁵ m/s, which corresponds to a maximum Reynolds number (R e ) of 0.003, and satisfies the Philips (1991) condition R e <φ, and Bear (1972) condition R e <φ. The permeability values obtained at these confining stresses are 1.51 × 10⁻¹³ m2 and 1.23 × 10⁻¹³ m2 for A and B samples, respectively.
In the non-hydrostatic test, the outlet pressure was controlled by the BPR and the inlet pressure was set by the Quizix pump at constant pressure (6.9 MPa), that is achieved by adjusting its flow rate. The axial stress equals the atmosferic pressure and the boundary condition at the core sample axial faces is zero displacement (see Figure 4). The experiment starts with the application of a series of confining stress for a time period of 40 min. During this time, the inlet and outlet pressures, the pressure drop, the confining pressure, the injected and recovered fluid volumes and the temperature were recorded. These tests are carried out for eight confining stresses as shown in Table 2.
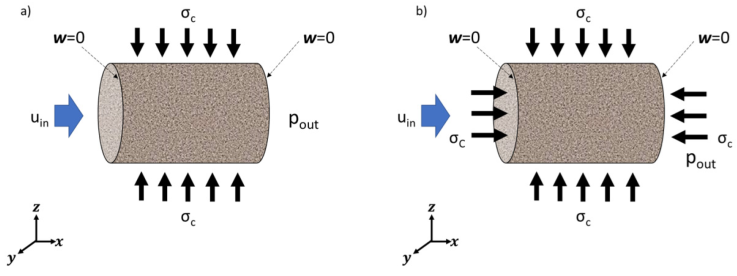
Figure 4 Schematic view of the boundary conditions: (a) the non-hydrostatic case, where ω r = ω x = 0 at the end faces and (b) the hydrostatic case, where ω r =0 at the end face. Fluid is injected at constant flow rate from the left side, while pressure is set constant at the right side.
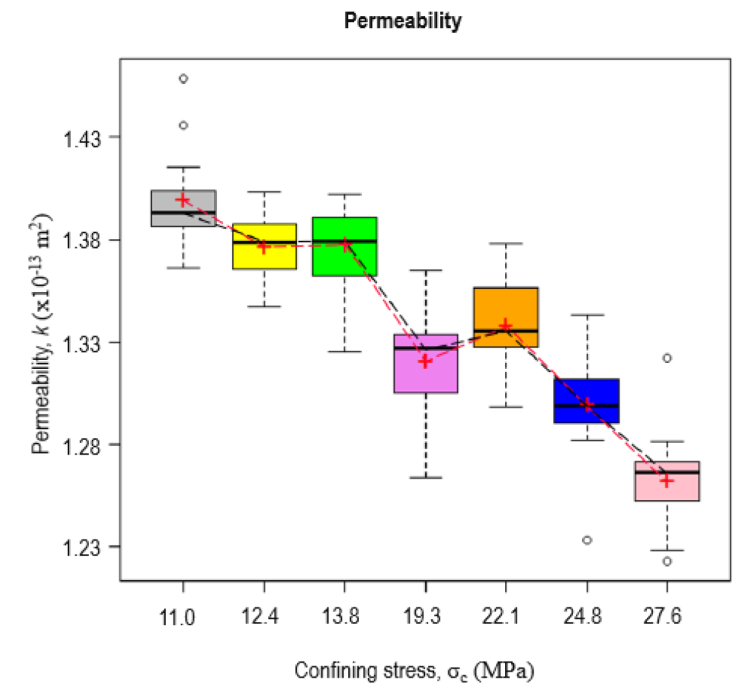
Table 2 Mean and standard deviation of permeability (×10-15 m2) data for non-hydrostatic tests.
| Pore Pressure | Confining stress (MPa) | |||||||
|---|---|---|---|---|---|---|---|---|
| (MPa) | 9.7 | 11.0 | 12.4 | 13.8 | 19.3 | 22.1 | 24.8 | 27.6 |
| 6.9 | 111±0.3 | 139±0.2 | 138±0.2 | 138±0.3 | 133±0.2 | 134±0.2 | 130±0.2 | 127±0.3 |
The hydrostatic tests have the same boundary conditions as the non-hydrostatic tests, with the only difference being that the axial confining stress and radial confining stress are the same. In a similar way, these tests are carried out for six confining stresses as shown in Table 3.
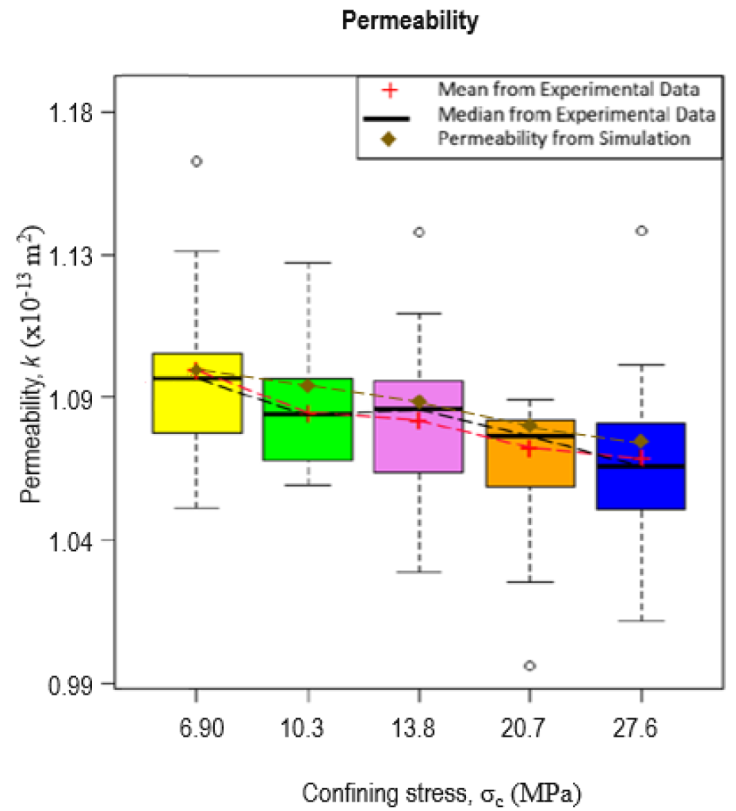
Table 3 Mean and standard deviation of permeability (×10-15 m2) data for hydrostatic tests.
| Pore Pressure | Confining stress (MPa) | |||||
|---|---|---|---|---|---|---|
| (MPa) | 3.4 | 6.9 | 10.3 | 13.8 | 20.7 | 27.6 |
| 2.1 | 108±0.3 | 109±0.3 | 108±0.3 | 108±0.3 | 107±0.4 | 106±0.3 |
The permeability results for non-hydrostatic and hydrostatic tests are presented in Table 2 and Table 3, respectively.
Poroelastic Model
This model describes a single phase flow of a slightly compressible fluid in a porous medium with linear elastic deformation (Díaz-Viera et al. (2020)). The rock deformation is described by a quasi-steady state moment equilibrium equation. The influence of the fluid is explained through the concept of effective stress due to Terzaghi (1923, 1925) and Biot (1941, 1955). The total stress acting on a porous medium is supported by both the solid matrix and the saturating fluid. The effective stress represents the part of the total stress supported by the solid matrix and can be determined as a function of deformation.
The model considers an isothermal system composed by one fluid and one solid, each consisting of a single component. The solid phase is a deformable porous medium fully saturated by the fluid, which is assumed Newtonian. Both, fluid and solid are slightly compressible. The solid phase is at rest, only displacements caused by mechanical stresses are present. Also, the solid has a linear elastic behavior and satisfies the Hooke’s law for its constitutive stress-strain relationship.
The poroelasticity equation system consist of a momentum and a mass balance equation derived by Biot (1941, 1955). Here the model formulation follows Showalter (2000) notation. The monophasic flow model corresponds to a deformable linear elastic porous medium and it is formulated by Biot (1955); Chen et al. (2004).
where c 0 is the storage coefficient, p is the fluid pressure, also known as pore pressure, α is the Biot-Willis coefficient (Biot and Willis (1957)) with 0 ≤ α ≤ 1, ω is the displacement vector, k is the permeability tensor, μ is the fluid viscosity, ρ is the fluid density, g is the gravity acceleration, z is the elevation and q f is the fluid source term.
The storage coefficient c 0 is defined as
where φ is the porosity, c r is the solid grain compressibility and c f is de fluid compressibility.
The quasi-stationary momentum balance equation for a porous medium saturated with a fluid is
where σ T =σ e - αpI is the total stress tensor and σ e is the effective stress tensor. While ρ e is an effective density defined as φρ+(1-φ)ρ s , being ρ s the rock density.
In particular, the effective stress tensor according to Hooke’s law for the linear homogenous and isotropic case can be expressed as
where G and λ are the shear modulus and first Lamè constant, respectively. Note that the porosity and the absolute permeability tensor can be function of pore pressure (p), displacements (ω), volumetric strain (ε v ) or other quantities. Here, the solid mechanics sign convention is considered, which means that compressive stresses are negative and tensile stresses are positive.
The poroelasticity problem consists in solving Eqs. (1) and (3), and the unknowns are pore pressure (p) and the displacement (ω). The initial and boundary conditions are
Initial conditions
where p 0 and w 0 are initial values for pore pressure and displacement, respectively.
Boundary conditions
where ω ∂ , T ∂ , p ∂ and u ∂ are displacement, traction, pressure and fluid flow at the boundary, respectively. Here, Ω is a bounded domain with boundary ∂Ω formed by two parts, one with Dirichlet conditions ∂ D Ω and the other with Neumann conditions ∂ N Ω, where ∂Ω = ∂ D Ω ∪ ∂ N Ω and ∂ D Ω ∩ ∂ N Ω =Ø.
The fluid flow is expressed by the Darcy’s law
where u is the Darcy velocity.
The numerical model is implemented using the module PDE, Coefficient Form in COMSOL Multiphysics (2018).
Numerical simulations
In this section, the numerical simulations of two case studies corresponding to non-hydrostatic and hydrostatic compression tests are presented. In both cases, the effect of the stresses on the petrophysical properties (permeability and porosity) is studied. To this purpose the previous poroelastic model is applied together with constitutive relationships for porosity and permeability in term of stress.
Porosity-stress relationship
Here, the porosity as a function of stress, proposed by Mainguy and Longuemare (2002) and described by Coussy (2004) is used. It provides a porosity relationship in terms of the volumetric strain (ε v ) and pore pressure (p) as follows
where φ 0 , ε v0 and p 0 are initial porosity, volumetric strain and pore pressure, respectively. Permeability-stress relationship
The permeability-stress relationship used in this work is given in terms of volumetric strain (ε v ) and pore pressure (p), as follows
where k 0 , ε v0 and p 0 are initial permeability, volumetric strain and pore pressure, respecttively, and β 1 and β 2 are fitting parameters as in the previous work by Vadillo-Sáenz et al. (2020a), where it was shown that the frequently used permeability relationships can be approximated by a linear stress relationship. Accordingly, porosity and permeability, in Eq. (12) and (13) are linear functions of volumetric strain and pore pressure, respectively.
It should be mentioned that the fluid compressibility ( c f ), fluid density ( ρ ), solid density ( ρ s ), maximum flow rate ( Q max ), bulk modulus solid ( K s ), drained Young modulus ( E ), drained Poisson’s ratio ( ν ), Biot-Willis coefficient (α), rock compressibility ( c s ), drained bulk modulus ( K ), first Lamé constant ( λ ) and shear modulus ( G ) are all kept constant during the numerical simulation.
In the Figure 4 a schematic representation of the boundary conditions for the hydrostatic and non-hydrostatic tests are shown.
All equations are discretized using a standard finite element method in space, and the Euler’s back-ward finite difference method for time discretization, what gives place to a fully implicit scheme.
The finite element method is applied by using quadratic Lagrange elements in an unstructured triangular/tetrahedral mesh in 2D/3D. The resulting linear algebraic system is solved by the LU direct method UMFPACK for non symmetric and sparse matrices. The Newton-Raphson method is applied when the problem becomes non-linear.
The numerical model was implemented in COMSOL Multiphysics (COMSOL Multiphysics, 2018) and it was validated by comparing the numerical solution with the anaytical solution of the classical Mandel consolidation problem (Mandel, 1953; Abousleiman et al., 1996). A more datailed description of the problem and its validation are given in Vadillo-Sáenz et al. (2020a).
Case study A: Non-hydrostatic Compression Tests Simulation.
The initial conditions for pore pressure is set equal to the outlet pressure (p 0 = p out ) and zero for displacement (ω 0 = 0), respectively. The core is subjected to a constant pore pressure of 6.9 MPa and the radial confining stress sequence shown in Table 2, each for a time period of 40 min. The left and right sides are fixed, i.e. non-displacement in both radial and axial directions.
The problem is solved numerically by considering a 3D cylindrical domain with radius R = 0.051 m and length L=0.127 m as displayed in Figure 4 and Table 1. The domain is partitioned by an unstructured mesh of 2,420 tetrahedral elements. The simulation data for the non-hydrostatic compression tests are given in the Table 4.
Table 4 Non-hydrostatic compression tests data. Asterisk (*) means that the median value of the equilibrium flow rate was taken.
| Parameter | Value | Unit |
|---|---|---|
| Fluid compressibility (c f ) | 4 × 10⁻¹⁰ | 1/Pa |
| Fluid density (ρ) | 1000 | kg/m3 |
| Solid density (ρ s ) | 2530 | kg/m3 |
| Confining stress (σ c ) | 12.4 | MPa |
| Maximum flow rate (Q max ) | 15 | ml/min |
| Bulk modulus solid (K s ) | 14.4 | GPa |
| Drained Young modulus (E) | 16.1 | GPa |
| Initial porosity (φ 0) | 13.63 | % |
| Initial permeability (k 0 ) | 1.39 × 10⁻¹³ | m2 |
| Outlet pressure (p out )* | 6.67 | MPa |
| Drained Poisson’s ratio (ν) | 0.15 | - |
| Coreholder temperature | 295.78 | K |
| Time to reach flow steady state Q max (t s ) | 20 | min |
| Fluid viscosity (µ) | 9.4×10⁻⁴ | Pa·s |
| Biot-Willis coefficient (α) | 0.47 | - |
| Rock compressibility (c s ) | 6.93 × 10⁻¹¹ | 1/Pa |
| Drained bulk modulus (K) | 7.61 | GPa |
| First Lam´e constant (λ) | 2.98 | GPa |
| Shear modulus (G) | 6.95 | GPa |
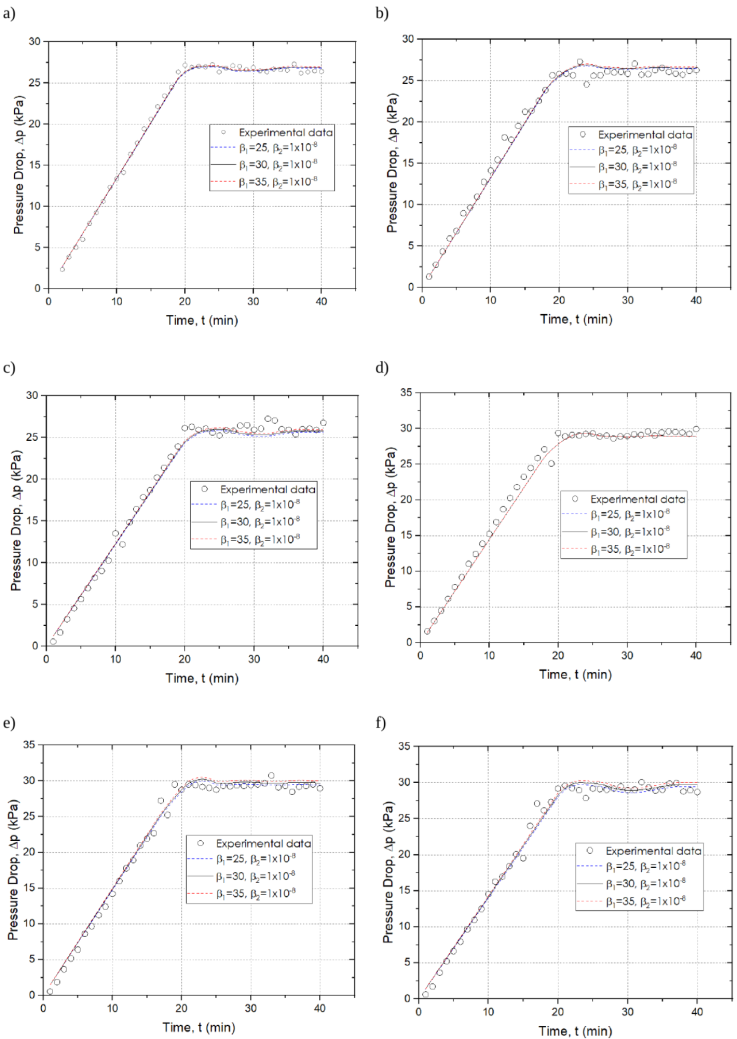
On evaluating permeability by Eq. (13) each confinement stress, a fitting procedure to match the experimental pressure drop was carried out. The parameter β 1 best fit value is 30 with a very little variation in a range of ±5, while the parameter β 2 is practically insensitive with a best fitting value of 1×10⁻⁸ Pa-1 for all cases. Figure 9 in Appendix A shows the best fit obtained at each confining stress for non-hydrostatic compression tests.
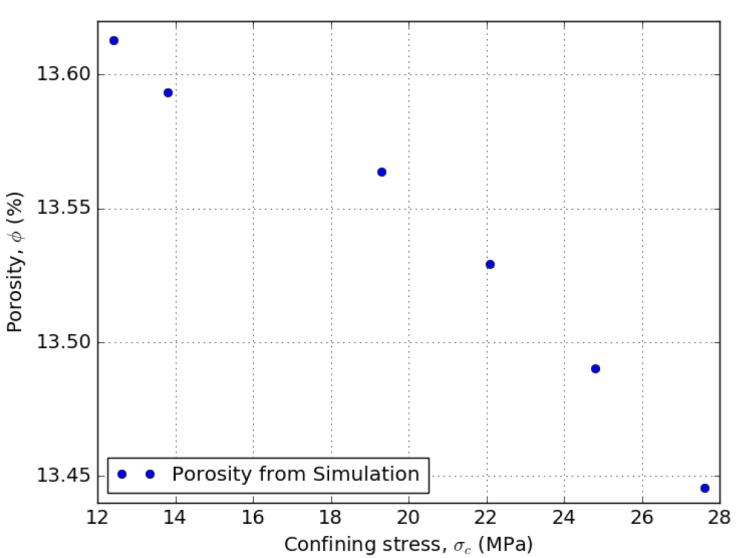
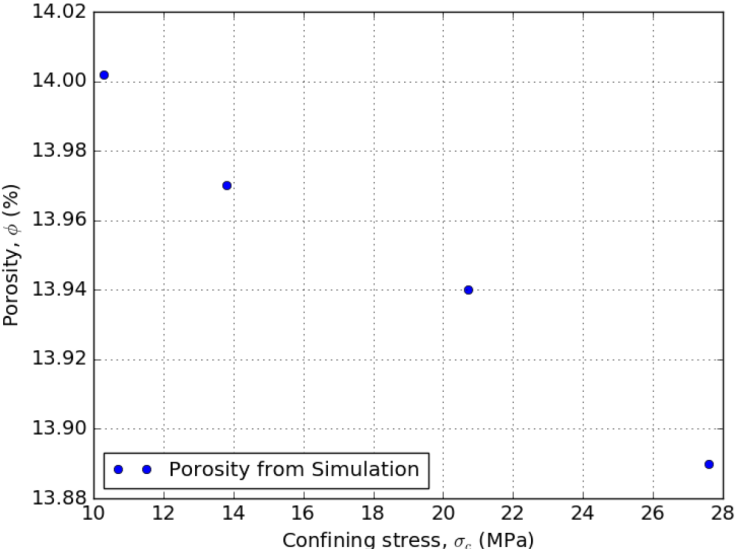
The porosity and permeability simulation results for the non-hydrostatic compression tests are displayed in Figures 5 and 6, respectively. The porosity change (Figure 5) corresponds to the physically expected behavior when subjecting a core to increasing confining stress. A reduction of approximately 1% of the porosity in the core is shown. It is important to notice that no measurements of porosity were made, it is only evaluated through Eq. (12). It could be observed in Figure 6 that the general trend shows the expected behavior of a core subjected to a increased confining stress except for the value at confining stress 19.3 MPa. It is also seen in Figure 6 that all numerical results (brown diamonds) fall within the boxplot of each test except in the aforementioned point. A core permeability reduction of approximately 8% at the end of the non-hydrostatic compression tests is observed. The simulated permeability values versus the experimental data give an acceptable RMS fitting error of 0.125.
Case Study B: Hydrostatic Compression Tests Simulation
In the hydrostatic case, the in Table 3 given confining stress sequence is applied for 50 min time period while keeping to all sample faces at a constant pore pressure of 2.1 MPa. Both left and right core sides are subjected to a non-displacement condition in the radial direction only (ω r = 0), the rest of the initial and boundary conditions are the same as in case A. The system domain is a 3D cylinder of radius R = 0.051 m and length L = 0.128 m.
Figure 4 and Table 1. The mesh is made up of 2,440 tetrahedral elements. The values of the parameters that are different from case A are given in the Table 5.
Table 5 Hydrostatic compression tests data. Asterisk (*) means that the median value of the equilibrium flow rate was taken.
| Parameter | Value | Unit |
|---|---|---|
| Solid density (ρ s) | 2634 | kg/m3 |
| Confining stress (σ c ) | 10.3 | MPa |
| Initial porosity (φ 0 ) | 14.02 | % |
| Initial permeability (k 0 ) | 1.09 × 10⁻¹³ | m2 |
| Outlet pressure (p out )* | 1.94 | MPa |
| Coreholder temperature | 294.5 | K |
| Time to reach flow steady state Q max (t s ) | 36 | min |
| Fluid viscosity (µ) | 9.5×10⁻⁴ | Pa·s |
In the same way as in the non-hydrostatic compression tests Eq. 12 was used to estimate the dependence of rock porosity as a function of stress. The final results obtained for the non-hydrostatic compression tests are displayed in Figure 7. The porosity change shows the physically behavior expected for a core subject to an increasing confinement stress. A reduction of approximately 1% of the porosity in the core is estimated.
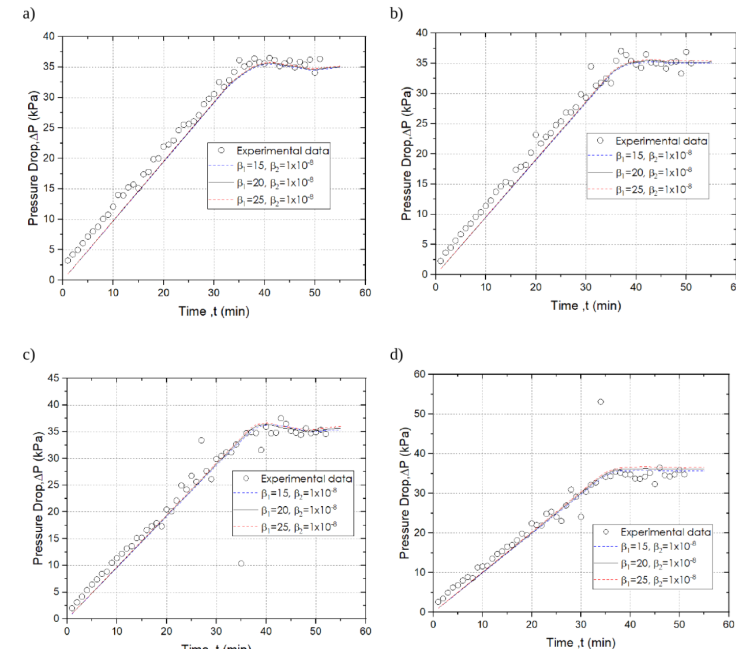
The best β 1 fit value is 20 with small variations near ±5. The β 2 parameter is practically insensitive, taking in all cases its best fit value at 1 ×10⁻⁸ Pa-1, for all cases. The Figure 10 in Appendix A shows best fit values obtained in the hydrostatic tests.
The results displayed in Figure 8 show the physically expected behavior in a core subjected to an increasing confining stress. No values outside of the general trend appear. A reduction of approximately 2% of the permeability in the core at the end of the hydrostatic tests is observed. A difference between the experimental permeability data and the simulation results of 0.844 RMS error is seen.
Conclusions
Permeability experimental results in terms of volumetric strain and pore pressure in Bedford limestone cores for hydrostatic (low shear stresses) and non-hydrostatic (high shear stresses) tests, in the elastic range have been here presented. Also, a mathematical model has been shown to describe the effect of the confinement stress on rock porosity and permeability by considering single-phase flow and elastic rock response. The main results and conclusions are:
The literature review shows that multiple experimental results on the effect of confinement stress on permeability in sandstone rocks have been reported, but only few tests in carbonate rocks have been performed, despite its relevance. It was found in the present work, that permeability in Bedford limestone is more sensitive to stress than sandstones.
The effect of stress on permeability is clearly stronger when higher shear stresses are present (non-hydrostatic tests), than when small shear stresses are applied (hydrostatic tests). In the linear confining stress range analyzed, from 10 to 28 MPa, the non-hydrostatic case gives a reduction of 8% (with a pore pressure of 6.9 MPa) and in the hydrostatic case gives place to only 2% (with a pore pressure of 2.1 MPa). The above behavior could be explained by noticing that shear stresses can lead to large pore spaces reductions, probably due to a better rearrangement and closure of the internal porous structure of the Bedford limestone, which is made up of highly irregular grains.
There are very few studies published in the literature in which both experimental tests and numerical simulation results of the change in permeability as a function of stress are presented. For this purpose, a in-house mathematical and computational model has been developed. The few experimental published tests that include modeling employ, third-party software whose operation and results interpretation is not entirely clear.
The model used to analyze the pressure drop experimental data involves fitting parameters permeability-stress correlation model (Eq. 13). The data fitting achieved has been excellent. This indicates that the mathematical model developed describes adequately the phenomenon.
Based on the results here obtained, this work provides useful information for formulating and validating constitutive models for the flow-stress dependence in homogeneous and isotropic poroelastic media. Larger data fitting differences could be expected when working with deformable fractured porous media.