


 text new page (beta)
 English (pdf)
 Article in xml format
 Article references
 Send this article by e-mail
 Cited by SciELO
  Similars in
SciELO
Similars in
SciELO 
 Permalink
Introduction
The chemical composition of geothermal fluids depends on the type of rocks in which they are stored. The two-phase flow appears due to the pressure drop which occurs when the reservoir fluid ascends through the production pipe, from the bottom to well head. Depending on several factor as: concentrations of salts, solubility of minerals, saturation states of characteristic minerals, temperature and pH of the system, super-saturated solutions can be produced from which solid phases precipitate as scaling. The most abundant gases found in geothermal reservoirs are carbon dioxide (CO2), hydrogen sulfide (H2S), nitrogen (N2), hydrogen (H2), and methane (CH4). The salts present in the liquid phase are sodium chloride (NaCl), potassium chloride (KCl), calcium carbonate (CaCO3), calcium chloride (CaCl2 ) and silica (SiO2).
The most representative ternary mixture of geothermal fluid is H2O-NaCl-CO2(Battistelli et al., 1997). CO2 represents the effect of the non-condensable gases (Battistelli et al., 1993; Iglesias and Moya, 1998; Pruess and Garcia, 202; Lu et al., 2006) whereas the term used in THOUGH2 as NaCl represents that of total salts of reservoir fluid (Pritchett, 1993; Battistelli et al., 1997). The concentration of salts in the geothermal reservoirs is variable. Cases have been reported with salinities of relatively low percentages, between 0 and 3% by weight, up to high percentages of 28% by weight. The former, is the case of most Mexican geothermal fields (Bernard-Romero and Taran, 2010); whereas the latter encompasses the cases of the hypersaline geothermal reservoirs of Salton Sea (Sanyal et al., 2011) and of Tuzla in Turkey (Demir et al., 2014; Baba et al., 2015). The salts precipitation occur because of complex reactions that take place either at the reservoir or in the well because of pressure drops during production, in such cases clogging of pipes and generation equipment can occur. However, the most severe effect is the significant decrease in the well’s productivity caused by scaling formed in the porous matrix of the rock formation, affecting its permeability. Understanding the behavior of the parameters productivity and permeability, may allow to take the pertinent precautionary actions to maintain a good well exploitation (Newton and Manning, 2002).
One of the most utilized tools to characterize the behavior of the productivity of a well is the analysis of its pressure and its mass flow, whose correlation leads to the creation of production curves of the well. Using the parameters measured at wellhead conditions, characteristics or output curves can be obtained. Whereas by using measurements at bottom hole conditions, inflow curves are obtained (IPR, Inflow Performance Relationships). The behavior of these curves reflects the thermophysical conditions of the reservoir at the region surrounding the well, at its feeding stratum. In order to obtain a complete characteristic curve in field, it is required for the well to be disconnected from the generation power plant. This can be time consuming and lead to economic losses. However, alternative methodologies relying on numerical simulations allow the generation of theoretical IPR curves, denominated inflow type-curves. Inflow type-curves were initially developed for oil reservoirs (Gilbert, 1954; Vogel, 1968) considering reservoir models of radial flow and an ample interval of fluid properties. Klins and Majcher (1992) developed and proposed a dimensionless IPR with damage effect using field information of 1400 oil wells.
Iglesias and Moya (1990) developed the first inflow type-curve for geothermal reservoirs (theoretical GIPR, Geothermal Inflow Performance Relationships) considering the existence of pure water at the reservoir. In a later study, Moya (1994) incorporated the effect of non-condensable gases developing a solubility model for the binary mixture H2O-CO2(Moya and Iglesias, 1992; Iglesias and Moya, 1992). The applicability of these type-curves for the estimation of the productivity of geothermal wells was discussed by Moya et al. (1998) and Iglesias and Moya (1998). This methodology to estimate the productivity of geothermal wells was automated (Moya and Uribe, 2000) and later complemented with the estimation of the permeability of the rock formation adjacent to the well (Moya et al., 2001; 2003). Montoya (2003) developed inflow type curves for the ternary mixture H2O-CO2-NaCl with salinity of 0.5% by weight, applying the solubility model of Batistelli et al., (1997). Meza (2005) generated inflow type-curves for the same ternary mixture considering a high salt content by using the geothermal simulator TOUGH2 (Pruess et al., 1999), which includes the model of Batistelli et al., (1997). The initial temperature and gas saturation conditions were of 300°C and 0.005, respectively. The initial absolute permeability was 10 mD and a relative permeability of Corey type was considered. Flores (2007) complemented the work of Meza (2005) by incorporating the initial gas saturation effect in an interval of 0.05 to 0.45. Furthermore, inflow type curves with damage effect were developed by Aragón (2006) and applied in the determination of damage in geothermal wells (Aragón et al., 2008; Aragón et al., 2013).
This study shows geothermal inflow type-curves obtained through the numerical simulator TOUGH2 considering the ternary mixture H2O-CO2-NaCl with a high content of salts and under different initial gas saturation conditions of the fluid. The effects that the salts precipitation and gas saturation have on the changes of permeability in the geothermal reservoir are quantified and discussed. The practical uses of the obtained inflow curves, could be applied to geothermal fields furthermore are discussed. The developed type curves are focused to reservoirs with critical characteristics such as, low permeability, high degree of salts precipitation and high gas saturation.
Methodology
Physical Model
The physical model in this study consists of a cylindrical reservoir with 1000 m radius and 100 m depth. In its center a vertical well is situated, which produces at a constant mass flow rate (Figure 1). The flow in the porous medium is in radial direction following Darcy’s law and consists of the ternary mixture H2O-CO2-NaCl. The reservoir is considered as a homogenous porous medium that is impermeable and adiabatic from above and below. The thermophysical properties of the reservoir are shown in Table 1.

Mathematical Model
Conservation Equations
The mass and energy balance equations for a system of NK mass components distributed in NPH phases, are written in the following general form (Pruess et al., 1999; Pruess, 1988):
The integration is over an arbitrary subdomain Vn of the flow system under study, bounded by a closed surface Γ n. In the accumulation term, M denotes mass or energy by unit of volume. 1 < K < NK, comprises the mass components such as water, salinity and CO2; whereas for K = NK+1 the heat component is included. F represents the heat or mass fluxes. The individual phase fluxes are given through the multiphase version of Darcy’s law. The sources and sinks are represented by q. The heat flux contains conductive and convective components.
TOUGH2V2.0 allows to manage different fluid mixtures by defining the properties of each mixture separately through the modules of equations of state. The EWASG module includes the model of Battistelli et al. (1997) for the ternary mixture H2O-NaCl-CO2. In this model gas dissolution in the aqueous phase is described by Henry´s law and includes the Cramer correction (1982) to consider the effect of a decreased CO2 solubility in the liquid phase due to the presence of salts (“salting out”). The thermophysical property correlations used in EWASG are accurate for most conditions of interest in geothermal reservoir studies (Pruess et al., 1999) at temperatures in the range from 100 to 350 °C, fluid pressures up to 80 MPa, CO2 partial pressures up to 10 MPa, and salt mass fraction up to halite saturation. In the EWASG module NK = 3, NPH = 3; and K = 1, 2, 3, 4 indicate water, salinity, noncondensible gases, and heat components respectively. The accumulation and mass flux terms for the salinity (k = 2) are written as follows:
where S is saturation, being SS the solid saturation defined as the fraction of pore volume occupied by solid salt. X is the mass fraction, K the intrinsic permeability, K r the relative permeability, m the dynamic viscosity, P the pressure, and g the acceleration of gravity
Permeability Reduction
The EWASG module includes the Verma and Pruess (1988) model which consists of idealized geometries to correlate the permeability changes as a function of the modified porosity by the distribution of the precipitated minerals. The tubes in series geometry (alternating segments of capillary tubes with larger and smaller radii) is able to represent the presence of “bottle-necks” (Battistelli et al., 1997) in the flow channels and the permeability can be reduced to zero at a finite porosity (critical porosity). From this geometry the following relationship can be derived (Verma and Pruess, 1988):
being
where the parameter ∅C denotes the fraction of original porosity at which permeability is reduced to zero and is the fractional length of the pore bodies. The parameter w is given by
The value of ∅C = t = 0.8 is the most commonly used in simulations (Pruess and García, 2002; Pruess et al., 1999; Battistelli et al., 1995, 1997) which was estimated to reduce the permeability by 82% of its original value assuming a salt precipitation of only 2%. This study uses tubes in series model with a value of ∅C = t = 0.8. A more thorough explanation of the mathematical model can be found in Battistelli et al. (1997) and Pruess et al. (1999).
Numerical Method
TOUGH2 uses the method of integral finite differences (Pruess, 1988; Narasimhan and Wintherspoon, 1976) for the spatial discretization of the conservation equations, Newton-Raphson for linearization, and a robust solver for matrix inversion.
The characteristics of the evaluated cases in this study are shown in Table 2. All cases were simulated using a 28 node radial grid. The node positions are given by rn = 0.1(2)(n-1)/2. Simulations for the different cases were carried out at different constant flowrates. For each run, the pressure of the inflow at the feed-point of the well was recorded for different percentages of cumulative mass produced. In this way, geothermal inflow type-curves (theoretical GIPR) for fixed cumulative mass produced (e.g., 5, 10, …, 80%) were inferred.
Table 2. Study cases
| Initial temperature (°C) | Initial pressure (bar) | K 0 (mD) | K r | Initial % % CO 2 (by weight) | Initial % salinity (by weight) | Initial gas saturation | % cumulative mass produced |
| 300 | 91.28 | 10 | Corey | 0.5 | 5 | 0.05, 0.15, 0.30, 0.45 |
5, 10, 15, 20, 25, 35, 40, 45, 50, 55, 60, 65, 70, 75, 80 |
| 300 | 84.60 | 10 | Corey | 0.5 | 15 | 0.05, 0.15, 0.30, 0.45 |
5, 10, 15, 20, 25, 35, 40, 45, 50, 55, 60, 65, 70, 75,80 |
| 300 | 76.81 | 10 | Corey | 0.5 | 25 | 0.05, 0.15, 0.30, 0.45 |
5, 10, 15, 20, 25, 35, 40, 45, 50, 55, 60, 65, 70, 75,80 |
Results
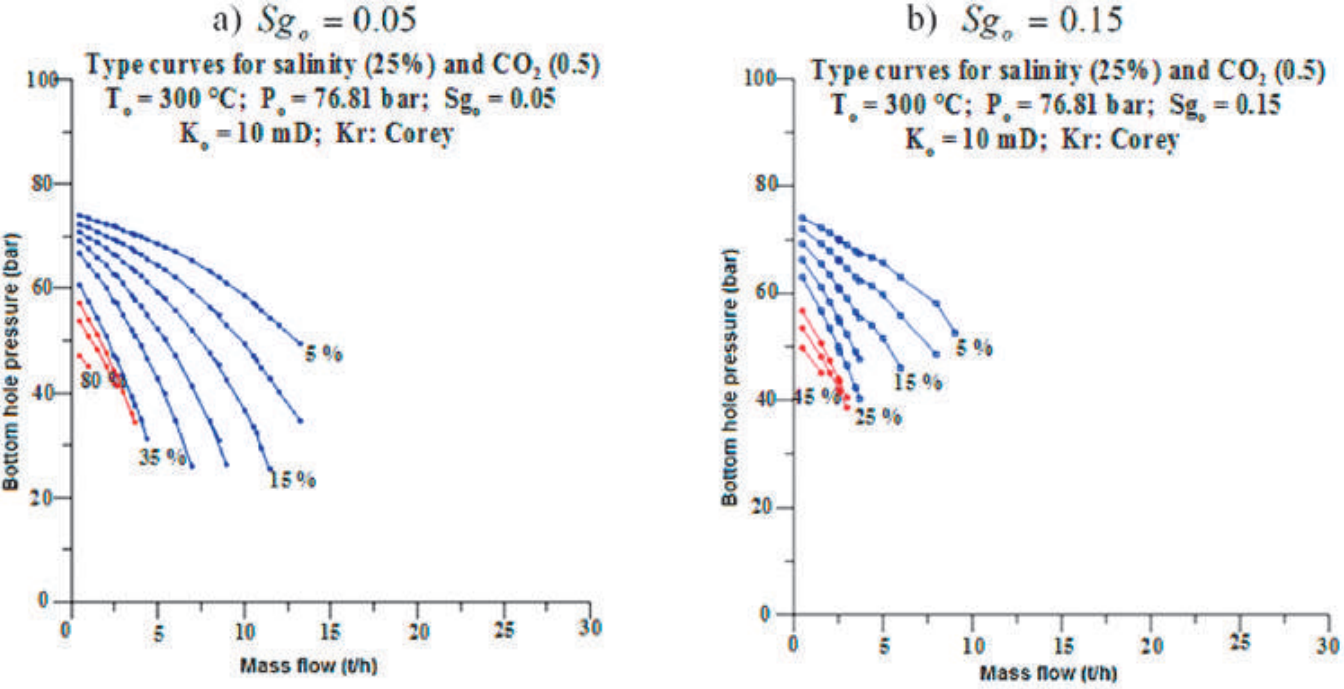
The obtained inflow type-curves of mass productivity are shown in Figures 2, 3, and 4 and cover all cases shown in Table 2. Overall, major pressure drops are observed as the cumulative mass produced percentage increases. The group of curves in black, denotes zones of conditions without salt precipitation and encompasses the lowest percentages of cumulative mass produced. As the exploitation of the well continues, the gas saturation and the salts concentration increase creating transition zones denoted in blue. In these transition zones the liquid and gaseous phases compete to flow, in agreement with the functionality of relative permeability of Corey type. Zones of salt precipitation are denoted in red and correspond to the highest percentages of cumulative mass produced with high gas saturation. The salt precipitation and transition zones make the geothermal fluid extraction difficult.

Figure 2. Type-curves of mass productivity as a function of the initial gas saturation and 5% salinity by weight.

Figure 3. Type-curves of mass productivity as a function of the initial gas saturation and 15% salinity by weight.
Discussion
For the case of the lowest concentration of dissolved salts (5% by weight; Figure 2), it can be observed that, as the initial gas saturation increases, the zones without salt precipitation decrease (curves in black) and disappear for an initial gas saturation of 45%. Inversely, the transition and salt precipitation zones increase, starting at earlier stages of the well exploitation (low percentages of cumulative mass produced). In this way, for the case of initial gas saturation of 45%, the transition zone covers from the start of the exploitation of the well until 65% of cumulative mass produced.
The reduction of the zones without salt precipitation becomes steeper as the initial salt concentration increases, disappearing completely for the 25% salinity case at the four initial gas saturation conditions studied (Figure 4). Conversely, as the initial salinity concentration increases, the transition and salinity precipitation zones appear at earlier stages, similar to the case when the initial gas saturation increases.
For all the cases the curves of the transition zones are cut when high pressure drops appear. The competition of the two phases to flow and the increment in salinity concentration makes the numerical solution challenging, congruently to the physics reality. Meza (2005) obtained a full type-curve in the transition zone for 75% of cumulative mass produced, with the salinity precipitation starting at high values of pressure drops The salinity concentration considered by Meza (2005) was of 10% by weight and all the cases in that study correspond to 0.5% initial gas saturation. For this salinity concentration, the maximum reduction in permeability found by Meza (2005) was of 24% relative to the initial value of 10 mD. At the beginning of the precipitation the gas saturation was 82%.
The curves of the salinity precipitation zones are also cut for high value pressure drops. The truncation occurs when the salinity deposes in the rock formation, for certain critical conditions, leading to a drastic reduction in its porosity and permeability, according to Eq. (4) of the Verma and Pruess (1988) model.
A summary of all the characteristics of the salinity precipitation zones for the three cases of salinity concentration as function of the initial gas saturation is shown in Table 3; including other cases which were not graphically shown. For each initial gas saturation, the intervals of cumulative mass produced in which the precipitation occurs are specified, along with the total reduction in permeability of the rock formation. Moreover, the corresponding gas saturation in the same precipitation interval is specified. For the cases of 5 and 15% of initial salinity concentration, no complete obstruction of the pores of the rock formation occurs. The maximum reductions in permeability found were of 12 and 39% respectively; without being significantly affected by the initial gas saturation. Congruently, Meza (2005) obtained complete curves at salinity precipitation zones with maximum reductions of 10 and 40% for the same initial salinity concentrations but with a 0.005 initial gas saturation.
Table 3. Permeability reduction for different conditions of salinities precipitation.
| Salinity concentration (% by weight) | ||||||
| 5% | 15% | 25% | ||||
| Sg0 | Precipitation range (cumulative mass produced) | Reduction of K (range of Sg) | Precipitation range (cumulative mass produced) | Reduction of K (range of Sg) | Precipitation range (cumulative mass produced) | Reduction of K (range of Sg) |
| 0.05 | 85 | 10.0 - 9.7 | 60-80 | 9.7 - 6.3 | 40-50 | 3.3 - 0 |
| (0.92 - 0.99) | (0.72 - 0.95) | (0.40- 0.67) | ||||
| 0.15 | 70-80 | 9.7 - 9.0 | 55-80 | 9.7 - 6.1 | 35-45 | 3.1 - 0 |
| (0.87 - 0.98) | (0.67 - 0.95) | (0.48 - 0.70) | ||||
| 0.30 | 75-85 | 9.8 - 9.0 | 50-80 | 9.7 - 6.2 | 25-35 | 4.4 - 0 |
| (0.88 - 0.98) | (0.70 - 0.95) | (0.50 - 0.69) | ||||
| 0.45 | 70-85 | 9.6 - 8.8 | 45-80 | 9.3 - 6.7 | 20-25 | 1.1 - 0 |
| (0.90 - 0.99) | (0.74 - 0.96) | (0.58 - 0.67) | ||||
Complete obstruction of the pores is observed for the case of 25% salinity by weight (Figure 4; Table 3). This obstruction leads to a reduction of 100% in the permeability of the rock formation, occurring at earlier stages as the initial gas saturation increases. A reduction in permeability of 100% implies that the saturation of solids (precipitated salts) reached a value of 0.2, according to the tubes in series model of Verma and Pruess (1988); considering ∅C = t = 0.8.
Conclusions
The inflow type-curves obtained in this study show the behavior of the mass productivity that may occur in a geothermal field as a function of their thermophysical parameters at different initial conditions of concentration of dissolved salts and gas saturation in the mixture.
Three well delimited zones were identified in the obtained type-curves: a) zones without salts precipitation; b) transition zones; and c) zones with salts precipitation.
It is concluded that with higher initial salts concentration and with increased gas saturation, the productivity of the well greatly decreases due to the difficulty to extract the fluid from the reservoir caused by the precipitation of salts. The precipitation of salts reduces the permeability of the rock formation and can reach critical conditions obstructing the flow in the reservoir.
The reduction in permeability is not significant for the case of lowest salt concentration (5%), independently of the initial gas saturation.
However, the effect becomes evident as the initial salts concentration increase, reaching complete obstruction of the pores for case of highest salts concentration (25%).
The use of these type-curves could become a complementary tool for the analysis of the productivity of the wells and for the selection of proper strategies for the correct exploitation of geothermal fields.

