


 text new page (beta)
 English (pdf)
 Article in xml format
 Article references
 Send this article by e-mail
 Cited by SciELO
  Similars in
SciELO
Similars in
SciELO 
 Permalink
Introduction
Groundwater pollution can be avoided by delineating and monitoring vulnerable areas. Determining the spatial extension of areas susceptible to pollution is difficult given the many variables affecting groundwater pollution (Dixon, 2005). In fact, groundwater vulnerability cannot be directly measured in situ. It is a complex function of large number of parameters related to the soil, the unsaturated zone and the aquifer (Aller et al., 1987; Civita, 1990).
Margat (1968) introduced the concept of groundwater vulnerability to pollution in the 1960s in France. It can be defined as the possibility of percolation and diffusion of pollutants from surface into the groundwater (Aller et al., 1987; Civita, 1990).
Several approaches were developed in the world for aquifer vulnerability assessment. They include statistical approaches, based on variable related to pollutant concentration or to pollution probability (Zwahlen, 2004), indices methods, based on weighting between various criteria affecting the vulnerability (Gogu & Dassargues, 2000) and models taking into account the physical, chemical and biological processes in the unsaturated zone (Schnebelen et al., 2002). The indexes methods such as DRASTIC (Aller et al., 1987), GOD (Foster 1987), AVI (Van Stempvoort et al., 1993), SINTACS (Civita, 1994), DRISTPI (Jiménez Madrid, 2013), EPIK (Doerfliger & Zwahlen, 1997), PI (Goldscheider et al., 2000) and COP were based on the European approach (COST, 2003). They are well-known worldwide of low cost and the most relevant with regard to field realities because of the consideration of the relative importance of every criterion involved in groundwater vulnerability (Ashokraj et al., 2015; Al-Abadi et al., 2014; Neshat et al., 2014; Kumar et al., 2013; Sener & Davraz, 2013; Saidi et al., 2010, Leyland & Witthüser, 2010). The characterization of groundwater vulnerability is regularly a qualitative process; specified intrinsic vulnerability assessment methods present a subjective component that may affect the results (Jiménez-Madrid, 2011). Dissimilarities between the different results of vulnerability methods are a result of the weight and rating attributed to each parameter (Hiscock et al., 1995).
Sustainable management of groundwater resources, the prediction of the pollution risk and the prevention against groundwater pollution are important issues, especially in semiarid and arid regions where precipitation are scarce and irregular (Ouessar et al., 2006; Khemmoudj et al., 2014). In these regions, groundwater resources are the main source for water supply and their prevention from degradation and pollution is vital. Various pollution types such as heavy metals, fertilizers, pesticides and other organic chemicals threaten groundwater (Babiker et al., 2005). The karstified and fissured carbonated aquifers are highly vulnerable to pollution due to human activities (Corniello & Ducci, 2000; Corniello et al., 2004; Ducci, 2010).
The aim of this paper is to evaluate ZeussKoutine aquifer vulnerability using SINTACS method based on GIS. The hydrogeological parameters were mapped and processed to delineate areas susceptible to pollution producing a vulnerability assessment map. The SINTACS model results are compared to measured nitrate concentration of two sampling campaigns carried out in February and June 2015 and representative of high and low water seasons, respectively.
Description of the study área
The Zeuss-Koutine aquifer is located in the coastal Jeffara plain in South-East of Tunisia. The aquifer covers an area of about 820 km2 (Figure 1). The geographical location of the study area lies in longitudes 10˚16´-10˚61´E and latitudes of 33˚39´-33˚75´N. The climate is arid Mediterranean with an average annual rainfall of 180 mm. The southeastern Tunisia is characterized by the presence of alternating marine and continental formations consequences of marine transgressions and regressions throughout the geological history of the northern Sahara (Gabtni et al., 2009). The stratigraphic sequence outcropping in the study area ranges from Triassic to Quaternary (figure 1). The groundwater circulates in the carbonate formations of the Jurassic, the Albo-Aptian, the Turonian and the lower Senonian. However, the Jurassic limestones is the main layer with a thickness reaching 120 m (Hamzaoui Azaza et al., 2011). The Zeuss-Koutine aquifer constitutes a multilayered hydrogeologic entity where the relays are available through faults or by vertical drainance (Gaubi, 1988). The hydraulic communication between different layers of the Zeuss-Koutine aquifer is realized through faults of which the Medenine fault is the most important. Currently, this aquifer is subjected to an intensive exploitation and exploited by several wells. The main recharge of Zeuss-Koutine is infiltration of runoff water flowing from Matmata Mountains and local infiltration from several wadis (streams) (Oum Zessar, Zeuss…). The Zeuss-Koutine aquifer provides a source of water for drinking and agriculture use. Since 1962, Zeuss Koutine aquifer has been contributing significantly to drinking water supply of Jerba Island and major cities of Tataouine and Medenine governorates. The pumping of the aquifer started since the 60s and has kept a gradual increase up to present. For example, exploitation flow rates have increased from 206 l/s in 1977 to 277 l/s in 1987, 298 l/s in 1995, 339 l/s in 2004, 589 l/s in 2010 to 623 l/s in 2014. The withdrawals reached 641 l/s in 2014 while the renewable resources are estimated to 352 l/s (DGRE, 2014). The exploitation increase produced a continuous piezometric decline of 0.5 to 1 m/ year on average and a possible groundwater pollution by the salty waters of Sebkha in the northeast of the Zeuss-Koutine basin (Gaubi, 1988). The transmissivity of the aquifer varies between 0.055 and 0.2 m2s-1 (OSS, 2005).
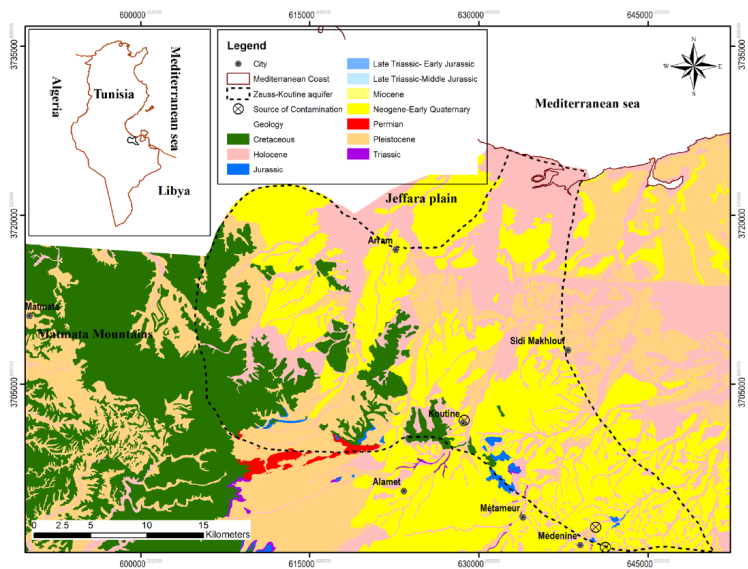
Figure 1 Geologic map of Zeuss-Koutine aquifer (based on Geologic maps: Medenine, Ajim, Mareth, Kirchaou, Matmata and Ghomrassen).
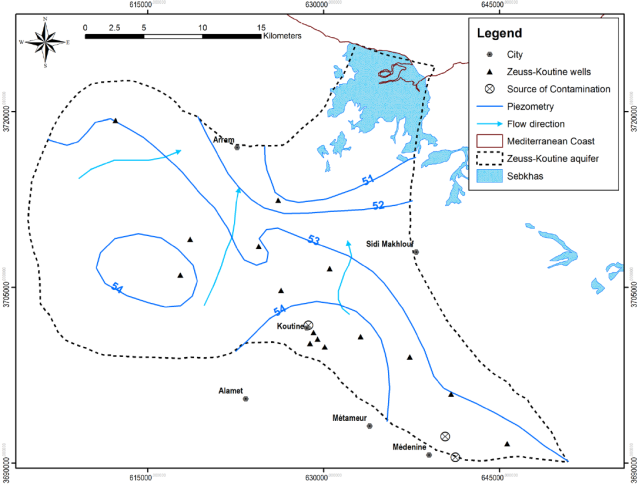
Groundwater flow in the study area is towards the Sebkha Oum Zessar and the Mediterranean Sea (Hamzaoui-Azaza, 2011) (Figure 2). Moreover, groundwater is threatened by pollution. The main source of pollution is the industrial zone of Koutine (milk, soft drinks and juice industries) in the south part of the ZeussKoutine aquifer and wastewater effluents in Medenine urban area in the southeastern part of the aquifer. The vulnerability assessment of the Zeuss-Koutine aquifer is a crucial issue in order to prevent groundwater from pollution. We focus on the SINTACS model (Civita, 1990; Civita et al., 1999) that has been widely used for any kind of aquifer and especially for karstic and fissured aquifers (Civita et al., 1999).
Materials and Methods
The vulnerability assessment approach
SINTACS method is an updated model of US DRASTIC method. It was developed in Italy in the early 1990s in order to adapt the mapping to a larger scale in view of the great diversity of the hydrogeology of Italy (Civita, 1990; Civita, & De Maio, 2004). SINTACS model shows vulnerability index of the study area using seven hydrological parameters, which are the Depth to water S (Soggiacenza in Italian), Impact of effective infiltration I (Infiltrazione in Italian), Hydrogeologic properties of the aquifer N (Not Azione del Satoru in Italian), Attenuation capacity of the soil/sediment cover T (Tipologia della Copertura in Italian), Attenuation capacity in the unsaturated zone A (Carratteri Idrogeologici dell Acquifero in Italian), Hydraulic conductivity range of the aquifer C (Conductivity Idraulica in Italian), and Hydrological role of the terrain slope S (Acclività della Topographica area in Italian). To avoid confusion with the depth to water table, we will change the terrain slope designation to SA. Unlike DRASTIC, SINTACS method allows to use, at the same time and in different cells, weighting factors variable according to certain situations. It is more flexible in terms of the indexation and weighting system. The steps followed in the Zeuss-Koutine aquifer vulnerability assessment were data gathering, processing and mapping data using ArcGis, and operating results for the identification of vulnerable areas.
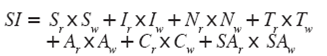
SINTACS vulnerability index (SI) is computed using the equation (1) (Civita & De Maio, 1997):
 1
1
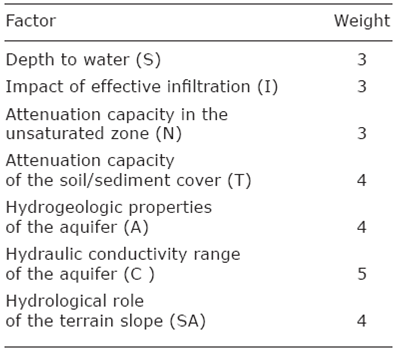
Where the weighted parameters are: Sw, Iw, Nw, Tw, Aw, Cw and SAw (Table 1). Sr, Ir, Nr, Tr, Ar, Cr and SAr are ratings for each of the parameters. The weight of each parameter depends on the impact of potential pollution (Table 1). The SINTACS parameters ratings vary from 1 to 10, where higher values are directly proportional to the degree of vulnerability.
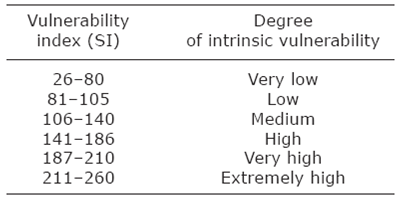
The intrinsic vulnerability values indicate the potential pollution in the aquifer. A higher vulnerability index indicates a higher probability of pollution (Civita & De Maio, 1997). The output values vary from 26 to 226. The vulnerability classes are defined using Table 2 (Corniello et al., 2004):
To establish thematic layers of the seven parameters, several types of data were used. Table 3 shows data types, sources and usages.
Table 3 Sources of data used for creation of hydrogeological parameter for SINTACS method
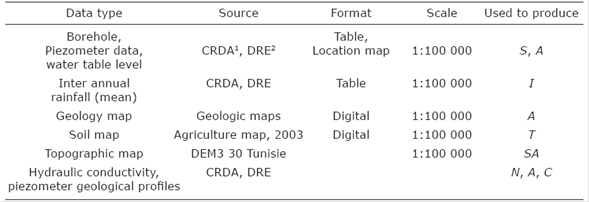
1CRDA: Commissariat Régional au Développement Agricole
2DRE: Direction de ressources en eau (Tunisie)
3DEM: Digital elevation model
The depth to water (S) is the vertical distance from the ground surface to the water table. Generally, potential aquifer protection increases with the higher depth of the water. The water table depths were measured from observation wells. The Inverse Distance Weight (IDW) interpolation method implemented in the ArcGIS Geostatistical Analyst extension was applied to interpolate the points and to develop the raster map with a pixel size of 100 m. The IDW technique provided better fitting data for use in this study since it produced only the value ranges found within the data attributes.
The main source of groundwater recharge is rainfall infiltration. Net recharge (I) is the quantity of water per unit of land that reaches the aquifer (Aller et al., 1987). Rainfall data were collected from CRDA-DRE Medenine rain gauges and interpolated using IDW method; to produce the isohyet map. Since, the Zeuss-Koutine aquifer is unconfined; rating of net recharge is derived from the amount of precipitation.
An aquifer is a geological formation containing water, which can be exploited through wells or sources for domestic, industrial and agricultural usage. Circulation and spread of any pollutant into the saturated zone depends on the texture and lithology of the aquifer layers. This is always controlled by the particle size, porosity, permeability and lithology of geological formations. The parameter A was obtained by IDW interpolation of horizontal equivalent permeability of the saturated zone. Horizontal equivalent permeability was calculated using the equation (2):
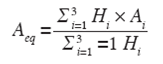 2
2
Where: Aeq is horizontal equivalent permeability (m/s), Hi is thickness of the layer i (m), Ai is permeability of the layer i (m/s), i (i=1 to 3) is an index related to the lithological classes forming the Zeuss-koutine aquifer.
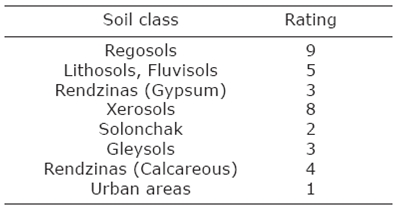
The soil parameter (T) represents the influence of soil material on the infiltration. The soil layer types indicate the recharge rate infiltrated into the aquifer. In general, the less clay and the smaller the grain size of the soil, the less permeable the soil will be and the less pollutant will reach the aquifer (Aller et al., 1987). Taamallah (2003) provided the soil map of the study area. Table 4 shows the classification of soil types and their rating.
Topography (SA) refers to the slope of the land surface. The topography indicates whether a pollutant will move or will stay on the ground surface to penetrate into the aquifer (Lynchez et al., 1994). The slope (%) of the study area was obtained from the Digital Elevation Model (DEM).
The vadose zone (N) is defined as the fraction between groundwater and the surface of soil where the pores are partially saturated with water. The permeability of the vadose zone controls the movement of pollutants and their arrival to the aquifer. Most of the physicochemical processes taking place in this zone are influenced by its thickness. The infiltration and dispersion of pollutants are guided by the lithological characteristics of the layers that control their paths and trajectory in the subsurface.
Hydraulic conductivity (C) refers to the ability of the aquifer to transmit water. It controls the migration and dispersion of pollutants. Hydraulic conductivity was obtained by identifying the permeability coefficient for each lithological class (Castany, 1982) and assigning a rating to each interval (Aller et al., 1987). The conductivity and the aquifer vulnerability are proportional. This factor was obtained by IDW interpolation of point data.
The final SINTACS map was created by calculating a weighted sum of the individual aquifer attribute raster’s within Conceptual model ArcGis.
The nitrate sampling campaigns
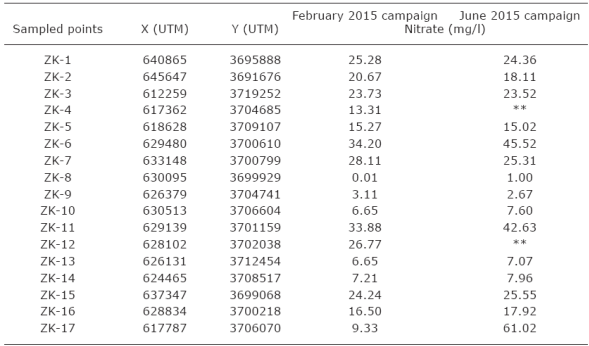
Groundwater was sampled from 17 wells of Zeuss-Koutine aquifer for nitrate analysis during February (Humid period) and June (Dry period) 2015. The samples were well spatially distributed. A volume of 5 ml of each sample was filtered at 0.2 µm and was conserved in 10 ml plastic tubes. All samples were stored in ice chests at 4°C and transported to the laboratory where they were analyzed within two weeks. The analyses were performed in the Laboratory of the Department of Crystallography, Mineralogy and Mineral Deposits of the University of Barcelona, Spain. Nitrates concentrations were determined using High Performance Liquid Chromatography (HPLC).
Results and discussion
SINTACS parameters
Figure 3 shows the different thematic maps of SINTACS model realized using ArcGis. The ratings corresponding to each class for the parameters are presented in Table 5.
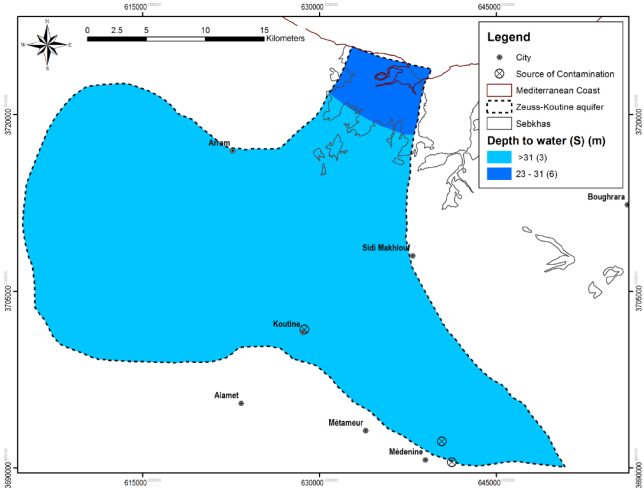
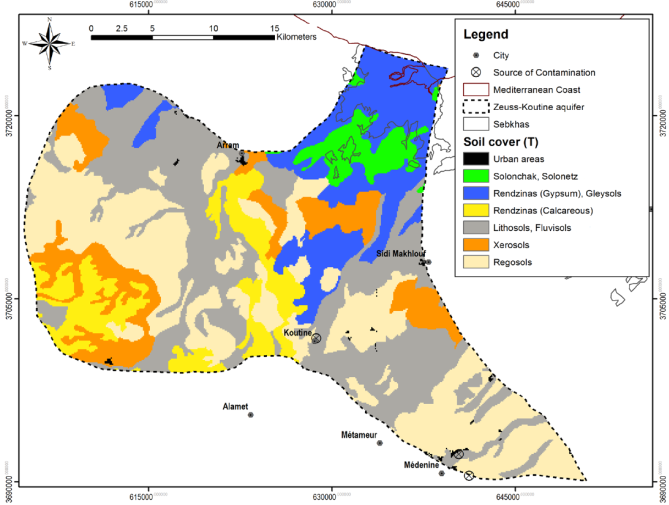
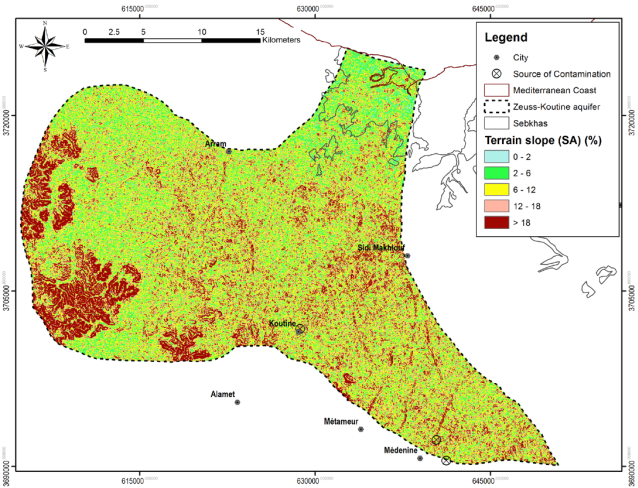
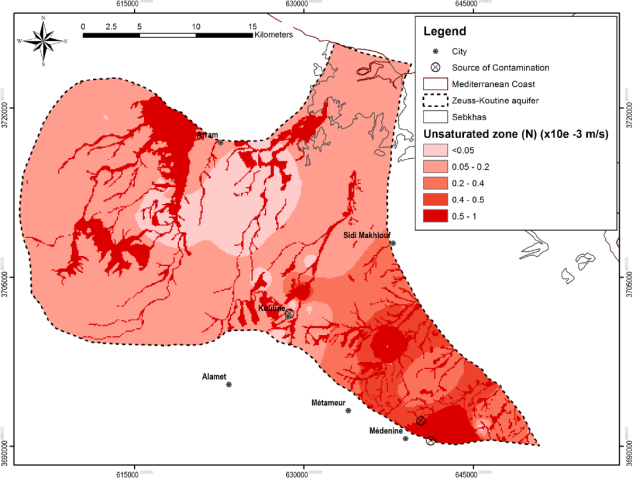
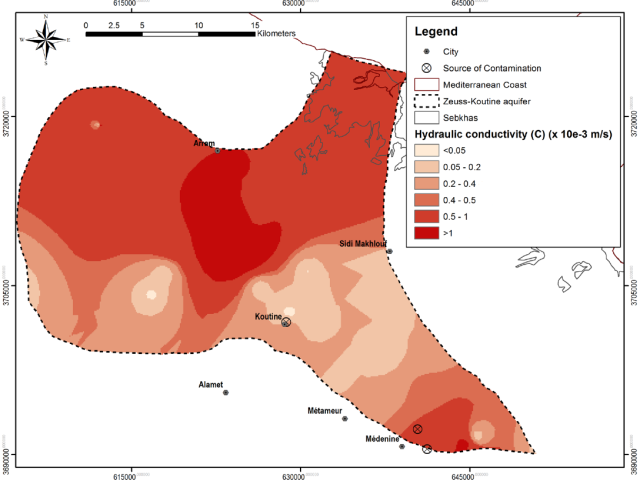
Figure 3 The calculated layers of SINTACS model showing the calculated weight of the different parameters. (a) Depth to water (S), (b) Impact of effective infiltration (I), (c) Hydrogeologic properties of the aquifer (A), (d) Attenuation capacity of the soil/sediment cover (T), (e) Hydrological role of the terrain slope (SA), (f) Attenuation capacity in the unsaturated zone (N), (g) Hydraulic conductivity range of the aquifer (C).
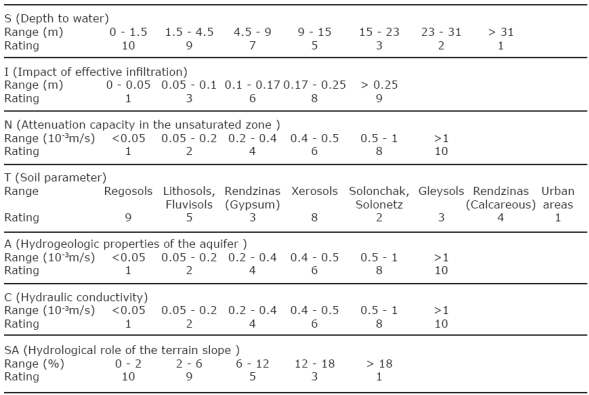
Figure 3a shows that the Zeuss-Koutine aquifer is divided into two water depth intervals (from 23 to 31 m and >31 m). The lowest water table values have the highest index (Sr×Sw=6) and located near the discharge area of Sebkhat Oum Zessar.
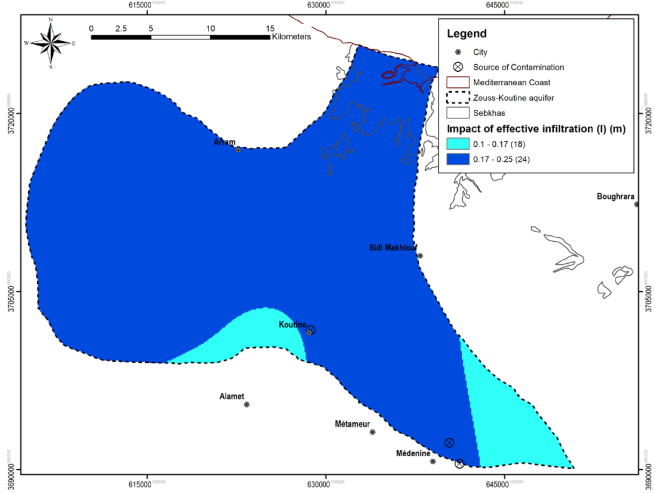
Impact of effective infiltration (I) map (Figure 3b) indicates that the amount of rainfall received by the aquifer is divided into two intervals from 0.1 to 0.17 m/year and from 0.17 to 0.25 m/year, respectively. The major area of the aquifer belongs to the second interval with an index (Ir×Iw=32).
The parameter A map (Figure 3c), corresponding to hydrogeological properties of the aquifer, shows the distribution of the horizontal equivalent permeability of the saturated zone. The highest permeability is represented by dark red and reaches 8.7 × 10⁻⁴ m/s with Ar×Aw= 32. In fact, the aquifer layers consisting of limestone that has been affected by dissolution producing ridges, fissures, karsts and sinkholes show high permeability values. The lower permeability is about 10-5 m/s, this permeability decrease is explained by the existence of marl and clay layers (Gaubi 1988; Yahyaoui 1998).
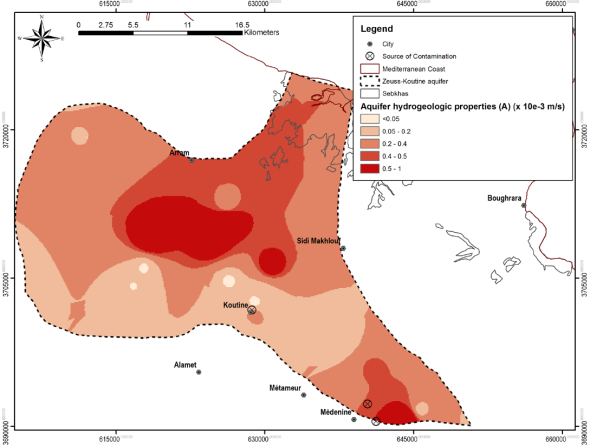
Figure 3d shows the soil type distribution. Each soil type has a rating. Regosols have the highest index (Tr×Tw = 36) while the urban areas have the lowest index (Tr×Tw = 4).
Topography of the aquifer (SA) map (Figure 3e) shows that the majority of the ZeussKoutine aquifer area has a slope between 0 and 18 %.
The vadose zone (N) map indicates that the wadi beds have the highest permeability value, about 10-3 m/s. In fact, wadi beds are formed by gravels, pebbles and sands resulting in high permeability (Figure 3f).
The hydraulic conductivity (C) map shows that the highest values are located in Matmata mountains and in the southeastern part of the aquifer (Figure 3g). This is explained by the existence of fissured and karstified limestones. The hydraulic conductivity of the aquifer reachs 4.45× 10⁻³ m/s.
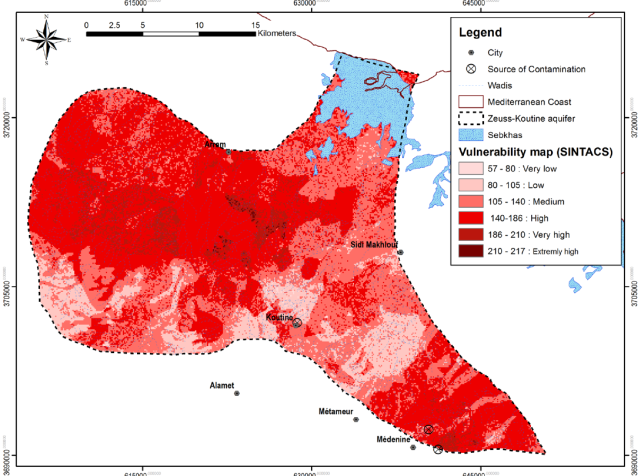
SINTACS vulnerability map
Figure 4 shows the spatial distribution of vulnerability classes of the Zeuss-Koutine aquifer. SINTACS map shows that 0.1 % of the total area of the study area has an extremely high vulnerability index, 8.4 % a very high vulnerability, 46.1 % a high vulnerability, 34.8 % a moderate vulnerability, 10.5 % a low vulnerability and 0.1 % a very low vulnerability. The highest vulnerability is located mainly in wadis beds, the southeastern part of the aquifer and the area of Matmata Mountains. In the wadis and Matamta Mountains, the high values are explained by the low depth of the water table and the high permeability of lithological formations consisted in current alluvial wadis deposits (gravels, pebbles…) corresponding to Mio-Plio-Quaternary filling. It is important to note that the recharge area of the Zeuss-Koutine aquifer comprising wadi beds and Matmata Mountains has the highest index of vulnerability (46 % of the total area). In addition, the southeastern part of the aquifer has a high vulnerability index (8.6 % of the total area). This is can be explained by the low depth of water table and the high permeability of the saturated and vadose zone in wadi beds that let water to infiltrate easily. In addition, the low slope allows runoff to stagnate and to infiltrate immediately.
Vulnerability map validation
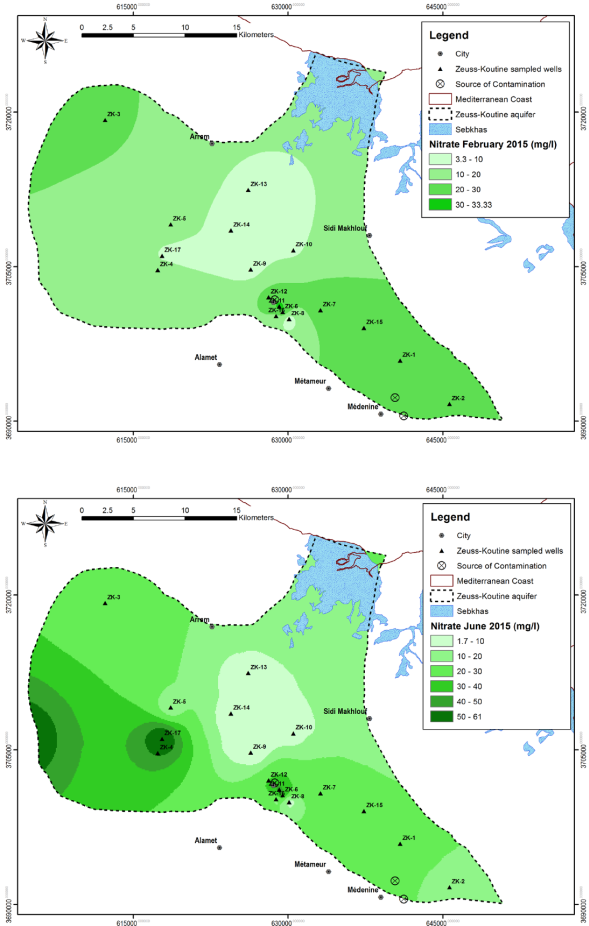
Nitrate concentration ranges from 0.01 to 34.2 mg/l for the high water season campaign (February, 2015) while it varies between 1 and 61.02 mg/l for the low water season campaign (June, 2015) (Table 6). Results of the two campaigns show an increase of nitrate concentrations from the high water season to the low water season. Nitrate spatial distribution map for the Zeuss-Koutine aquifer (Figures 5a and 5b) indicates that the highest values are located in the southeast of the aquifer near Medenine urban area, in the close vicinity of the Koutine region where industrial factories are implemented and in the extreme West of the aquifer. The nitrate distribution map confirms the vulnerability map results. In fact, urban area and Matmata Mountains region have the highest nitrate values (>20 mg/l).
Summary and conclusión
This study aims to assess groundwater vulnerability in an arid region using the empirical indexes SINTACS models. Seven environmental parameters, prepared in a GIS environment, were used to represent the natural hydrogeological setting of ZeussKoutine aquifer. The vulnerability map indicated that wadi beds, urban area and the region of Matmata are more susceptible to pollution where nitrate concentrations are higher than 20 mg/l.
Nowadays, sources of contamination are limited to the southeastern part. They may multiply and spread with the population growth and the economic development of the region, threatening the Zeuss-Koutine waters. In order to relieve the Zeuss-Koutine waters pollution, recommendations may be taken into account. Various sources of waste that can affect groundwater such as solid waste discharges, wastewater treatment plant, industrial areas, etc. should be reduced. A channel discharging plastic pipes with sizes and diameters suitable for the delivery of wastewater treatment plant and industry wastewaters to the sea should be planned.
In order to better exploit the vulnerability map, more detailed information on local conditions and additional hydrologic studies about the studied area are necessary for planners and decision makers to understand the mechanisms of pollution and recharge of the aquifer. Furthermore, in the indexes methods, the concept of groundwater vulnerability deals only with hydrogeological setting and does not include pollutant concentration. This work will be completed by the development of transport model that would enable us to follow the pollutant propagation. This model could be used to investigate some remediation solution like pumping the polluted water by wells located close the pollution source.

