


 text new page (beta)
 English (pdf)
 Article in xml format
 Article references
 Send this article by e-mail
 Cited by SciELO
  Similars in
SciELO
Similars in
SciELO 
 Permalink
Introduction
In mid-XXth century, Mexican glaciers were located on top of the three highest mountains of the country: Citlaltépetl or Pico de Orizaba at 5,675 m (meters above sea level; 9 glaciers); Iztaccíhuatl at 5,230 m (12 glaciers) and Popocatépetl at 5,465 m (3 glaciers) (Lorenzo, 1964). The climatic conditions in central Mexico through the year above 4500 m allowed the existence of these glaciers. However, in 2001 the glacial system on Popocatépetl volcano was considered extinct as a result of the eruptive activity that began on 1994 (Julio Miranda and Delgado Granados, 2003; Delgado Granados et al. , 2007). The glaciers on Iztaccíhuatl and Citlaltépetl volcanoes have also been retreating and some of them already disappeared (Schneider et al. , 2008).
Lorenzo (1964) made the first report on all Mexican glacial systems for the International Geophysical Year (IGY). He mapped and made a detailed description of the geometry of the limits and area of those glaciers. The existing circumstances in 1958 (execution year of these studies) represented a real challenge to obtaining the glacial geometry and dimensions of the 24 glaciers in Mexico. This pioneering work is considered a landmark in Mexican glaciology, due to the report of: geographic position, elevation, name, approximate area, photographic catalogue, and glaciological and meteorological data. This glaciological inventory was accomplished in a short time and the best possible way taking into account the limited experience for carrying out such studies, the limited availability of equipment and the shortage of funds (Lorenzo, 1964). Also, it is important to notice that meteorological conditions on 1958 delayed and difficult the fieldwork.
The glaciated areas reported by Lorenzo (1964) for Citlaltépetl, Popocatépetl and Iztaccíhuatl volcanoes made in 1958, were the bases for estimating glacier shrinkage.
In this study, the methodology employed by Lorenzo (1964) is reviewed. This revision was mandatory after finding inconsistences in the measured dimensions of Citlaltépetl volcano's glaciers. The dimensions of glaciers obtained by Lorenzo (1964) during contemporaneous glaciological work at Iztaccíhuatl and Popocatépetl volcanoes suggested that the map of Citlaltépetl volcano's glaciers was not accurate. From this revision it was possible to correct his maps and reconstruct the glaciated area on Citlaltépetl. This reconstruction was based on a 1975 aerial photo of Citlaltépetl (INEGI, 1975), orthorectified for this work; a 1:20,000 DEM from SIGSA (2006), and the photographic catalogue published by Lorenzo (1964).
The 1958 glaciological campaign
The inventory of Citlaltépetl's glaciers
Citlaltépetl is located in the eastern part of the Trans-Mexican volcanic belt, 100 km from the coast of the Gulf of Mexico, 200 km from Mexico City (Figure 1).

Figure 1 Location of Citlaltépetl volcano (PO) and Mexico City (MC). The orthophoto was obtained from an aerial-photograph of INEGI (1975).
From Lorenzo's work in 1958, glaciers on Citlaltépetl volcano were recognized as the largest glacial system in Mexico. Lorenzo (1964) described Glaciar Norte at the top of the volcano comprising 7 glacier tongues facing north, northwest and west. On the eastern flank described another glacial system called Glaciar Oriental, an independent system, which is still present today.
The methodology followed in 1958 was based on the use of cartographic material, aerial photographs, topographic maps, altimetry data, thermometers, and a Brunton compass (Lorenzo, 1964). The cartography consisted in a map at a scale of 1:50,000 made by Estudios y Proyectos, A.C. and for this site, aerial photographs were acquired by the Papaloapan Comission in 1955. The altimetry was determined with Thommen pocket altimeters with a range up to 6000 m and divisions every 10 m. These altimeters were used together with tables of corrections as established by the Mexican Meteorological Service (Lorenzo, 1964). Temperature corrections for altitude were made with a thermometer graduated to the nearest degree centigrade. All readings were taken at the same points during the campaign, in order to ensure the correctness within the limits of the instruments (Lorenzo, 1964).
Regarding the aerial photographs, Lorenzo (1964, page 92) stated: "the photographs were not of first importance, due to their age, but they were used as a guide rather than as direct evidence ." It is assumed that photogrammetry was not the main tool used by Lorenzo (1964) to map the glacier. After identification of glaciated areas on the aerial photographs, the altitude of the glaciers and compass directions of their boundaries were measured in the field. The ice limits were annotated and sketched by Lorenzo (1964, page 92) mentioning: "It is our belief that in spite of the scarcity of technical aid, the errors will not be found too great."
The main body of Glaciar Norte (beginning at 5,650 m and ending 4,640 m) resulted with an area of ca. 9 km2, divided into different glacial tongues (Figure 2). Lorenzo (1964) used the term glacier to distinguish every tongue of Glaciar Norte, a fact that sometimes derived in confusion. The identified glaciers and the altitude of their lowest limits are enlisted following the published nomenclature:
Chichimeco glacier, 4,740 m.
Jamapa glacier, 4,640 m.
Toro glacier, 4,930 m.
Barba glacier, 5,090 m.
Noroccidental glacier, 4,920 m.
Occidental glacier, 4,980 m.
Suroccidental glacier, 4,980 m
Oriental glacier, 5,070 m (separated from Glaciar Norte with ca. 420,000 m2.

Figure 2 Topographic map of Citlaltépetl volcano's glaciers in 1958 (taken from Lorenzo, 1964). Roman letters indicate the glacial tongues of Glaciar Norte and a separate glacier: I) Chichimeco; II) Jamapa; III) Toro; IV) Barba; V) Noroccidental; VI) Occidental; VII) Suroccidental; and Glaciar Oriental (VIII) on the eastern flank of the volcano.
From these data, the glacial area of Citlaltépetl was considered the largest in the tropical zone of the northern hemisphere.
Glacial inventories of Popocatépetl and Iztaccíhuatl volcanoes
In order to test the reported cartographic work at Citlaltépetl volcano for inconsistencies, it is relevant to review the work made on these two volcanoes too.
These mountains are located ∼50 km (Popocatépetl) and ∼35 km (Iztaccíhuatl) southeast and east of Mexico City. White (1954); White (1954; 1956) conducted the first studies about the glaciers on those volcanoes. His studies, together with aerial photographs, were the main source of information for Lorenzo to develop the glacial inventory of these mountains, since the fieldwork was delayed due to bad weather at that time. Lorenzo (1964) accepted that the data must therefore had a "certain margin of error".
Cartographic material employed by Lorenzo (1964) included: aerial photographs obtained in 1945 by the Compañía Mexicana de Aerofoto, S.A., and two topographic maps (1:20,000) made by the Compañía Hidroeléctrica de los Volcanes. The altimetry, compass directions and temperature measurements were the same as described above.
At Popocatépetl, Lorenzo (1964) described Ventorrillo, Noroccidental and Norte glaciers on the north fl nk of the volcano. In spite of difficulties, the altitude measurements of the glacier boundaries were accurate enough for that work (± 20 m). Ventorrillo glacier resulted with an extension of ca. 435,000 m2 and its lowest front at 4,690 m. The Noroccidental glacier was west of Ventorrillo glacier, separated from it at 5,300 m, with an area of ∼95,000 m2 and front at 5,015 m. Norte glacier was east of Ventorrillo with an area of ∼190,000 m2 and a front at 4,840 m. The total glaciated area at Popocatépetl volcano in 1954 was of ∼720,000 m2.
The glaciers on Iztaccíhuatl and their areas were described follows (Lorenzo, 1964): Cuello (ca. 20,000 m2); Ayolotepito (ca. 300,000 m2); Nororiental (ca. 110,000 m2); Pecho (ca. 75,000 m2); Centro-oriente (ca. 140,000 m2); Ayoloco (ca. 285,000 m2); Suroriental (ca. 80,000 m2); Atzintli (ca. 120,000 m2) and San Agustín (ca. 30,000 m2). All of these glaciers covered an area of ca. 1.2 km2. The lowest glacial front determined for those glaciers was measured at Ayoloco glacier at an altitude of 4,668 m in 1958.
It is noteworthy to mention that the mean glacial area for these two volcanoes was ∼1 km2 for 1954 with a mean minimal altitude of 4,680 m.
Inconsistencies of reported glaciated areas of Citlaltépetl Volcano
A series of inconsistencies are found when comparing the shrinkage at the three glacial systems. Taking into account the studies made by Delgado Granados et al . (2007) and Schneider et al . (2008), the glaciated areas on Popocatépetl and Iztaccíhuatl in 1982 were 0.559 km2 and 0.863 km2, respectively (see Table 1). These values represent a glacial shrinkage of 22% on Popocatépetl and 28% on Iztaccíhuatl as compared with the areas reported by Lorenzo (1964). This represents a similar glacial shrinkage on both glacier systems between 1958 and 1982 (24 years). In contrast, between 1958 and 2001 the glaciers on Citlaltépetl retreated about 90% in 43 years (Cortés-Ramos and Delgado Granados, 2013); this is also considering the area reported by Lorenzo (1964). This value led to think about the differences between the glacial shrinkage on Popocatépetl and Iztaccíhuatl in comparison with Citlaltépetl. Are the glaciers on Citlaltépetl unique? Or, is the glaciated area reported by Lorenzo (1964) wrong? The first question lead to assume that climate on Citlaltépetl is completely different than climate dominating on Popocatépetl and Iztaccíhuatl, or that the weather conditions in the vicinity of Citlaltépetl have changed more strongly in the same period of time from the conditions at the Popocatépetl- Iztaccíhuatl system.
Table 1 Extension changes of Mexican glaciers since the end of the LIA. *Glacial area reported by Lorenzo (1964). **Glacial area reported in this study. aData corrected after Cortés-Ramos and Delgado-Granados (2013).

In order to answer those questions, a careful review of the maps published by Lorenzo (1964) was needed. Cartographic inconsistencies directly affect the size of the reported glaciated areas for Citlaltépetl and interpretation thereof. Sketch III of Lorenzo (1964) shows two different scales for the same map. One is an indicated scale of 1:50,000 and a graphic scale of 1:62,500 (see Figure 2). Hence, there must be differences between the distances between two points measured on that sketch and on a topographic map at the same scale (for instance INEGI, 2002). Examples of these inconsistencies are:
The distance from the mountain hut "Piedra Grande" to the center of the crater on the Sketch III of Lorenzo (1964; Figure 2) is 132 mm (on the map) or 8,250 m (according to the graphic scale) or 6,600 m (according to the indicated scale). The same distance on the INEGI (2002) topographic map is 62 mm (on the map) or 3,100 m (according to the indicated scale).
Distance from Sarcófago Peak to the center of the crater on the sketch III of Lorenzo (1964) is 59 mm (on the map) or 3,687.5 m (according to the graphic scale) or 2,950 m (according to the indicated scale). The same distance on the INEGI (2002) topographic map is 25 mm (on the map) or 1,250 m (according to the indicated scale).
The measurements extracted from sketch III of Lorenzo (1964; Figure 2) are slightly more than two-fold the distances measured on the INEGI (2002) topographic map. Similar problems are present on Sketch IV of Lorenzo (1964). The length of Jamapa glacier is reported to be ca . 5,600 m long, an impossible distance considering that the distance from the summit to the mountain hut is only 3100 m. If this distance was true, the glacier's front altitude should be lower than the hut's altitude. However, the data measured and reported for the glacial front (Lorenzo, 1964) is consistent with the INEGI (2002) topographic map and not with the Sketch III. Other cartographic elements provide further evidence supporting the inconsistencies listed above. From the topography shown in a Digital Elevation Model's (DEM) hillshade (SIGSA, 2006) and the aerial photo of 1975 (INEGI, 1975), it is evident that the shape of Glaciar Norte in 1958 was different from that reported by Lorenzo (1964).
The next sections focus on the correction of the Citlaltépetl's glaciated area. Also, a corrected contouring of the glacier is proposed based on the description of Lorenzo (1964) and all the available material. Namely, it was necessary to adjust the glacier geometry (as much as possible) to the topography depicted in a current Digital Elevation Model (DEM) and the 1975 aerial photo from INEGI (1975).
Recalculation of the areal extent of Citlaltépetl volcano's glaciers
A methodology was established in order to recalculate the glacial extent of Glaciar Norte in 1958. This methodology needed to re- shape the glaciers' boundaries based on digital cartography, photogrammetry and terrain's visual observations. It first transports the outline of Glaciar Norte as reported by Lorenzo onto the level lines of the INEGI (2002) topographic map, re-scaling the dimensions of this outline. Thereafter, a new outline is established based on the glacier's outline in 1975 (mapped in this work) and the photographs reported by Lorenzo (1964). These two simple steps are further detailed below.
Cartographic data
For geographic correction and re-scaling of Glaciar Norte mapped by Lorenzo in 1958, Sketch III (Lorenzo, 1964) and INEGI's (2002) topographic map (Coscomatepec sheet) were scanned and digitized at a resolution of 500 dpi pixel using a flat scanner Epson 836-XL. Additionally, a 10 meters resolution DEM (SIGSA, 2006) was used to rectify the scale and dephasing of Lorenzo's map (1964).
A set of aerial photographs from Lorenzo's work was used to display and identify the limits and morphology of the glacial cover in 1958. These photographs were also compared with a 1975 orthophoto of Citlaltépetl area (INEGI, 1975)
Every photograph was scanned with a flatbed scanner at a sampling resolution of 600 dpi. Then, the digitalized photograph was orthorectified using the Orthoengine module of PCI Geomatica(r) 10.0. This is a photogrammetry module useful to correct lens distortion, refraction, camera tilt, and terrain relief affecting the geometry of the scene (Welch and Jordan, 1996). The software uses the focal length of the camera and the fiducial marks (printed on the photos) to calculate the lens distortion, refraction and camera tilt.
In order to correct the geometry, and project the aerial photograph into a cartographic space, it was necessary to locate a series of Ground Control Points (GCP) which were obtained from published ground surveys like maps, georeferenced satellite images and GPS points measured in the field. For this work we got a set of GCPs through a comparison image to image between the aerial photo and a georeferenced panchromatic Landsat image for the December 9, 1999. This Landsat image was obtained on-line from the USGS catalogue via the USGS Global Visualization Viewer in 2006 (http://glovis.usgs.gov/ last access: June 2013), and helped to find geographic features with a known location, recognizable on both images.
The outline of 1975 was mapped from an aerial photograph of INEGI (1975) taken in August 1975. The terrain relief effect was corrected using a set of GCPs and a 1:20,000 DEM. Using both, the software corrects the geometry of the scene and assigns a geographic projection. Then we obtained an orthophoto of Citlaltépetl volcano for 1975 where we visual and manually mapped the glacier extend for that year (Figures 5e and 7 ), clearly recognized on the photo.
Georeferencing correction
Digitized maps were georeferenced using the marks and projections established at every map. INEGI (2002) map was re-projected using UTM coordinates with the datum WGS-84 zone 14Q. This datum replaces the original datum ITRF-92. The map developed by Lorenzo (1964) was georeferenced using also UTM coordinates and the datum WGS-84. Both digital images were processed through the georeferencing modules of ENVI 4.3. Once georeferenced, the maps were corrected using a Geographic Information Systems (GIS), dephasing and re-sizing the map by Lorenzo (1964). The GIS interface used was ArcGIS 10.0.
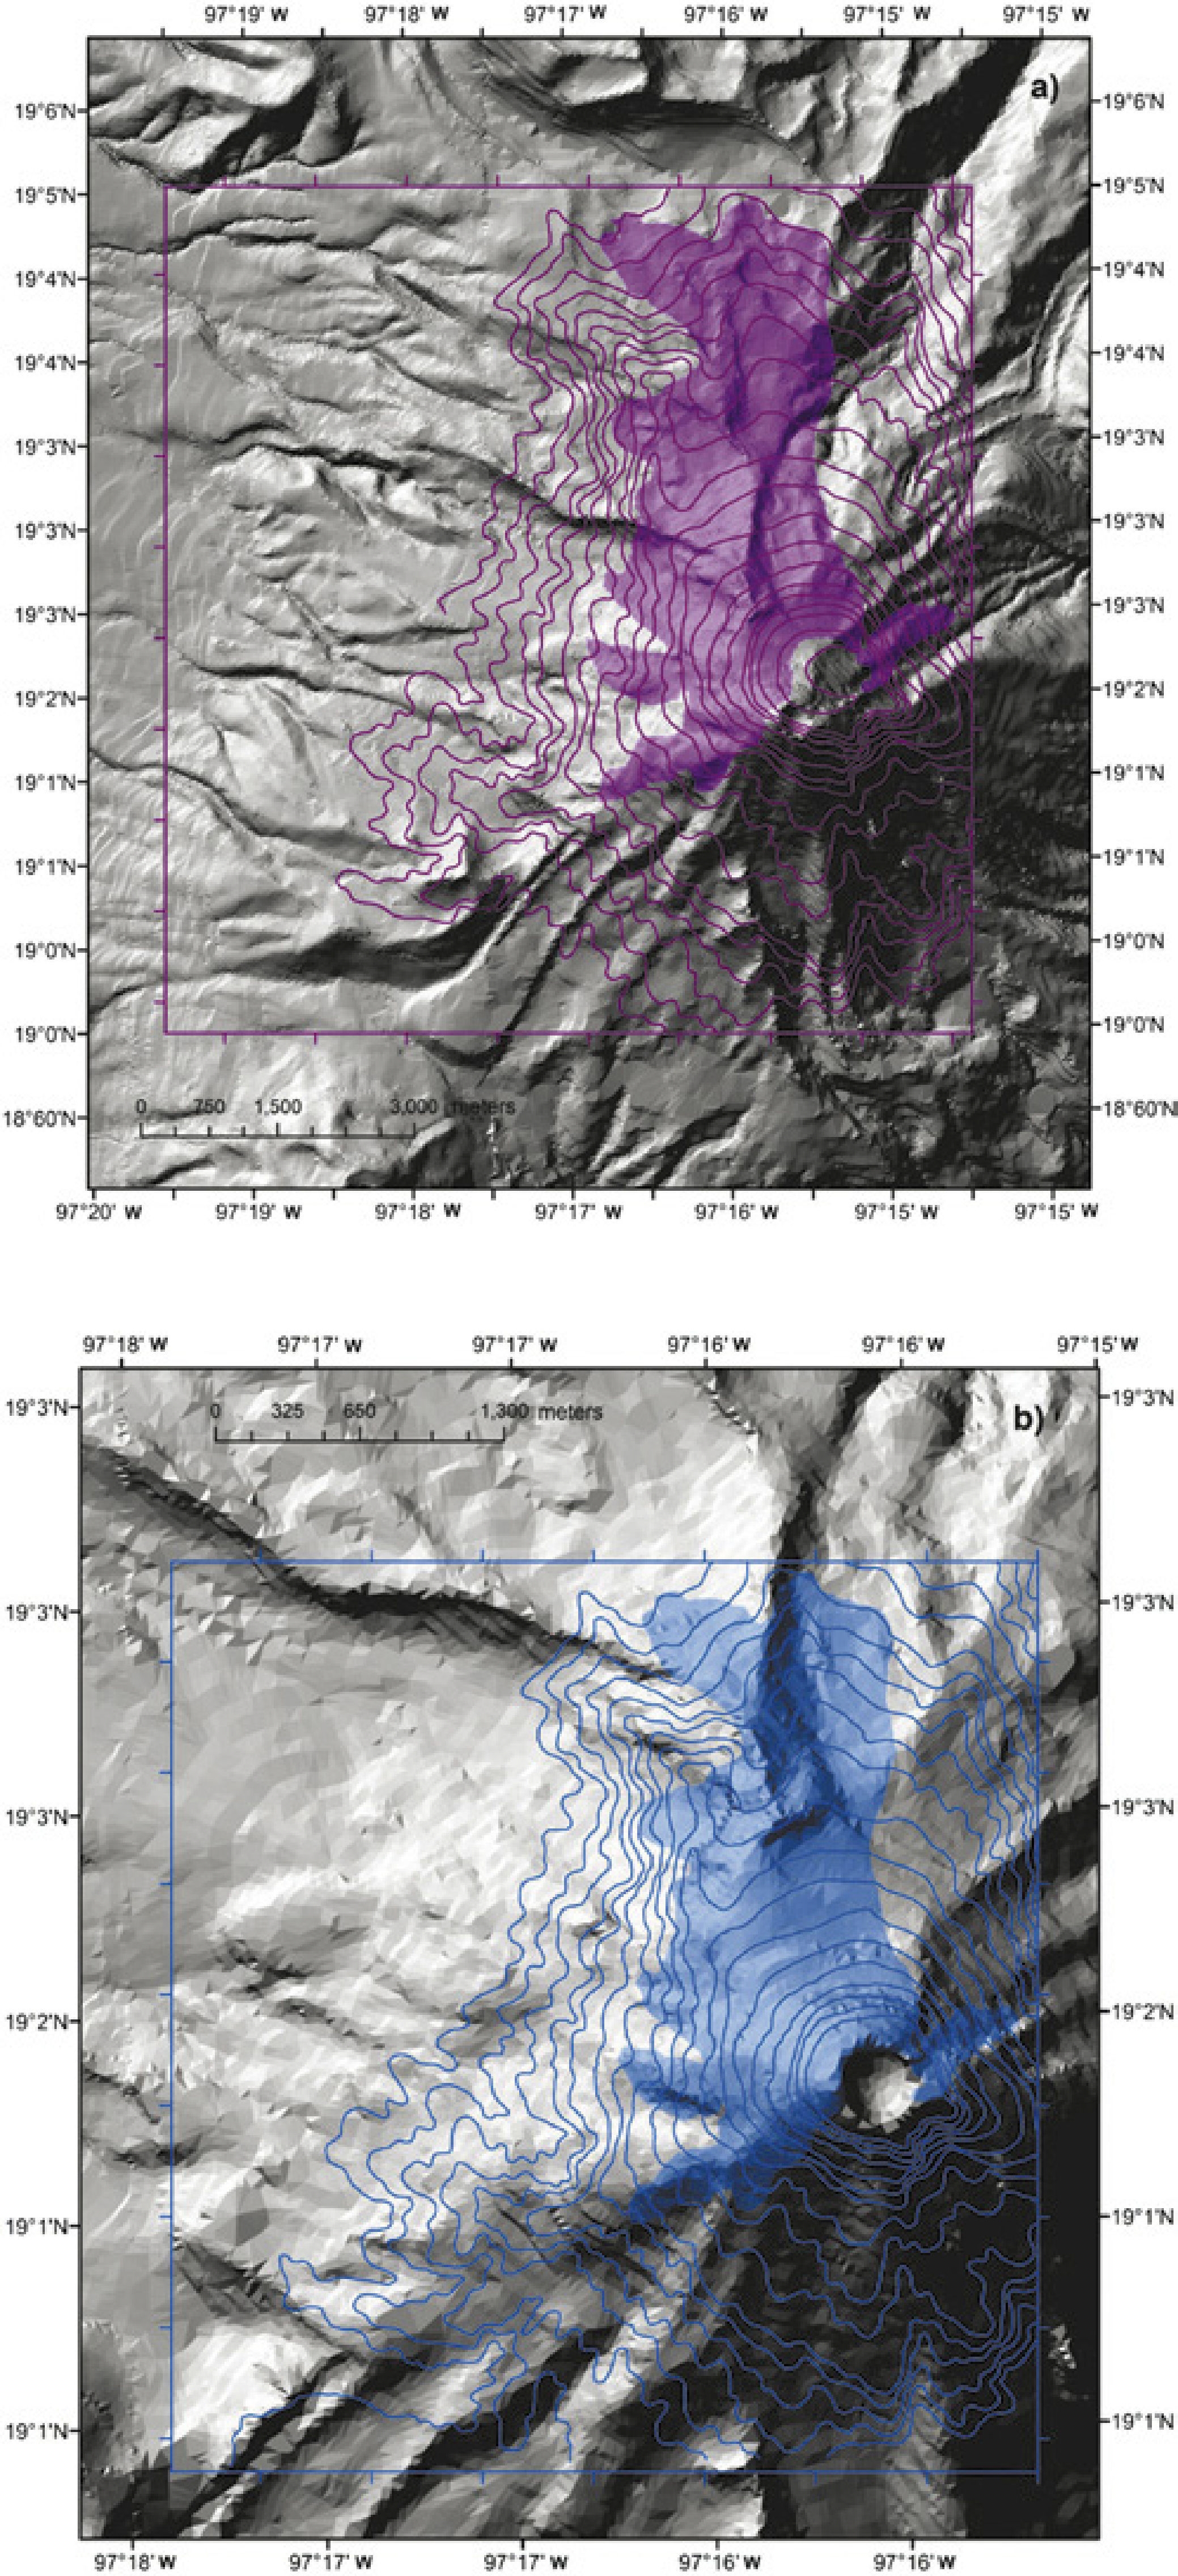
The georeferenced and re-projected topographic map was overlaid with the georeferenced map of Lorenzo (1964) using the GIS interface. Then, they were fixed splicing similar features of the level lines in both maps (Figure 3). The adjustment of the maps was made following similar contour lines in both maps. For that adjustment it was necessary to correct position and size of Glaciar Norte, which presented a slight dephasing according to the topography of the volcano (Figure 4a). At this step, the glacial area represented on the map had an extension of ∼12 km2 (Figure 4a) which is even larger than the area reported by Lorenzo (1964). Since most of the contour lines drawn in 1958 are completely different to the level lines in the topographic map, the main criterion to splice and correct this map was the flow of the contours which had some similar features at both maps. This resulted in a more consistent map with a new scale representing the 1958 glacial extent (Figure 4b). Here, it is necessary to mention the implicit error in this process, attributed to the appreciation of the contours and features when the maps were adjusted visually.
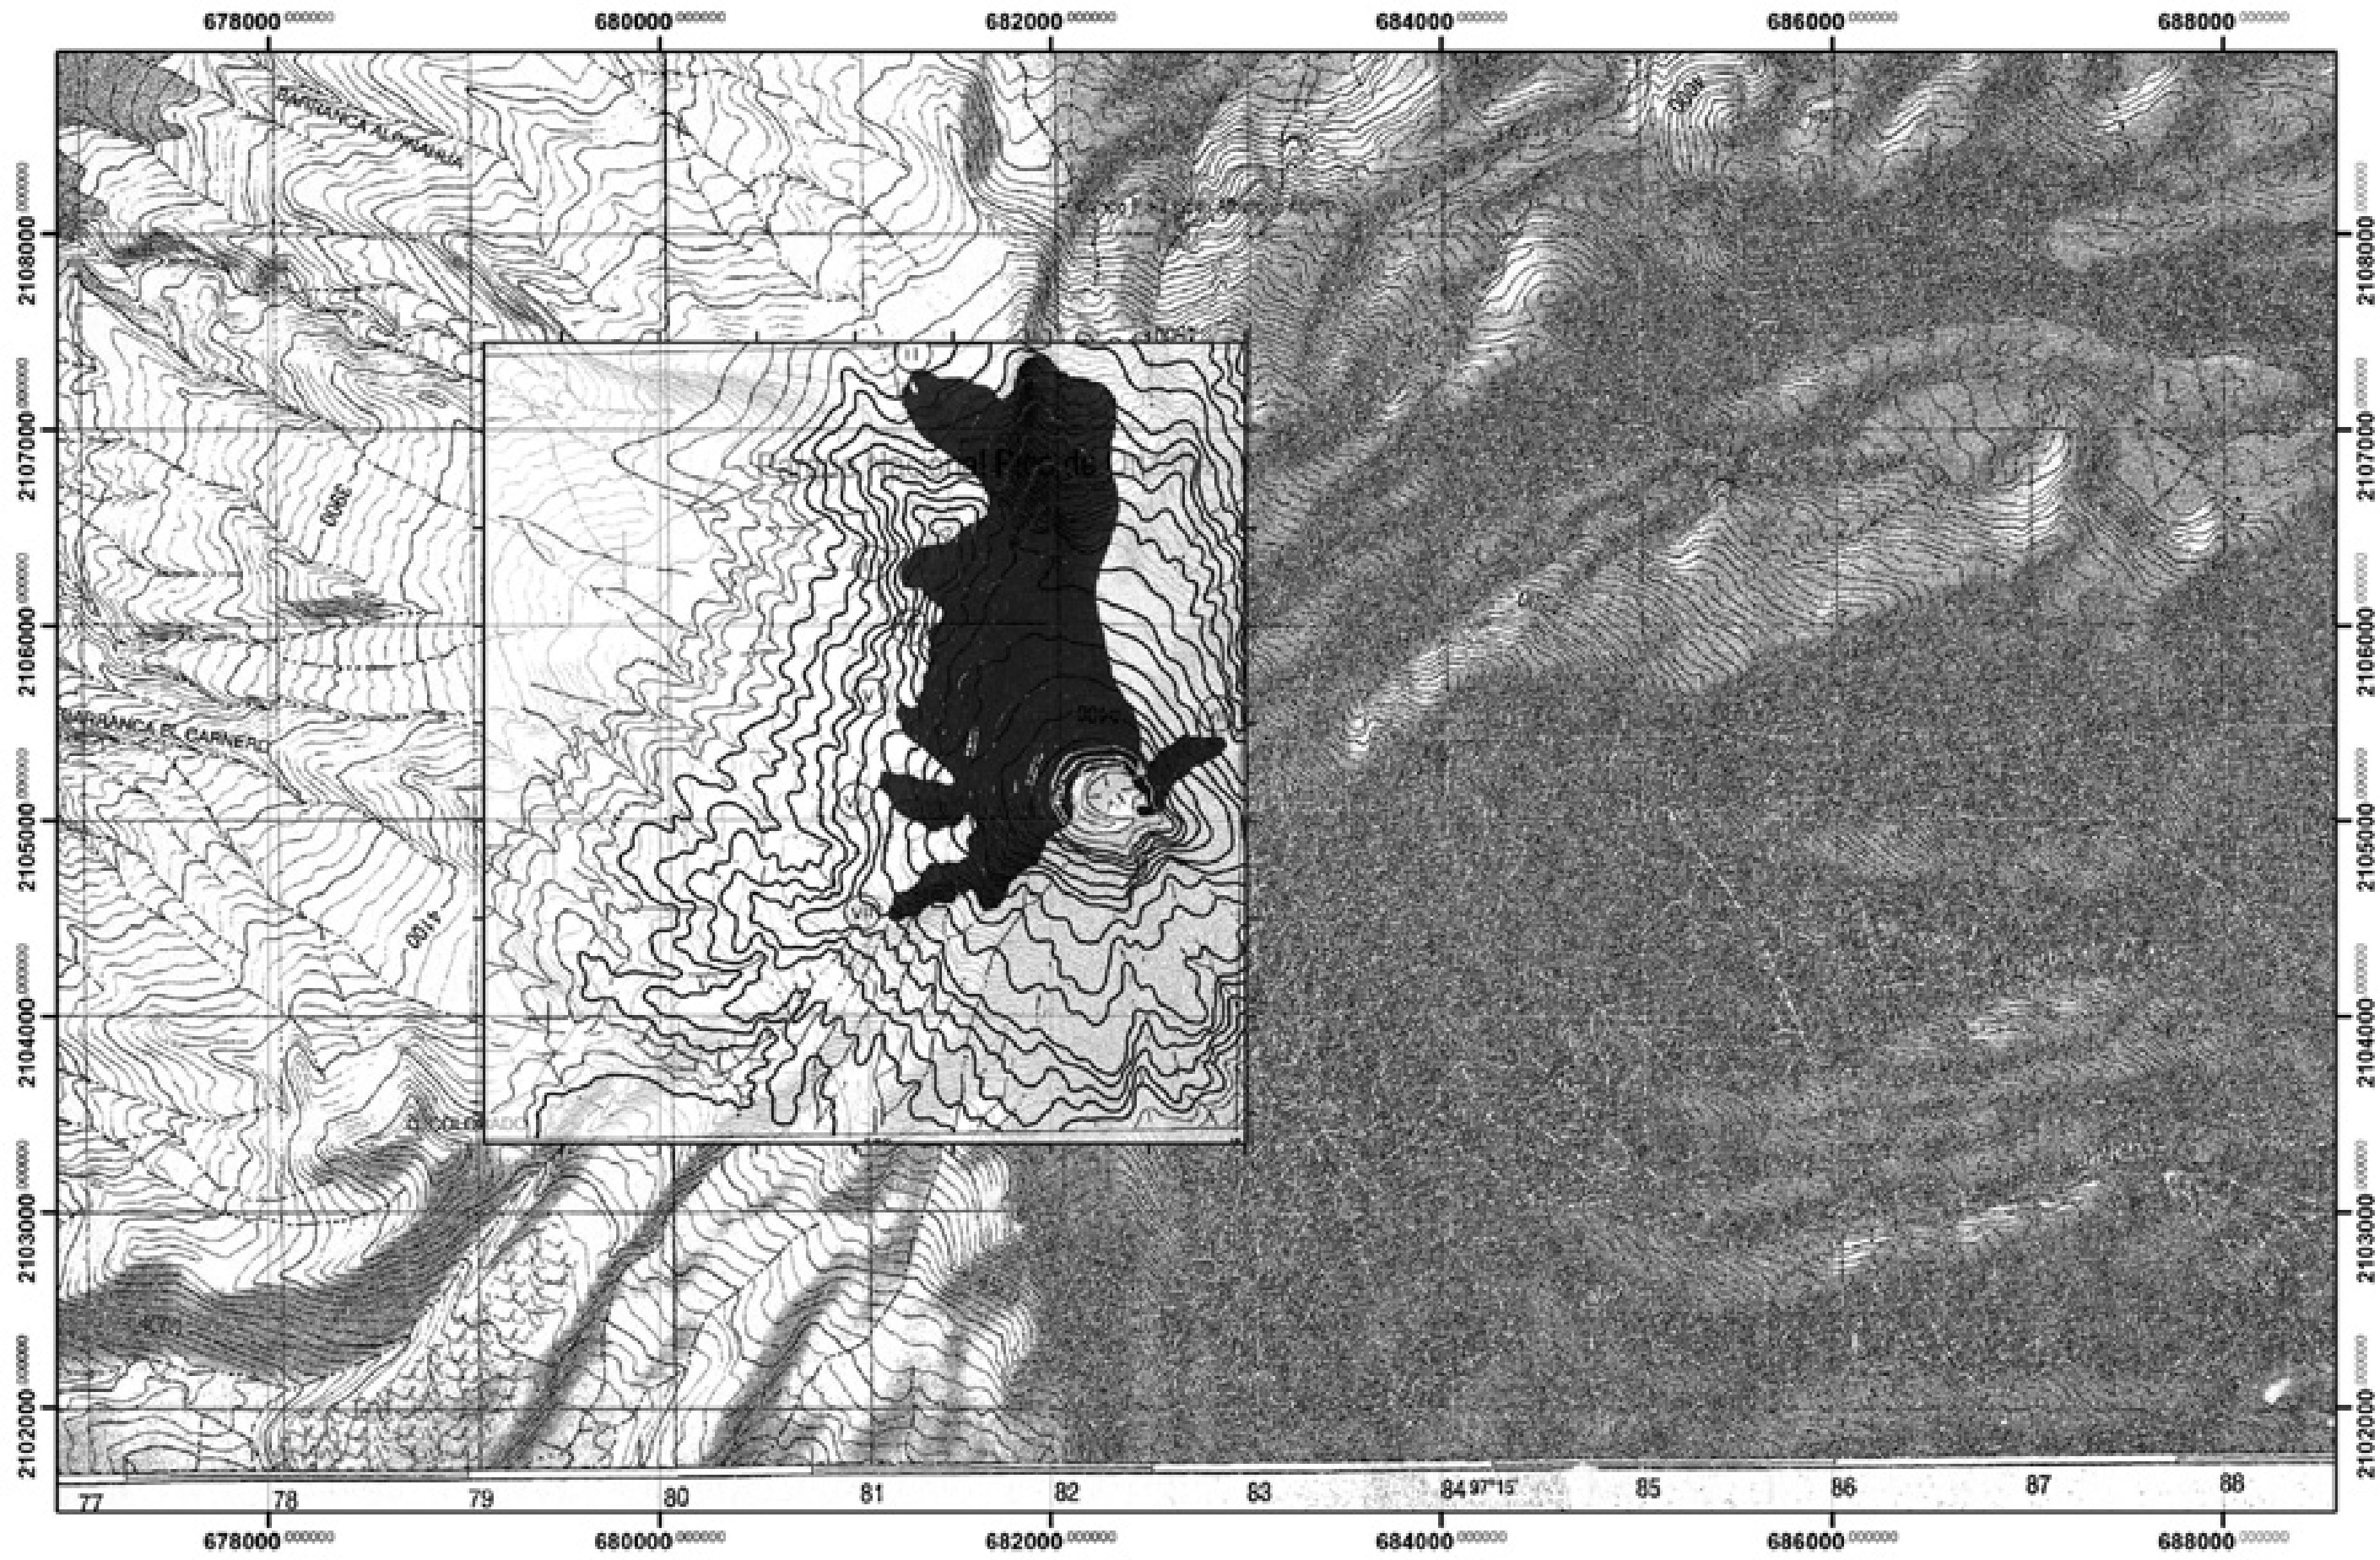
Figure 3 Adjustment of the map of Glaciar Norte with the topographic map according to the level contours of both maps.
Re-shape of Glaciar Norte, 1958
Looking carefully the area covered by this glacier (Figure 4b), a part of it is over the Sarcófago Peak and other well-defined topographic ridges. This feature is wrong because at the time, the ice body occupied the topography within these ridges not covering them. Also, Lorenzo (1964) stated that Jamapa tongue fell down to the right side of Sarcófago Peak as he could see during his field campaign. Since the digitized and georeferenced outline, showed on Figure 4, did not fit correctly the topography, the Glaciar Norte's outline was reconstructed based on photographic material, DEM and GIS interface. The main step for this reconstruction was the recognition of the most characteristic features of the terrain where the ice body was. The descriptions made by Lorenzo (1964) for all the glacial tongues were followed in order to find the outlines, direction and flow of this glacier.
Photographic catalogue analysis
Figure 5 shows some characteristic terrain features: lava flows, moraines, cliffs, and the general geomorphology. These auxiliary features indicate the position of Citlaltépetl's glaciers. Other representative features were also considered like Sarcófago Peak, the crater, the eastern flank of Sarcófago where Jamapa glacier flows down, and the knowledge of the authors about this mountain.

Figure 5 Auxiliary features used for the reconstruction of the 1958 Glaciar Norte, and can be identified in the aerial photographs (a-d) published by Lorenzo (1964). Photograph e was taken in 1975 and orthorectified for this study. Yellow lines depict the two principal peaks of the volcano, green and dotted brown lines represent the cliffs and the front of some lava flows respectively.
The outline of the glacier depicted by Lorenzo (1964) was useful to clearly identify all the glacial tongues and their position. Lorenzo (1964, page 95) stated: "We found that the entire northern side is covered in ice, down to varying altitudes, the lowest being that of the two tongues into which Jamapa glacier divides, and believed, as it was later confirmed, that we had before us the greatest glacier formation of Mexico " (see Figure 5a). Additionally, Chichimeco tongue was identified north to the crater and it was described as a wide glacial tongue poorly developed longitudinally. This tongue also comes from an altitude of ca. 5000 m and the front gets as low as 4,740 m (Figure 5a).
On the western flank of the volcano there are remains of glacial tongues coming from Glaciar Norte. Most of them were hanging glaciers. Starting at the southwestern flank of Sarcófago Peak, El Toro glacier flowed down as an icefall following a step-like topography, stopping at 4,930 m. Something similar happened to La Barba glacier, south of El Toro but whose front reached down an altitude of 5,090 m (Figure 5b). At the western part of Glaciar Norte and south of the big walls of the cliffs there is a poorly recognized glacial tongue called Noroccidental. This glacier descends to 4920 m and is located north of Occidental glacier, which at the same time descends to an altitude of 4980 m from an altitude of 5200 m (Figure 5b and 5c ). Finally, Suroccidental glacier represents the ice mass that follows a Southwest direction from the top of Glaciar Norte, with a low altitude of 4980 m (Figure 5c).
Glaciar Oriental is east of Glaciar Norte and separated from it. This is a niche glacier on to the eastern flank (Figure 5d). It has a maximum and minimum altitudes of 5,500 m and 5,070 m, respectively. Figure 5e shows the entire glaciated area as observed at the orthorectified airphoto of 1975. By this time the glacier system receded and the bedrock of the 1958 glacial cover was exposed.
Finally, using this orthophoto and the analysis made above, the Glaciar Norte outline for 1958 was delimited and reconstructed. This reconstruction is shown at Figure 6 over a 1998 orthophoto (scale 1:25,000) obtained from SCT (1998).
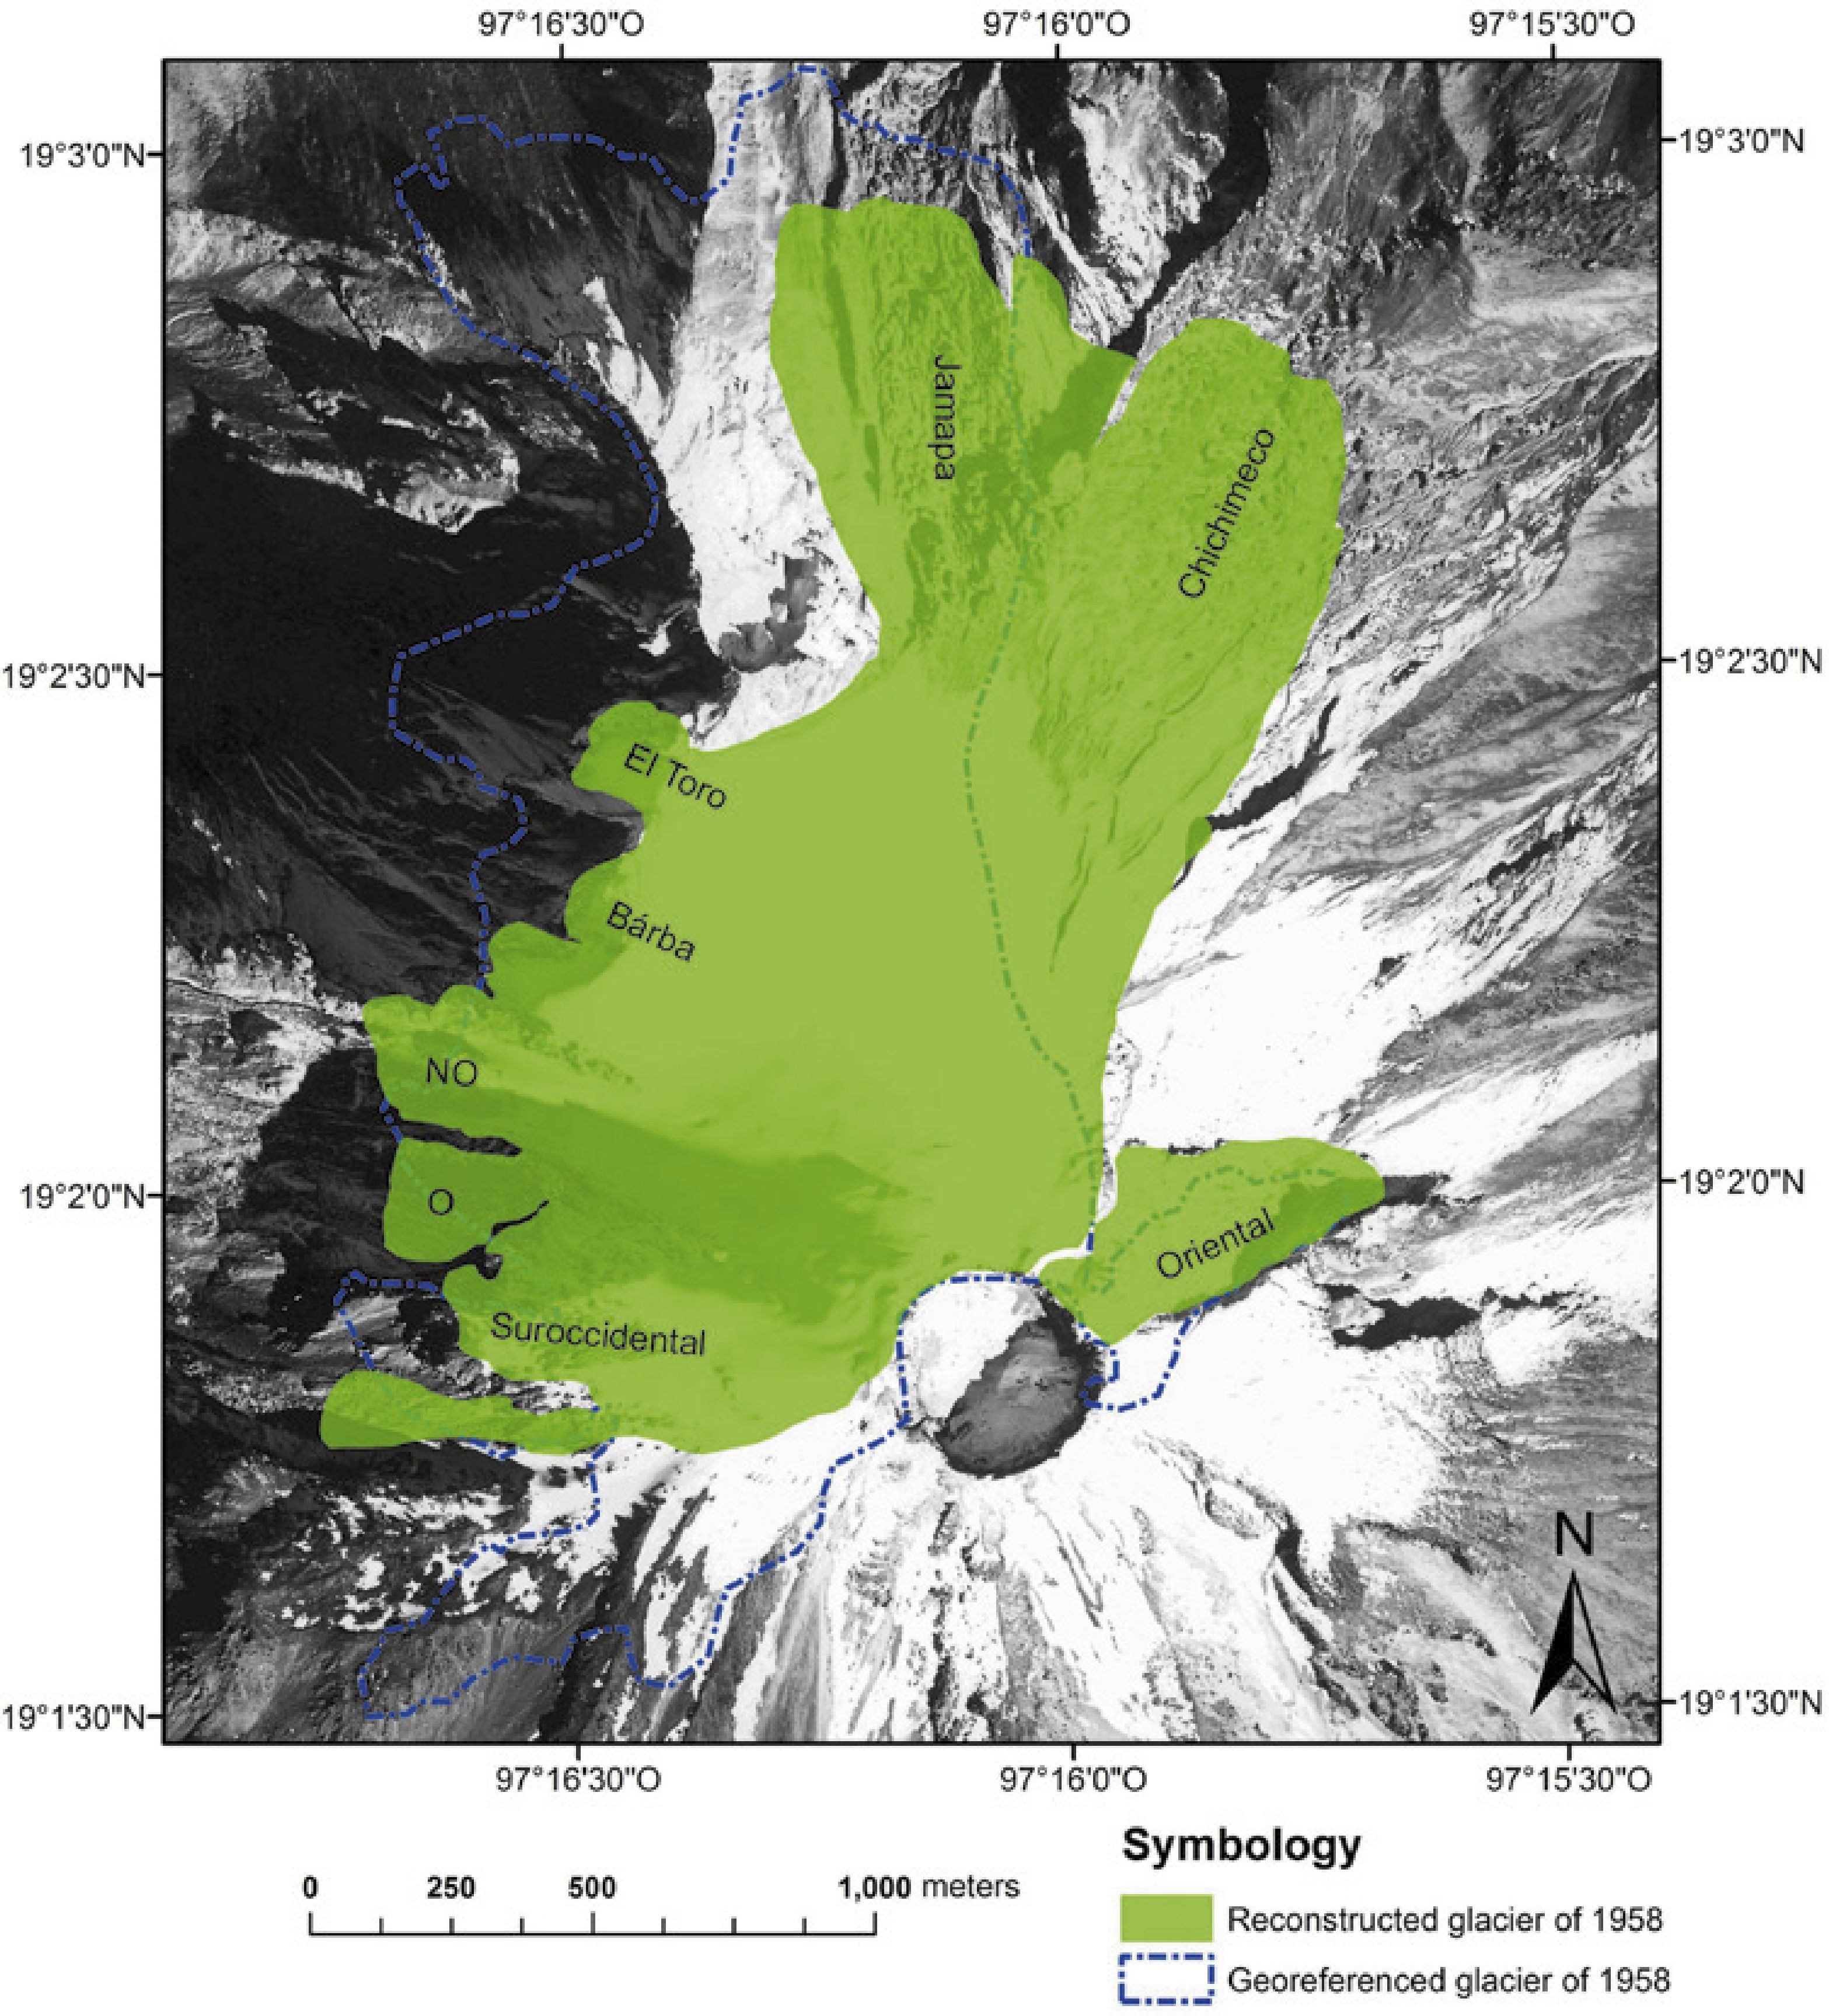
Figure 6 Reconstructed Glaciar Norte for 1958 vs. the geographically corrected Glaciar Norte mapped by Lorenzo in 1958. Orthophoto was made from an aerial photograph taken in December 1998.
From this picture it is clear to see the distortion of the glacier outline made by Lorenzo (1964; Figure 2). However, the idea that he had about the glacial area on Citlaltépetl clearly describes the main features of that glacier as we can compare from Figure 6.
Error estimation
Errors involved in the geographic correction and the reconstruction of Glaciar Norte are considered independent each other because each process of this methodology is independent. Then, errors considered here are attributed to digitization and georeferentiation processes and to the DEM for the calculation of elevations.
Digitization process
The aerial photograph of 1975 was digitalized in a flatbed scanner Epson Expressions 836- XL with a resolution of 600 dpi, equivalent to 42.3 μm of pixel size. Then, the error assigned here was 2.116 m. Further details on error calculation can be found in Linder (2009).
Georeferentiation process
The error after the georeferencing process was estimated in 7m. For georeferentiation of the 1975 photograph we used PCI Geomatica(r) 10.0 software with a DEM resolution of ± 3 m horizontal and ± 5 m vertical.
The final horizontal error for this image is ± 9 m. This is the sum of digitization and georeferencing error. This error is fairly good considering the magnitude of the areas calculated in this study.
DEM error
A 2 m pixel resolution DEM was used for calculation of glacier front elevations. DEM was interpolated from a set of contour lines at 10 m intervals. Due to the vertical error of ± 5 m of the DEM and considering the horizontal error attributed to the orthophoto, the total vertical error is estimated in ± 10 m.
Results
After geographic correction of the 1958 glacier outline mapped by Lorenzo (1964), a new outline of Glaciar Norte digitized and geographically corrected was obtained (Figure 6). This corrected outline had the same geometry determined by Lorenzo (1964) as seen at his Sketch III (Figures 2, 4b , and 6 this study). The outlines were handled as a shape file into a GIS interface obtaining an area of 2.24 km2 (Oriental glacier included) and a minimal altitude for the Jamapa glacier front at 4,670 m. This areal value is very different from that reported by Lorenzo (1964) where he mentioned an area of ∼9.5 km2 and a minimal altitude for the Jamapa glacier front of 4,640 m. In spite of the huge difference, with this corrected value the glacier system of Citlaltepetl still represents the largest glacial area in Mexico for 1958, as compared to the total glacial area of Iztaccíhuatl and Popocatépetl (∼1.93 km2). The reconstructed area of Glaciar Norte shown here is of 2.16 km2 (solid outline in Figure 6) where the area of Oriental glacier is of 0.118 km2. We consider the new outline as a more realistic representation of Glaciar Norte glacier in 1958.
Comparing the resultant outline with that determined in this study for 1975, Chichimeco glacier retracted considerably since 1958. This is not true for the rest of the glaciers, which are still similar. Jamapa glacier also retreated but less than Chichimeco glacier (Figure 7). From this, it is possible to think that retraction of Glaciar Norte from 1958 to 1975 (480,000 m2 or 24%) was caused by the same order- of-magnitude climate effect as in the case of the other two mountains in Mexico, and not by an intense and unique climate change where glacier area lost would be of ca. 8 km2 which means a loss of 84%.

Discussion
After Lorenzo's 1958 glacial inventory, new studies have been done on Citlaltépetl's glaciers in order to understand their dynamics and climate behavior. One purpose of those studies was the evaluation of glacial shrinkage in Mexico, considering the end of the Little Ice Age (LIA) as starting point (e.g. Palacios and Vázquez-Selem, 1996; Álvarez and Delgado Granados, 2002). Recently, Ontiveros-González et al . (submitted) tackle the study of glacial shrinkage in Mexico showing the relationship between the surface energy balance and the retreat of glacierized areas. It is important to notice that most of those studies considered the area and outlines of Glaciar Norte reported by Lorenzo (1964). Caution should be taken because it overestimates the climate effect on the glacial shrinkage in Mexico.
Using the results mentioned above, the evaluation of the glacial retreat on Citlaltépetl can be tackled. Also, a comparison with the retreat at other mountain glaciers around the world (Zemp et al ., 2006) can be attempted. Considering the glacial shrinkage in Mexico starting at the end of the LIA, the Jamapa glacier retreated vertically a little more than 200 m in ca. 108 years considering that the minimal altitude of its front was at ca. 4,395 m (Palacios and Vázquez-Selem, 1996). From 1958 to 2001 the front of Glaciar Norte retreated more than 300 m causing the total disappearance of Jamapa glacial tongue (see Table 1). The last value represents a rapid retreat of the ice body in only 43 years. Then, this could mean a strong direct climatic effect since volcanic activity (diffuse degassing, localized thermal activity of <60oC) is negligible for this volcano.
This interpretation could be misleading because the change only represents the retraction of one glacial tongue. If we consider the areal change of the glaciated area from 1958 to 1975 (Table 1), the glaciated area lost at Citlaltépetl was 24% of the 1958 total area. On the other hand, the ice lost from 1958 to 2001 represented 52% of the 1958 total area that means a retreat rate of 25,000 m2/yr. In spite of this difference, we can see that between 1958 and 1975 the retreat rate is of the same order-of-magnitude as from 1958 to 2001 (28,000 m2/yr). This means that the effect of climate on Glaciar Norte is more or less constant in the short- and long- term; even the glacier front retreats fast (see Delgado Granados, 2007). This is because there are zones prone to retraction due to the slope, aspect and insolation (Cortés-Ramos and Delgado Granados, 2012).
In contrast, considering the value reported by Lorenzo (1964), the 1958-2001 glacial retreat represents a 90% ice loss of the 1958 glaciated area. Then, this dramatic mass loss in just 43 years had to be reflected in the ecosystems and populated areas in the vicinity, something that has not been documented so far. The dramatic shrinkage this data represents, implies an effect of strong climatic changes around the glacial surface characterized by a series of high temperatures, strong radiation and deficits of precipitation. However, there are no references in the literature reporting extreme conditions that produce ∼8 km2 of glaciated area disappearance. Furthermore, it is hard to imagine that a large ice mass melt fast along 43 years without a hydrological report of anomalous floods associated to this retreat at the related irrigation system.
Citlaltépetl volcano's climate is poorly known so far. However, the study of Palacios et al . (1999) about Jamapa glacier mentions that Lauer and Klaus (1975) and Lauer (1978) provided important data about the climatology of the mountain. They said that at 4,000 m on the western slope of the volcano, the mean annual temperature is about 5°C. The average number of days with minimum temperatures below freezing is 200, whereas the average number of days with maximum temperatures below freezing is 45. This area had an annual precipitation of 900 mm being these conditions almost similar along the year. Thus, with these climate conditions, a dramatic shrinkage of the glaciers on Citlaltépetl volcano (8 km2 of extension) cannot be sustained.
Conclusions
The inconsistencies found in this study lead to conclude that the glacial area determined by Lorenzo in 1964 (∼9.5 km2) was wrong. Therefore, the glaciers on Citlaltépetl volcano or the climate conditions in the surrounding area were not very different from those at Popocatépetl and Iztaccíhuatl at the time of that study. Furthermore, considering the altitudes measured in 1958, in average they are comparably the same indicating that climatic conditions for all glacier systems is the same because they reached the same average minimal altitude.
Citlaltépetl's glaciated area reported by Lorenzo (1964) was geographically corrected after an analysis of cartographic errors. Errors were confirmed and mainly attributed to the methodology applied to map the measurements made in the field. Since the cartographic material and the aerial photographs available at the time were poor and not enough, it is concluded that the map published by Lorenzo and his team in 1964 was possibly made by hand and without any auxiliary cartography to support their mapping. As a consequence, the resulting map was a distorted representation of Glaciar Norte where the magnitude of the area was exaggerated and the outlines did not coincide with the topography of the volcano.
A reconstruction of Glaciar Norte was made and the 1958 glaciated area calculated as realistically as possible. The obtained area is useful to better understand the climate effect on the glacier, in spite of paucity of data that may allow for a precise relationship between the glacial shrinkage and the climate factors involved in the process. The new 1958 glaciated area value for Citlaltépetl volcano discard any mechanic, volcanic, or strong climatic event that triggered an accelerated shrinkage of the glacier system, in contrast with the implications that rise when using the value reported by Lorenzo (1964).
Finally, this study is a key to update the glacial inventory at Citlaltépetl volcano and correct that of Mexican glaciers currently existing at the World Glacier Monitoring Service database.

