SciELO - Scientific Electronic Library Online

 
vol.62 número1Supported Ionic Liquid H2 PMo12 O 40 -NMPIL@SiO2 as an Efficient Catalyst for Alkylation of Indoles with Epoxides or Alcohols under Mild ConditionsUse in vitro of Gold Nanoparticles Functionalized with Folic Acid as a Photothermal Agent on Treatment of HeLa Cells índice de autoresíndice de materiabúsqueda de artículos
Home Pagelista alfabética de revistas  

Servicios Personalizados

Revista

Articulo

Indicadores

Links relacionados

  • No hay artículos similaresSimilares en SciELO

Compartir


Journal of the Mexican Chemical Society

versión impresa ISSN 1870-249X

J. Mex. Chem. Soc vol.62 no.1 Ciudad de México ene./mar. 2018

https://doi.org/10.29356/jmcs.v62i1.585 

Articles

Free Radical Scavenging Activity Evaluation of Hydrazones by Quantitative Structure Activity Relationship

Ikechukwu Ogadimma Alisi1  * 

Adamu Uzairu2 

Stephen Eyije Abechi2 

Sulaiman Ola Idris2 

1Department of Applied Chemistry, Federal University Dutsinma, Katsina State, Nigeria.

2Department of Chemistry, Ahmadu Bello University Zaria, Kaduna State, Nigeria.


Abstract.

The 2, 2-diphenyl-1-picrylhydrazyl (DPPH) free radical scavenging properties of selected hydrazone antioxidants was investigated by the application of Quantitative Structure Activity Relationship (QSAR). Density functional theory (DFT) was employed in the optimization of the molecular structures. Internal and external validation as well as y-randomization tests were conducted in order to confirm the statistical reliability and acceptability of the developed models. The leverage approach was employed in the assessment of the applicability domain of the developed model. While the relative contribution and strength of each descriptor in the model was obtained by estimating the variation inflation factor, mean effect, and degree of contribution of each descriptor in the developed model. Model 3 which gave the best validation results was chosen as the best of the five models. This model dictates that the most important descriptors that influence the free radical scavenging activities of the hydrazone antioxidants are the Broto-Moreau autocorrelation - lag 2 / weighted by polarizabilities; Count of atom-type H E-State: H on Csp3 bonded to saturated C; Number of hydrogen bond donors (using CDK H Bond Donor Count Descriptor algorithm); Structural information content index (neighborhood symmetry of 1-order) and the 3D topological distance based autocorrelation - lag 7 / weighted by I-state descriptors. The Structural information content index descriptor was observed to be the most influential of all the descriptors.

Keywords: Hydrazones; Antioxidants; QSAR; Model validation; Molecular descriptors; Model development

Resumen.

Se investigaron las propiedades depuradoras del radical libre 2, 2-difenil-1-picrilhidracilo (DPPH) de hidrazonas antioxidantes mediante la aplicación de Relaciones Cuantitativas Estructura Actividad (RCEA). Se empleó la teoría de funcionales de la densidad (TFD) en la optimización de las estructuras moleculares. Se realizaron validaciones internas y externas, así como pruebas de randomización-y para confirmar la confiabilidad estadística y la aceptabilidad de los modelos desarrollados. Se usó la aproximación “leverage” para establecer el dominio de aplicación del modelo desarrollado. Mientras que la contribución relativa y la fuerza de cada descriptor en el modelo se obtuvo mediante estimación del factor de variación inflación, efecto medio y grado de contribución de cada descriptor. El modelo 3, que produjo la mejor validación de resultados, se escogió como el mejor de los cinco modelos. Este modelo dicta que los descriptores más importantes que influyen la actividad depuradora de radicales libres de hidrazonas antioxidantes son la autocorrelación Broto-Moreau - lag 2 / pesada por polarizabilidades; conteo de átomos tipo estado H E: H en C sp3 enlazados a C saturados; número de donadores de enlace de hidrógeno (usando el algoritmo CDK); índice de contenido de información estructural (simetría de cercanía de orden 1); y distancia topológica 3D basada en autocorrelación - lag 7 / pesada por descriptores de estado I. Se observó que el descriptor índice de contenido de información estructural es el de mayor influencia de todos los descriptores.

Palabras clave: Hidrazonas; antioxidantes; estructura-actividad; validación de modelo; descriptores moleculares; desarrollo de modelo

Introduction

Free radicals have been recognised as chemical entities in which their atomic or molecular orbitals contain unpaired electrons [1]. Reactive Oxygen Species (ROS) and Reactive Nitrogen Species (RNS), are products of normal human cellular metabolism which in low concentrations are beneficial to living systems and harmful at high concentrations. These species comprise both free radical and non-free radical oxygen containing molecules. Physiological significant ROS are the superoxide anion radical (O2-), hydroxyl radical OH, and hydrogen peroxide H2O2. A very important RNS that is generated in biological tissues is nitric oxide radical NO. Defence mechanisms by organisms against free radical-induced oxidative stress include: preventative mechanisms, repair mechanisms, physical defences and antioxidant defences [2]. Antioxidants are chemical entities that scavenge free radicals by either inhibiting their formation or interrupting their propagation. Excessive production of ROS in the human system gives rise to a condition known as oxidative stress. This oxidative stress occurs as a result of increased generation of free radicals in the body. It may also be a consequence of reduced physiological activity of antioxidant defences against free radicals in the human body [3].

The hydrazones have been recognized to possess various biological activities such as antioxidant [4-9], anti-microbial, anti-convulsant, analgesic, anti-inflammatory [10] anti-platelet, anti-tubercular, anti-tumoral and anticancer, antiprotozoal, antiparasitic, cardioprotective, anti-depressant, anti-HIV and trypanocidal activities [11-12].

A data set of 61 hydrazone derivatives with potent antioxidant activities based on 2, 2-diphenyl-1-picrylhydrazyl (DPPH) free radical scavenging assay was obtained from literature [4-9]. The DPPH assay is a technique that is widely employed to test the ability of compounds to act as free radical scavengers, and thus determine their antioxidant activities [13-15].

The entire data set was subjected to Quantitative Structure Activity Relationship (QSAR) studies via quantum modelling. QSAR is based on the assumption that there is an underlying relationship between molecular structure and biological activity [16]. This technique has been observed to be reliable and effective for predicting the activities and properties of untested chemical structures based on their structural similarity to chemicals with known activities and properties [17-18]. The hydrazones and their derivatives have been subjected to QSAR studies in recent time. For instance, Sahu et al, in 2012 [19], carried out quantitative structure-activity relationship (QSAR) analysis on some synthesized substituted 4- quinolinyl and 9-acridinyl hydrazone derivatives in order to find out the structural requirements of their antimalarial activities. Also, a series of novel N'-((5-nitrofuran-2-yl/4-nitrophenyl) methylene) substituted hydrazides and their derivatives have been synthesized, and tested for in vitro antimycobacterial activity, and their QSAR investigated [20].

QSAR is hereby employed in the elucidation of the structural requirements for antioxidant activities of selected hydrazones. Geometry optimization for the entire data set of 61 molecular structures was executed at the density functional theory (DFT) level using Becke's three-parameter Lee-Yang-Parr hybrid functional (B3LYP). This was combination with the 6-311G* basis set. Also, quantum chemical and molecular descriptors were calculated and subjected to data pre-treatment and normalization. The resulting data set was split into training and test sets by Kennard Stone algorithm (KSA). The training set was employed in the development of Quantitative Structure Activity Relationship (QSAR) model by Genetic Function Algorithm (GFA). Furthermore, the developed models were subjected to internal validation, external validation and y-randomization tests in order to determine their predictability, acceptability and robustness. The Variation Inflation Factor (VIF), Mean Effect (MF) and Degree of Contribution (DC) of the descriptors in the developed model were computed. Also, the applicability domain of the model was accessed by the leverage approach.

Experimental

Data Set

The 61 hydrazone data series were obtained from literature [4-9]. The antioxidant activities of the entire data set was evaluated using 2, 2-diphenyl-1-picrylhydrazyl (DPPH) free radical scavenging assay with the 50% inhibition concentrations IC50) converted to uniform units of μg/ml. The antioxidant activities for the considered hydrazone derivatives are represented by their IC50 values. The IC50 values were also converted to their corresponding pIC50 values according to equation (1). This is to ensure that the data generated is uniformly distributed.

pIC50=-logIC50×10-6 (1)

Geometry optimization and Descriptors calculation

The ChemDraw software [21] was employed in drawing the chemical structures of the compounds. Optimization of the molecular geometries was accomplished using Spartan 14 software (Spartan 14v112) [22] at the density functional theory (DFT) level of theory. The 6-311G* basis set was used in conjunction with the Becke's three-parameter Lee-Yang-Parr hybrid functional (B3LYP) without symmetry constraints [23]. The choice of this optimization condition lies on the fact that B3LYP/6-311G* gives excellent geometries and has the ability to make reliable estimation of the antioxidant properties of a compound [24]. A set of quantum chemical descriptors were also generated using the same software. These optimized molecular structures were later submitted for the generation of molecular descriptors using the PaDEL program package (version 2.20) [25].

Data Pre-Treatment and Normalization

Data pre-treatment was accomplished by removing descriptors having constant values and pairs of variables with correlation coefficient greater than 0.9 using "Data Pre-Treatment GUI 1.2" tool that uses V-WSP algorithm [26, 27]. Also, the entire data set after pre-treatment was normalized by scaling between the interval N0,1 [28, 29].

Creation of Training and Test Set

The program, "Dataset Division GUI 1.2" [30] was employed in the rational selection of training and test sets from the data set of 61 chemical structures. This procedure generated the training and test sets by Kennard Stone algorithm (KSA).

Model Development

The training set compounds were employed in the development of the QSAR model.

The independent variables (quantum chemical and molecular descriptors) and the dependent (response) variables pIC50) were subjected to multivariate analysis by Genetic Function Approximation (GFA) using the material studio software. During the model development, 50,000 crossovers, a smoothness value of 1.00 with an initial of three and a maximum of five terms per equation were considered. The Friedman lack-of-fit (LOF) value was calculated using equation (2):

LOF=SSE1-c+d×pM2                     (2)

Where SSE is the sum of squares of errors. c is the number of (basis functions) terms in the model, other than the constant term. d is a user-defined smoothing parameter which was set to 1.00. p is the total number of descriptors contained in all model terms (again ignoring the constant term), while M is the number of samples in the training set [31].

Internal Validation of the Developed Models

Methods employed in the internal validation of the developed models could be by least squares fitting method, Bootstrapping method, cross-validation (CV) method or randomization tests. In this research, the methods of cross-validation (CV) and randomization were employed. CV was carried out by leave- one- out (LOO) technique. This method involves the elimination of one compound from the data set at random in each cycle and building the model using the rest of the compounds. The activity of the eliminated compound is then predicted using the generated model. This process is repeated until all the compounds have been eliminated once.

The internal validation parameters calculated include:

The correlation coefficient, R, that measures how closely the observed data tracks the fitted regression line and thus helps to quantify any variation in the calculated data with respect to the observed data [32].

The Cross-validated squared correlation coefficient, Rcv2(Q2) was calculated using equation (3).

Q2=1-Yobs-Ypred2Yobs-Y-2                   (3)

Where Yobs is the observed activity of the training set compounds, Ypred is the predicted activity of the training set compounds, while Y- is the mean observed activity of the training set compounds.

A modification of R2 called the adjusted R2 Ra2) was also calculated using equation (4).

Ra2=n-1R2-pn-p-1 (4)

Where p is the number of predictor variables used in the model development.

Furthermore, the variance ratio, F value (the ratio of regression mean square to deviations mean square) was calculated using equation (5). This parameter was computed in order to judge the overall significance of the regression coefficients.

F=Ycal-Y-2pYobs-Ycal2N-P-1   (5)

The Standard Error of the estimate (s) was calculated using equation (6).

s=RSSn-p'   (6)

Where RSS is the sum of squares of the differences (residuals) between the experimental and estimated responses Yobs-Ypred2   when predictions are made for objects in the training set. p' is the number of model variables plus one, and n is the number of objects used to calculate the model [33].

The Y-randomization test which checks the robustness of the developed QSAR model was also conducted. In this test, validation was performed by permuting the Activity ( pIC50) with respect to the descriptor matrix which was unaltered [34].

According to Roy and Paul [35], the deviation in the values of the squared mean correlation coefficient of the randomized model ( Rr2) from the squared correlation coefficient of the non-random model ( R2) is reflected in the value of Rp2 as given in equation (7).

Rp2=R2×R2-Rr2 (7)

Furthermore, Todeschini in 2010 [36], suggested a correction for Rp2 as defined in equation (8).

cRp2=R×R2-Rr2 (8)

The Y-randomization results were generated using the program "MLR Y-Randomization Test 1.2" [37].

External Validation

In order to access the internal stability and predictive ability of the models, external model validation was executed. The developed models were subjected to external validation through the computation of the following external validation parameters:

The predictive R2 (R2pred) which is the predicted correlation coefficient calculated from the predicted activity of all the test set compounds. The R2pred was calculated using equation 9.

R2pred=1-YpredTest-YTest2YTest-Y-Training2               (9)

Where Y-Training is the mean activity value of the training set. While YpredTest and YTest are the predicted and observed activity values, respectively, of the test set compounds. According to Supratik and Kunal [38], the R2pred may not truly reflect the predictive ability of the developed model since it depends on the YTest-Y-Training2 value. For this reason, a modified R2 called r2m is thus introduced as defined in equation (10) [39].

r2m=r21-r2-r02                      (10)

Where r02 and r2 represent squared correlation coefficients of linear relations between the predicted and observed values of the compounds with intercept set to zero and intercept not set to zero respectively. The r2m parameter determine how closely the predicted activity data fits the corresponding observed activity range [40]. If the predicted values are considered in the y-axis and the observed values in the x-axis, we generate rm'2> as defined in equation (11).

rm'2=r2×1-r2-r0'2                      (11)

Also, a plot of predicted values of test set compounds against the observed values with intercept set to zero has slope equal to k. Interchange of the axes gives slope equal to k'[41]. These parameters were calculated using equations (12) and (13) respectively.

k=yiy-iy-i2                           (12)

k'=yiy-iyi2                           (13)

Where yi and y-i are the Predicted and experimental activities respectively.

The program: External Validation Metric Calculator "DTC-MLR Plus Validation GUI 1.2" [(27, 42-44)] was employed in the computation of the external validation parameters.

Applicability Domain

The applicability domain for the developed QSAR model was accessed by utilizing the leverage approach [45-48]. For the calculation of the leverage value for all compounds in the dataset, the hat matrix (H) as defined in equation (14) was employed

H=XXTX-1XT                                        (14)

Where X is the Two-dimensional n×k descriptor matrix of the training set compounds comprising of n compounds and k descriptors employed to develop the model while, XT is the transpose of X. Meanwhile, the leverage value of the ith compound (hi) which is the ith diagonal element of H was computed as presented in equation (15):

hi=xiXTX-1xiT       i=1,,m                                       (15)

The leverage threshold, warning leverage or cut-off leverage value, h*, is the limit of normal values for X outliers as defined by equation (16) [49]:

h*=3k+1n                              (16)

The standard residuals were calculated using equation (17):

Standard Residual=ResidualRMSE                            (17)

Where RMSE is the root mean square error.

Estimation of the Variation Inflation Factor (VIF)

The variation inflation factors (VIF) was calculated using equation (18). This factor indicates the multi-collinearity, among the descriptors in the developed model.

VIF=11-r2               (18)

Where r is the correlation coefficient of multiple regressions of one descriptor with the other descriptors in the QSAR model.

Estimation of the Mean Effect and Degree of Contribution of the Descriptors

The relative significance and contribution of a descriptor in comparison to other descriptors in the developed model is described by the magnitude and sign of its mean effect (MF). In this research, the MF for each descriptor was calculated using equation (19).

MFj=βji=1i=ndijjmβj1ndij             (19)

Where MFj is the mean effect for the considered descriptor j, βj is the coefficient of the descriptor j, dij is the value of the target descriptors for each molecule, while m is the number of descriptors in the model.

Also, the degree of contribution (DC) defined as the standardized regression coefficient was calculated for each descriptor in the developed model. Computation of the DC value for each descriptor is very useful as those with high values are considered very crucial in influencing the predictivity of the developed model.

RESULTS AND DISCUSSION

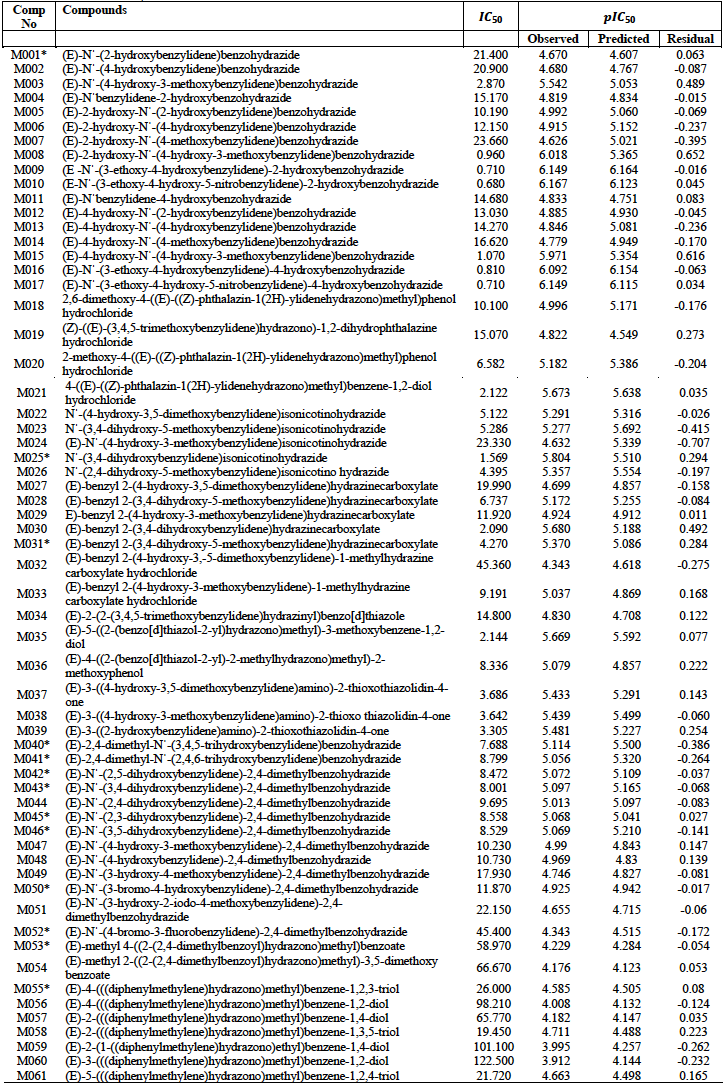
The entire data set and their activities is presented in table 1. After minimization of the various compounds in the data set a total of 32 quantum chemical descriptors were generated. These were combined to the 1875 molecular descriptors which comprise constitutional, topological, Geometrical, RDF and 3D-Morse descriptors to give a total of 1907 descriptors.

Table 1 Hydrazone antioxidants data set and their activities 

*Test Set

Upon data processing, 1165 descriptors were produced. This overcomes the tendency of the developed model failing in its predictivity. Also, the normalized data was obtained after processing. Data Normalization reduces the tendency of any descriptor dominating the model because of larger or smaller pre-scaled value. The results of data division generated 48 molecular compounds (comprising about 80% of total compounds) in the training set and 13 compounds (comprising about 20% of total compounds) in the test set.

A total of five models were developed from the training set as presented in table 2. This table indicates that the minimum number of descriptors per model is four, while the maximum value is five.

Table 2 Developed models for hydrazone derivatives by genetic function algorithm 

The predicted activities of the training set compounds by the five developed models were also generated as presented in table S1 of the supplementary material. The predicted activities of were found to correlate appreciably with experimental activities as reflected in the results of internal validation presented in table 3.

Table 3 Summary of internal validation results for hydrazone antioxidant derivatives 
The criteria for model acceptability is: R2 0.6

From table 3, we observe that all the five models satisfied the conditions for internal validation. Model 2 has the highest R2, Ra2 and Q2 values of 0.80699, 0.78401 and 0.76700 respectively. It also has the lowest Standard Error value of 0.26856. While model 1 ha the lowest R2, Ra2 and Q2 values of 0.77532, 0.75442 and 0.73686 respectively. Model 1 also has the highest Standard Error value of 0.28637. Recall that Ra2 overcomes the draw backs associated with the value of R2. The value of Ra2 increases only if the addition of new descriptors to the developed QSAR model improves the model more than what would be expected by chance (Rudra and Kunal, 2012) [39].

The developed models were further employed in the prediction of the test set activities whose results are presented in table S2 of the supplementary material.

The Y-Randomization test results for the five developed models are given in table 4. These results were all within the acceptable values which stipulate that R 0.8,R20.6,Q2>0.5,Rp20.5. This is an indication of the strong reliability and robustness of the developed models. Thus, they are not the mere outcome of chance. From the recorded values, model 2 has the highest Rp2 value of 0.76992 and closely followed by model 3 with a value of 0.76488 while model 1 has the lowest value of 0.73042. Models 2 and 3 are hereby recognized as the most robust of the five models. Thus, based on the results of internal validation, model 2 is recognized as the best of the five models.

Table 4. Results of y-randomization for hydrazone antioxidant derivatives 

*Model acceptability criteria: R0.8, R2 0.6, Q2 > 0.5, c RP2 0.5

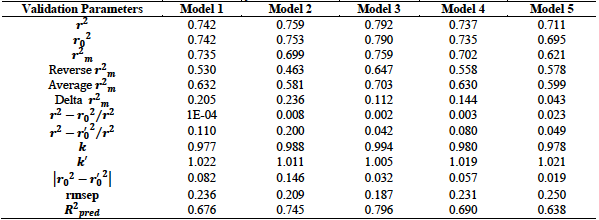
The test set compounds and their predicted activities were employed in the external validation of the developed models. External validation determines the predictive capacity of the developed models. It judges the ability of the developed models to predict the test set activity values. The results of the external validation are summarized in table 5. This result shows that the five models met all the requirements for acceptability with model 3 having the best results in terms of the external validation parameters. This model has the highest R2pred, r2 and r2m values of 0.79617, 0.79192 and 0.75880 respectively. Also, it has the lowest rmsep value of 0.18713.

Table 5. External validation results for hydrazone antioxidant derivatives 

The acceptable threshold values for the given parameters are as follows: R2pred>0.5,r2>0.6,r2m0.5, Delta r2m<0.2, r02-r0'2<0.3,(r2-r02)/r2<0.1   and   0.85k1.15, or (r2-r0'2)/r2<0.1 and 0.85k'1.15(Golbraikh and Tropsha, 2002)

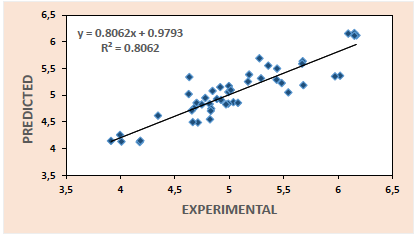
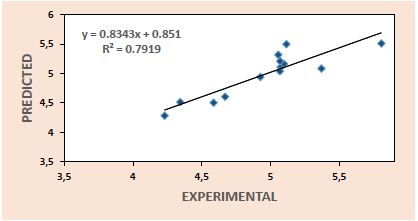
Thus, the plots of predicted activities against experimental activities for the training set (Fig. 1) and test set (Fig. 2) are generated using the results of model 3. These plots indicate very good agreement between the experimental and predicted values with impressive squad correlation coefficient R2 values of 0.8062 and 0.79190 for the training and test sets respectively.

Fig. 1. Plot of experimental activities against predicted values for training set of hydrazone antioxidants. 

From the various validation tests conducted, we observe that all the five models generated in this research met the necessary requirements for acceptability with model 3 recording the best result. This model together with the relevant validation parameters are summarized below:

pIC50 = - 0.76454 * ATS2p + 0.81595 * nHCsats + 0.94990 * nHBDon + 1.28861 * SIC1 - 0.58172 * TDB7s + 4.57149

R=0.89786,R2=0.80615 , Q2(R2CV)=0.76487   R2pred=0.79617 and Rp2=0.76488 , s=0.26914,    rmsep =0.18713, nTest=48,nTrain=13.

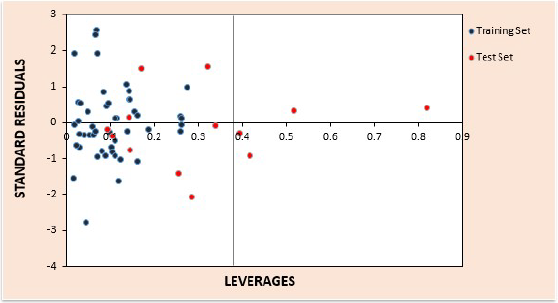
The results of applicability domain for the best developed model are given in tables S3 and S4 of the supplementary material for the training and test sets respectively. The computed value for leverage threshold, h* is 0.375. The William’s plot for estimation of the applicability domain for this model is presented in Fig. 3. In the Williams plot, the applicability domain was established inside a squared area within ±2.5 bound for residuals and a leverage threshold h*. Prediction for compounds with high leverage values ( h>h*) were considered unreliable since they are extrapolations from the structural domain of the model [50, 51]. From Fig. 3 we observe that, no response outliers were detected for the training and test set compounds as all the compounds lie within the applicability domain of the developed model. We also observed that four structural outliers were detected for the test set compounds, while none was detected for training set. Based on the observed results of the applicability domain, the chemical space where this model makes predictions with a given reliability is defined.

Fig. 2. Plot of experimental activities against predicted values for test set of hydrazone antioxidants. 

Fig. 3. Williams plot, the plot of standard residuals against leverages for the hydrazone antioxidant data set. 

The results for the computation of the mean effect (MF) variation inflation factor (VIF) and degree of contribution (DC) of the descriptors are presented in table 6.

Table 6. Specifications of coefficient, standard error, mean effect, variation inflation factor and degree of contribution of the descriptors 

ATS2p (Broto-Moreau autocorrelation - lag 2 / weighted by polarizabilities). This is a 2D Autocorrelation Descriptor that measures the distribution of atomic polarizability on the topology of the molecule. From table 6, the ATS2p descriptor is negatively correlated with the antioxidant activities of the hydrazone derivatives with a coefficient value of -0.76454. In terms of its degree of contribution to the developed model, it has a value of -4.39033 which actually supports its negative correlation. In terms of its degree of contribution to the developed model, it has the lowest value of -4.39033 which actually supports its negative correlation.

nHCsats (Count of atom-type H E-State: H on C sp3 bonded to saturated C). This is a 2D Electrotopological State Atom Type Descriptor. These descriptors are results of the electronic environment of the atom in question due to its intrinsic electronic properties in combination with the influence of other surrounding atoms. The nHCsats descriptor indicates the number of sp3 carbons bonded to other saturated carbon atoms in the molecule. This descriptor is observed to be positively correlated with the antioxidant activities of the coumarins, with a value of + 0.81595. This implies increase in this property among the coumarins, increases their antioxidant activities. The DC and MF values are 5.31345 and 0.47766 respectively.

nHBDon (Number of hydrogen bond donors (using CDK H Bond Donor Count Descriptor algorithm). This is a 2D PaDEL H Bond Donor Count Descriptor that signifies the number of hydrogen bond donors in the molecule. From the designed model, this descriptor is positively correlated with the free radical scavenging activity of the hydrazones with the highest positive coefficient value of 0.94990. Thus, increase in the number of hydrogen bond donors among the hydrazone antioxidants strongly results to an increase in their ability to scavenge free radicals. The results of DC and MF are also encouraging with values of 4.93590 and 0.55608 respectively.

SIC1 : Structural information content index (neighbourhood symmetry of 1-order). This descriptor signifies the total number of atoms of a given order that are present in a molecule. It is positively correlated with the antioxidant activities of the hidrazone with the highest values of coefficient (1.28861), MF (0.75437) and DC (7.31789) (table 6). Thus, there is good correlation in the results of the MF, DC and descriptor coefficient values for the descriptor SIC1. In comparison to the other descriptors, this descriptor recoded the highest value for these parameters. This is an indication of the strong influence of this descriptor in determining the antioxidant properties of the hydrazones. These results indicate the dominance of this descriptor as the most crucial descriptor that influence the free radical scavenging activity of the Hydrazone antioxidants. Therefore, in the design of potent antioxidants based on the hydrazine moiety, with improved activities, emphasis must be paid on this descriptor.

TDB7s (3D topological distance-based autocorrelation - lag 7 / weighted by I-state). This is a topological distance-based descriptor that also encodes information about the 3-dimenional spatial separation between atoms. The TDB7s descriptor is negatively correlated with the free radical activity of the hydrazones with a coefficient value of -0.58172. This is in agreement with the DC and MF values of -2.58458 and -0.34054 respectively. These results are the lowest in comparison with the values for the other descriptors in the developed model.

From table 6, we also observe that the highest computed VIF value is 1.65056 which corresponds to the descriptor TDB7s, while the lowest value is 1.19367 and this corresponds to the descriptor nHCsats. Thus, the computed VIF values were all greater than 1.00 and less than 5.00. This is an indication that the developed model met the requirements for acceptability since these results are within the acceptable range. Recall that when VIF is equal is equal to 1, there is no inter-correlation among the descriptors. If the value lies within the range 1-5, the model is acceptable. While a VIF value larger than 10 suggests that the model is unstable [52].

Conclusion

This research explored the quantitative free radical scavenging activities of the hydrazone antioxidants by the application of quantitative structure activity relationship studies. Five models were developed, with model 3 chosen as the best of the five models based on its excellent validation parameters. This model indicates that Broto-Moreau autocorrelation - lag 2 / weighted by polarizabilities; Count of atom-type H E-State: H on C sp3 bonded to saturated C; Number of hydrogen bond donors (using CDK H Bond Donor Count Descriptor algorithm); Structural information content index (neighbourhood symmetry of 1-order) and the 3D topological distance based autocorrelation - lag 7 / weighted by I-state descriptors are the main descriptors that influence the antioxidant activities of the hidrazone derivatives. Thus, the ability of a descriptor in a model to influence the activity of a compound is determined by its sign, magnitude, degree of contribution and mean effect values.

Also, the results of this research demonstrate the development of a highly predictive model that can efficiently be employed in the design of new set of hydrazone antioxidants with potent free radical scavenging activities.

References

1. Zhang, K; Ding, W; Sun, J; Zhang, B; Lu, F; Lai, R; Zou, Y.; Yedid, G. Biochimie, 2014, 107, 203-210. [ Links ]

2. Valko, M; Leibfritz, D; Moncol, J; Cronin, M.T.D; Mazur, M.; Telser, J. Int. J. Biochem. Cell Biol., 2007, 39, 44 - 84 . [ Links ]

3. Borut, P; Dušan, Š.; Irina, M. Oxid. Med. Cell. Longevity, 2013, 2013, 1-11. [ Links ]

4. Wang, Q; Pan, Y; Wang, J; Peng, Q; Luo, H.; Zheng, J. Afr. J. Biotechnol., 2011, 10(78), 18013-18021. [ Links ]

5. Vanucci-Bacqué, C; Carayon, C; Bernis, C; Caroline Camare, C; Nègre-Salvayre, A; Bedos-Belval, F.; Baltas, M. Bioorg. Med. Chem. 2014, 22, 4269-4276. [ Links ]

6. Muhammad, T; Nor, H. I; Waqas, J; Sammer, Y; Faridahanim, M. J; Muhammad, I. A; Syed, M. K.; Ejaz, H. Molecules, 2013, 18, 10912-10929. [ Links ]

7. Kodisundaram, P; Duraikannu, A; Balasankar, T; Sundarao, A. P.; Roy, K. Int. J. Mol. Cell Med. 2015, 4(2), 128-137. [ Links ]

8. Manimaran, M., Ganapathi, A.; Balasankar, T. Open J. Med. Chem., 2015, 5, 33-47. [ Links ]

9. Khalid, M. K; Fazal, R; Ajmal, K; Sajjad, A; Muhammad, T; Syed, M. S; Momin, K; Najeebullah, A. S; 10. Shahnaz, P.; Muhammad, I. C. J. Chem. Soc. Pak., 2015, 37(3), 479-483. [ Links ]

10. Anu, K; Suman, B; Neha, S; Sunil, K.; Vipin, S. Int. J. Med. Chem. 2014, 2014, 1-11. [ Links ]

11. Sevim, R.; Küçükgüzel, S. G. Molecules, 2007, 12, 1910-1939. [ Links ]

12. Thiyagarajan, G; Anjana, P; Nithya, P.; Ashutosh, P. Int. J. Org. Chem. 2011, 1, 71-77. [ Links ]

13. Parameswaran, K; Sivaguru, P.; Appaswami, L. Bioorg. Med. Chem. Lett. 2013, 23, 3873-3878. [ Links ]

14. Srinubabu, M; Makula, A; Muralidharan, V.; Rambabu, M. Int. J. Pharm. and Pharm. Sci. 2014, 6(6), 254-258. [ Links ]

15. Sandeep, T; Arunadevi, P; Ravi, J.; Sarangapani, M. J. Chem. & Pharm. Res. 2015, 7(7), 517-524. [ Links ]

16. Ravichandran, V; Harish, R; Abhishek, J; Shalini, S; Christapher, P. V.; Ram, K. A. Int. J. Drug Des. Discovery 2011, 2(3), 511-519. [ Links ]

17. Wong, K. Y.; Mercader, A. G.; Saavedra, L. M.; Honarparvar, B.; Romanelli, G. P.; Duchowicz, P. R. J. Biomed. Sci., 2014, 21:84. [ Links ]

18. Soltani, S.; Abolhasani, H.; Zarghi, A.; Jouyban. A. Eur. J. Med. Chem. 2010, 45, 2753-2760. [ Links ]

19. Sahu, N. K;. Sharma, M; Mourya, V.; Kohli, D. V. Acta Poloniae Pharm. Ñ Drug Res. 2012, 69(6), 1153-1165. [ Links ]

20. Gupta, R. A.; Kaskhedikar, S.G. Asian J. Pharm. Clin. Res. 2012, 5(3), 251-259. [ Links ]

21. ChemDraw Ultra 6.0 and Chem3D Ultra version 12.0, Cambridge Soft Corporation, Cambridge, USA. 2010. [ Links ]

22. Spartan 14v1.1.2. Wavefunction, Inc. USA. 2014. [ Links ]

23. Lee, C.; Yang, W.; Parr, R. G. Phys. Rev. B Condens. Matter, 1988, 37(2):785-789. [ Links ]

24. Mikulski, D.; Eder, K.; Molski, M. J. Theor. Comput. Chem., 2014, 13(1), 1-24. [ Links ]

25. Yap, C.W. J. Comput. Chem., 2011;32(7):1466-74. [ Links ]

26. Ballabio, D; Consonni, V; Mauri, A; Claeys-Bruno, M; Sergent, M.; Todeschini, R. Chem. & Intel. Lab. Syst. 2014, 136,147-154. [ Links ]

27. Ambure, P; Aher, R.B; Gajewicz, A.; Puzyn, T. Chemom. Intell. Lab. Syst., 2015, 147, 1-13. [ Links ]

28. Brignole, M. Auricchio, A. Baron-Esquivias, G. Bordachar, P. Boriani, G. Breithardt, O. et al., Eur Heart J. (2013, 34(29),2281-2329. [ Links ]

29. Golbraikh, A.; Tropsha, A. J. Mol. Graph Model., 2002, 20(4), 269-276. [ Links ]

30. Todd, M.M; Harten, P; Douglas, M.Y; Muratov, E.N; Golbraikh, A; Zhu, H.; Tropsha, A. J. Chem. Inf. Model. 2012, 52 (10), 2570-2578. [ Links ]

31. Khaled, K. F.; Abdel-Shafi, N. S. Int. J. Electrochem. Sci. 2011, 6, 4077 - 4094. [ Links ]

32. Mitra, I.; Saha, A.; Roy, K. (2011). Sci. Pharm., 2011, 79, 31-57. [ Links ]

33. Tropsha, A. ; Gramatica, P.; Gombar, V.K.; The importance of being Earnest: validation is the absolute essential for successful application and interpretation of QSPR models. QSAR Comb. Sci., 2003, 22, 69-76. [ Links ]

34. Roy, K; Kar, S.; Das, R.N. Springer Briefs in Molecular Science: Statistical Methods in QSAR/QSPR. 2015, 37-59. [ Links ]

35. Roy, K.; Paul, S. QSAR Comb. Sci. 2008, 28, 406-425. [ Links ]

36. Todeschini, R. Milano Chemometrics. Italy (personal communication), 2010. [ Links ]

37. Pravin, A. Drug Theoretics & Cheminformatics (DTC) Laboratory, Jadavpur University, 2013. [ Links ]

38. Supratik, K.; Kunal, R. Indian J. Biochem. Biophys., 2011, 48, 111-122. [ Links ]

39. Roy, P.P.; Roy, K. QSAR Comb. Sci., 2008, 27, 302-313. [ Links ]

40. Indrani, M; Achintya, S.; Kunal, R. Eur. J. Med. Chem., 2010, 45, 5071-5079. [ Links ]

41. Rudra N.D.; Kunal R. Toxicol. Res. 2012, 1, 186-195. [ Links ]

42. Roy, K.; Mitra, I. Comb. Chem. High Throughput Screening, 2011, 14(6), 450-474. [ Links ]

43. Roy, K. ; Chakraborty, P.; Mitra, I. ; Ojha, P. K.; Kar, S.; Das, R. N. J. Compu. Chem., 2013, 34(12 ), 1071-1082. [ Links ]

44. Tropsha, A. Mol. Inf., 2010, 29(6-7), 476-488. [ Links ]

45. Netzeva, T.I; Worth, A; Aldenberg, T; Benigni, R; Cronin, M.T; Gramatica, P; Jaworska, J.S; Kahn, S; Klopman, G; Marchant, C.A; Myatt, G; Nikolova-Jeliazkova, N; Patlewicz, G.Y; Perkins, R; Roberts, D; Schultz, T; Stanton, D.W; van de Sandt, J.J; Tong, W; Veith, G.; Yang, C. Altern. Lab. Anim., 2005, 33(2), 155-173. [ Links ]

46. Eriksson, L; Jaworska, J; Worth, A.P; Cronin, M.T.D; McDowell, R.M.; Gramatica, P. Environ. Health Persp., 2003, 111, 1361-1375. [ Links ]

47. Nandi, S; Monesi, A; Drgan, V; Merzel, F.; Novič, M. Chem. Cent. J. 2013, 7(171), 1-13. [ Links ]

48. Gramatica, P ; Giani, E.; Papa, E. J. Mol. Graphics Modell., 2007, 25(6), 755-766. [ Links ]

49. Gramatica, P. Chemiometric methods and theoretical molecular descriptors in predictive QSAR modeling of the environmental behavior of organic pollutants. In T. Puzyn et al. (eds.), Recent Advances in QSAR Studies, 2010, 327-366. [ Links ]

50. Sharma, B.K.; Singh, P. Med. chem. 2013, 3, 168-178. [ Links ]

51. Saaidpour, S. Phys. Chem. Res. 2016, 4(1), 61-71. [ Links ]

52. Baumann, K. QSAR Comb. Sci. 2005, 24, 1033-1046. [ Links ]

Received: September 20, 2017; Accepted: February 09, 2018

Creative Commons License This is an open-access article distributed under the terms of the Creative Commons Attribution License