


 texto em
  Inglês (pdf)
 Artigo em XML
 Referências do artigo
 Enviar este artigo por email
 Citado por SciELO
  Similares em
SciELO
Similares em
SciELO 
 Permalink
1. Introduction
Corrosion of reinforcing steel due to the presence of chlorides in concrete generates deterioration of structures exposed to saline environments, putting their functionality and safety at risk, reducing the expected durability. In addition, this problem increases the inspection and maintenance cost or, in many cases, the risk of a collapse of the structure. Galvanic sensors have been used since 1990 as a preventive method against the attack of aggressive agents (Schiessl and Raupach, 1992). Mainly for a wide variety of marine structures, the performance of these sensors (galvanic pair) could detect the moment when the reinforcing steel is depassivated, and corrosion is activated by the presence of aggressive agents. Furthermore, corrosion macrocell sensors (Raupach, 1996) have been used to monitor the corrosion risk of reinforcing steel, strategically placed in the concrete cover zone and difficult access areas, improving service life prediction or expanding the study of durability (Raupach and Dauberschmidt, 2003) as a complement to other protection systems. However, more work needs to be done to obtain evaluations and results with practical applications using other materials, under different study conditions, and where relevant limit values can be determined (Raupach and Schießl, 2001; McCarter et al., 2001). Galvanic corrosion is known as corrosion macrocell; the potentials and currents are measured from the activity between a corroding anode and a passive cathode, where the reduction will be presented (Figure 1). The current recorded measures the corrosion caused by the cathode reduction process, without considering the anode corrosion itself (McCarter and Vennesland, 2004).
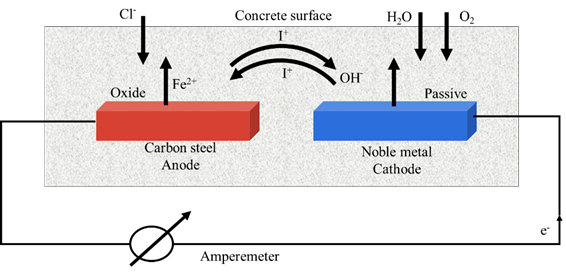
Oxidation and reduction processes must occur in order for the electrochemical corrosion of steel to take place in concrete; where the main reactions (equations 1, 2) are as follows:
Anode:
Cathode:
Corrosion process at the anode involves both reactions, but here the anodic current is higher than the cathodic current. At the cathode, the cathodic current is higher than the anodic current, which forms the corrosion macrocell.
Many factors influence the operation of a corrosion macrocell in concrete, such as the design in the geometric shape and sensors size, the position and placement within the concrete cover area, as well as the separation between the anodes and cathodes, which may cause an increase or decrease of the galvanic current values (Arya and Vassie, 1995). In this study, the influencing factors in the macrocell current signal were examined, such as the ratio of anode/cathode areas, the separation distances within the specimens, and the immersion level (vertical position of the specimens). In addition, variables such as concrete quality, the thickness of the concrete cover zone of reinforcing steel, the monitoring conditions of potentials, and the macrocell currents of sensor electrodes were considered to determine the corrosion mechanism of the system (Raupach and Dauberschmidt, 2003). In addition, we aim to evaluate whether the galvanic macrocell sensors based on 304 stainless-steel can be implemented as an alternative monitoring method to detect corrosion risk within concrete. 304 stainless steel was used because it represents an economical all-purpose material, resistant to corrosion, and with excellent strength and ductility. Also, this steel, embedded in concrete and placed next to the reinforcing steel, can work as an internal detection system in the concrete cover zone. Furthermore, it has the required characteristics of a resistant and easy-to-implement sensor (Llorens et al., 2019), although with another anode/cathode exposed area ratio (galvanic sensor: carbon steel/stainless steel) and with different test conditions (submerged environment). The concrete cover zone was also evaluated where the advantageous working conditions of the sensor are exposed to monitor its corrosion behavior in the presence of chloride ions, which will enter the concrete from the NaCl solution at 5% by water weight.
2. Experimental procedure
2.1 Materials for concrete mix
Two concrete mixtures made according to NMX C155 (2014) were used; ordinary Portland cement OPC 30R (NMX C414, 2004), crushed gravel with a maximum aggregate size of 19 mm (3/4"), fine aggregate with a fineness module of 2.71, drinking water, and water/cement ratio (a/c) of 0.60 and 0.40. The concrete specimens were cured under water for 28 days according to (NMX-C-159-ONNCCE-2004). Mixture proportion of concrete shown in Table 1 was obtained using the ACI-211.1 method (American Concrete Institute, 2002).
2.2 Configuration of the prismatic specimens
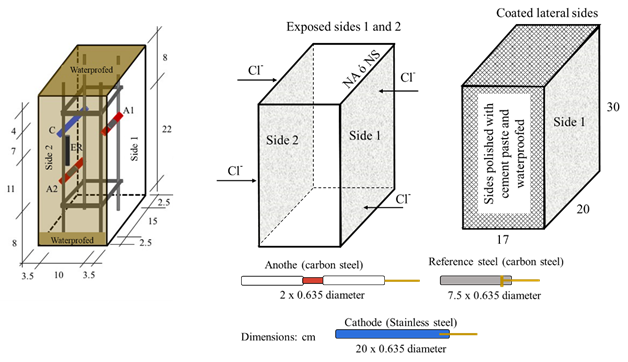
Sixteen prismatic specimens with dimensions of 17 x 20 x 30 cm were made; the longitudinal steel of the steel truss (formed using longitudinal and transversal steel reinforcement) was separated 15 cm parallel to the side 1 and 10 cm perpendicular to side 1 (as indicated in Figure 2). was used with 9.5 mm (3/8”) diameter carbon steel rods and 6.35 mm (¼”) stirrups fastened with tie wire. In each specimen, two sensors were placed next to the reinforcing steel, as shown in Figure 2. The anodes were placed on opposite side of the specimens: on side 1, the anode A1 and on side 2, the anode A2, at a depth of 8 cm and 22 cm in the longitudinal direction, concerning the water level (NA) or 5% NaCl solution (NS). An accessible area for the sensor of 3 cm was considered. The concrete cover for the steel reinforcement on the faces exposed to chloride penetration was 3.5 cm. The area of the faces exposed to chlorides was 20 x 30 cm. In comparison, the lateral sides of the specimens (17 x 20 cm and 17 x 30 cm) were covered with cement polish and solvent-based asphalt waterproofing to restrict the penetration of chlorides (Figure 2). To identify the specimens, they were labeled with the acronym AP143, which corresponds to the number of specimen 1 exposed to tap water (AP1), water/cement ratio of 0.4 (number 4), and reinforcing steel of 9.5 mm (3/8 ") (number 3). For labels with the acronym SM563, refer to specimen number 5 exposed in brine (SM5), water/cement ratio of 0.6 (number 6), and reinforcing steel of 9.5 mm (3/8”) (number 3).
2.3 Sensor system
Sensors were designed as a galvanic cell, consisting of carbon steel (anodes “A”) and stainless-steel electrodes (cathodes “C”), which were isolated from the steel truss using industrial hoses. The reference steel (AR) was left in electrical contact with the reinforcement. Copper wire was used to connect the electrodes (Figure 3), leaving extensions outside the specimen to close the electrical circuit and obtain the measurements through electrical signals. Due to the diameter of the copper wire to that of the electrodes, a representative effect on the values monitored during the test time was not considered. The sensor was fastened to the steel truss using plastic ties. The anode/cathode area ratio was 1:10, corresponding to 4 cm2 for each anode and 40 cm2 for the cathode. A cathode larger area than that of the anode was used to avoid low galvanic currents, especially for stainless steel electrodes, since a similar amount of space between the anode and cathode would have slight effectiveness in detecting corrosion damage of steel in concrete (Zinc-Taek et al., 2005).
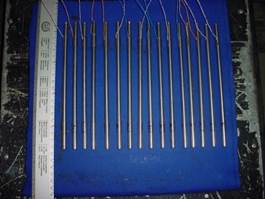
Figure 3 Type 304 Stainless Steel cathodes with copper wire connection, fastened with an industrial hose.
AISI-SAE 1020 (UNS G10200) steel was used as the anode, with the same composition as the steel truss; and type 304 austenitic stainless steel (UNS S30400) as the cathode (Table 2) (AISI-SAE, 1983; Hudok, 1990).
Sensor elemental chemical composition was analyzed with 3.0 g samples extracted from the anode and cathode material. Acid digestion was carried out in the microwave (CEM brand model MDS-200), applying the Still method 0.5 g of each sample was prepared with HCl, HNO3, HF, and HBO3. For elemental analysis, Plasma Emission Spectrometry (ICP-OES, IRIS-AP model), Atomic Absorption Spectrophotometry (FAA AVANTA SIGMA model), and Elemental Analyzer (EA-1110 model) (PROCEDURE LAQ03, 2005) techniques were used. The results of the analysis are shown in Table 2.
Table 2 Elemental chemical composition of the steel for the sensors and the reference electrode
| Elements (%) wt | Cr | Ni | C | Mn | Si | S | P | Fe | Cu | Mo | Co |
|---|---|---|---|---|---|---|---|---|---|---|---|
| Carbon Steel 1020 | 0.041 | 0.027 | 0.198 | 0.429 | ---- | 0.021 | 0.02 | bal | 0.021 | ---- | 0.014 |
| Stainless steel 304 | 17.864 | 7.719 | 0.072 | 2.003 | 0.484 | 0.032 | 0.045 | bal | 0.356 | 0.595 | 0.101 |
2.4 Exposure and monitoring with electrochemical techniques
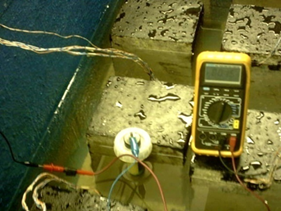
Prismatic specimens were exposed for 18 months in immersion in two environments: tap water (AP) and NaCl solution at 5% by water weight ("SM" brine). During the exposure, it was supervised that the same liquid level was maintained, and the solution was changed every 3 months. The exact number of specimens with a w/c ratio of 0.6 and 0.4 were exposed in AP and SM. Monitoring the macrocell voltage and current in the specimens was carried out using a high impedance multimeter (FLUKE 87 III) through an external short circuit. The corrosion potentials were measured using an external reference electrode of Copper-Copper Sulfate (Cu/CuSO4) or (CSC) (Figure 4).
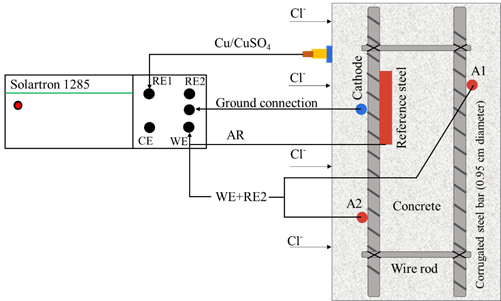
From the tenth month Electrochemical noise technique was used in the specimens immersed in SM for 9 months, due to the activation of the better quality or denser concrete specimens in months 7, 8, and 9 exposed in NaCl solution at 5% by weight of water. The above in order to know the effect of chlorides on the sensors (A1 and A2) and reinforcing steel, using a SOLARTRON 1285 Potentiostat/Galvanostat. This technique allows the detection and evaluation of the behavior of the general and localized corrosion (Dawson, 1996) through the random fluctuations of the potential or the current of the material subject to corrosion against time. The results were visually and statistically analyzed using MATLAB software. The circuit arrangement for monitoring is shown in Figure 5.
2.4.1 Monitoring potentials and currents
Voltages and currents were individually monitored for the anodes A1 and A2 and the reference steel (AR) against the cathode (Figure 6a). Thus, the corrosion potentials were also measured against the Cu/CuSO2 reference electrode, using the reference steel (AR), the anodes (A1, A2), and the cathode (C) as the working electrode (Figure 6b).
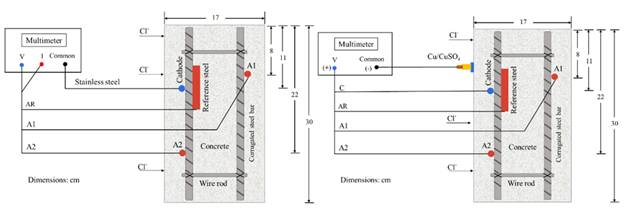
Figures 6a and 6b. Diagrams for monitoring Macrocell Voltages and Currents and Corrosion Potentials.
Analysis of the macrocell voltages against the stainless steel and the corrosion potentials against the Cu/CuSO4 electrode, was carried out following the reference values of the standard (ASTM C 876-91), establishing a reference equivalence of both electrodes (stainless steel and Cu/CuSO4) against the standard hydrogen electrode (NHE) (Table 3). However, the analysis for the macrocell current was carried out according to the information available in the literature since there are no standardized values of the current levels that indicate the risk of corrosion for a reinforced concrete system and embedded sensors.
Table 3 Corrosion potentials vs. Cu/CuSO4 and its equivalence for stainless steel, ASTM C 876-91.
| Corrosion Potential (Ecorr) (mV) | Macrocell voltage (Vcorr) (mV) | Risk of damage (%) |
|---|---|---|
| More positive than -200 | More positive than -95 | 10% corrosion probability |
| Values between -200 a -350 | Values from -95 to -166 | Uncertaint corrosion |
| More negative than -350 | More negative than -166 | 90% corrosion probability |
2.5 Chloride tests
Free chloride content in the concrete specimens was obtained from the pulverized samples extracted from the areas near the anodes and the reinforcing steel 30 g of sample were used and followed the standard procedure (ASTM D 1411-99). The percentages of free chloride ions were calculated against the weight of concrete and cement for the concrete with a w/c ratio of 0.4 and 0.6.
2.6 Simple compression test
Simple compressive strength was determined after 28 days of curing (NMX C159, 2004) according to the ASTM C39-17 procedure (ASTM International, 2017). Three concrete cylinder specimens 15 cm in diameter by 30 cm in length were used for each w/c ratio. Sulfur mortar was used for leveling the cross sections of the cylinders. The simple compression test of the cylinders was carried out with a Universal Electric Hydraulic Press with a capacity of 120 Tons (Model ELVEC), equipped with a Model CT-715H pump. The load application speed was 5.3 kN/s, registering the maximum load until the collapse of the cylinders.
3. Results and discussion
3.1 Macrocell voltages
Macrocell voltages of the A1, A2, and AR anodes immersed in the specimens with a w/c ratio of 0.40, and exposed in AP, were higher than -95mV, representing a low risk of corrosion (Figure 7). For the A1, A2, and AR anodes of the specimens exposed in SM, the voltage values were more negative than -166 mV from month 7, representing a high probability of corrosion (Figure 7). In addition, anode A1 (located at a depth of 8 cm) presented more negative voltage values than anode A2 (located at a depth of 22 cm). Therefore, greater activation of the A1 anodes closer to the immersion surface than the A2 anodes was observed. Although access to oxygen is more restricted or low in wet and submerged concrete, the corrosion values are fundamental. They cannot necessarily be attributed only to the effect of oxygen (Alonso et al., 1998). Unusual behavior was observed in the SMA2 anode, which may be due to the concrete heterogeneity an isolated case not observed with the other electrodes in this work.
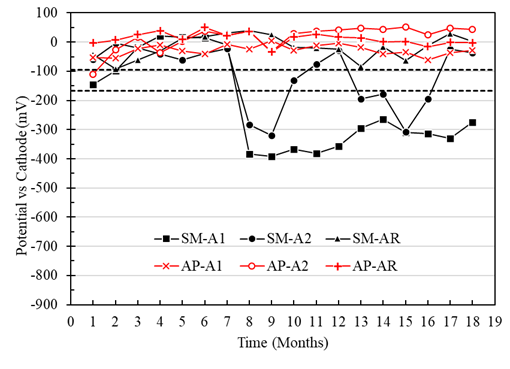
Figure 7 Potential vs. cathode of specimens with a w/c ratio of 0.4 exposed in tap water (AP) and 5% NaCl solution (SM).
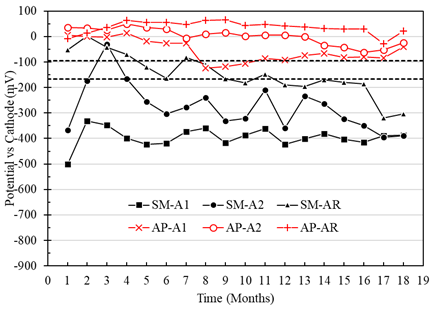
For the specimens with a w/c ratio of 0.60 and exposed in AP, the macrocell voltages of the anodes A1, A2, and AR generally remained in the zone of low probability of corrosion, with values more positive than -95mV (Figure 8). At the same time, the anodes of the specimens immersed in SM presented voltage values more negative than -166 mV, with a trend towards values with a higher probability of corrosion from month 2 of exposure (Figure 8). It was observed that the A1 anode presented greater vulnerability to corrosion than the A2 anode, an effect like that of the beams with a w/c of 0.4 (Figure 7). Particularly for the case of reinforcing steel (SM-AR), a gradual decrease in potential or voltage was observed from the zone of low probability of corrosion to the area of high probability, reaching potentials of -300 mV for months 17 and 18, showing practically the same trend as anodes A1 and A2.
3.2 Corrosion potentials vs CSC (Cu/CuSO2)
Corrosion potentials of the A1, A2 and AR anodes with respect to the CSC electrode in the specimens with a w/c ratio of 0.40 and exposed in AP, were more positive than -200mV (low risk of corrosion) (Figure 9). Nevertheless, the anodes of the specimens exposed in SM reached potential values more negative than -200 mV, with indications of a high probability of corrosion after month 7. It was also observed that the A1 anode presented greater corrosion vulnerability than the A2 anode (Figure 9). This being consistent with the results obtained from the macrocell voltages (Figure 7 and 8). On the other hand, the potentials of the 304 steel used as cathode do not represent a probable risk of corrosion for the exposed specimens in AP and SM, indicating a good performance as a means of implementation for corrosion monitoring of reinforced concrete structures (Figure 8).
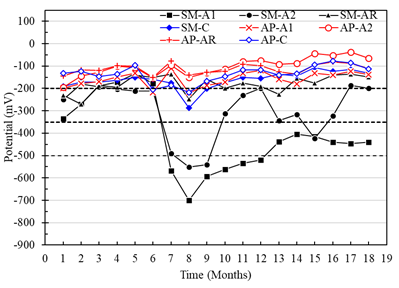
Figure 9 Potential vs. Cu/CuSO4 from specimens with a w/c ratio of 0.4 exposed to drinking water (AP) and 5% NaCl solution (SM).
In the case of the specimens with a w/c ratio of 0.60 and exposed in AP, the corrosion potentials of A1, A2, and AR vs. CSC were greater than -200 mV, with a low probability of presenting corrosion. Meanwhile, the potentials of the anodes in the specimens immersed in SM showed trends from the high probability zone towards severe corrosion from month 2, with values from -300 mV to -700 mV approximately (Figure 10). This same effect was detected across the macrocell voltages (Figures 7 and 8). For the reinforcing steel potentials, a trend towards the high corrosion risk zone was observed, with potentials of up to -600mV for months 17 and 18. While the potential for the cathode in the specimens with a w/c ratio of 0.6 fluctuated in the range of -200 mV to -350 mV, being more evident between months 5 to 10, generally representing a low risk of corrosion.
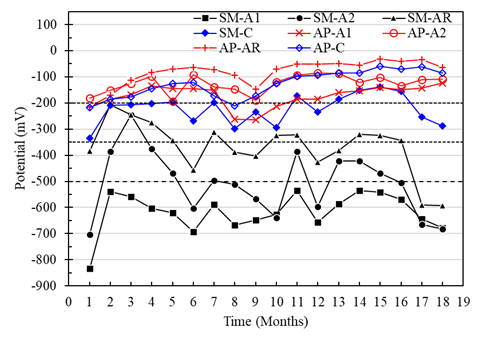
Figure 10 Potential vs. Cu/CuSO4 from specimens with a w/c ratio of 0.6 exposed to drinking water (AP) and 5% NaCl solution (SM).
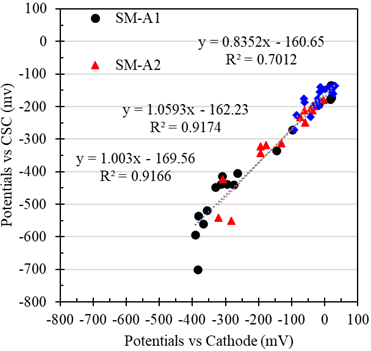
3.2.1 Comparison of potentials vs. cathode and vs. copper sulfate copper electrode (CSC)
Using the data of the potentials or voltages of the previous sections, the comparisons between the potentials vs. the cathode and the CSC is shown in Figure 11, corresponding to the anodes of the test tubes with a w/c ratio of 0.4 exposed in SM. A good correlation of the potentials obtained with different reference electrodes and during the monitoring time could be observed. Therefore, these galvanic sensors can be a viable option for the implementation and corrosion monitoring of reinforced concrete structures.
3.3 Macrocell current densities
In general, the macrocell current densities for the sensors placed in the specimens with a/c of 0.4 exposed to AP showed uniformity between the values within the region considered as negligible corrosion (Figure 12). However, the current densities of sensor A1 exposed to SM specimens were higher from month 6, reaching the values considered as moderate and high corrosion (greater than 0.1 μA/cm2), which also indicates active corrosion. (Figure 12). Although sensor A2 showed activation values from the sixth month, it was not maintained in the subsequent months, generating passivation from month 10. It was observed that sensor A1 of the specimens exposed to SM presented macrocell current values greater than A2, influenced by the depth at which the sensors were located and their oxygen availability. This difference was also observed by measurements of the macrocell voltages and the potentials respecting the CSC electrode.
Difference between the macrocell currents of the sensors A1 greater than A2, both exposed in AP and SM, may be due to the availability of oxygen. Observing that the oxygen diffusion is lower in a submerged environment, the corrosion activity decreases (Table 4). However, it has also been revealed in other studies (Alonso et al., 1998) that even under oxygen scarcity, reduction reactions can occur within the concrete.
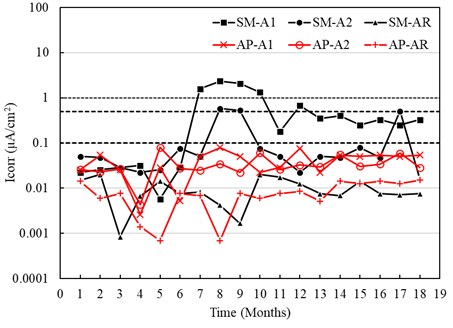
Figure 12 Macrocell current density of the specimens with w/c = 0.4 exposed to tap water (AP) and 5% NaCl solution (SM).
Figure 13 shows the results of the current densities of the sensors placed in the specimens with a w/c ratio of 0.6, exposed to AP and SM. The current values obtained in the anodes A1 and A2 exposed to AP generally indicate negligible corrosion (less than 0.1 μA/cm2), although sensor A1 (placed at 8 cm) showed signs of moderate corrosion from month 6. In the case of sensors A1 and A2 of the specimens exposed in SM, the current values initially led to high corrosion (greater than 1.0 μA/cm2) with a tendency towards moderate corrosion (less than 0.5 μA /cm2) after month 10. On the other hand, it was observed for the two types of mixtures with w/c ratios of 0.4 and 0.6 (Figures 12 and 13) that the current densities for the AR sensors exposed to AP and SM indicate stability and negligible corrosion.
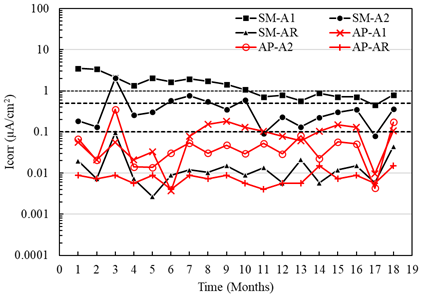
Figure 13 Macrocell current density of the specimens with w/c = 0.6 exposed to tap water (AP) and 5% NaCl solution (SM).
Table 4 Comparison of current density limit values
| Sensor type | Test conditions | Rel. Area: Anode/Cathode | Limit Values | References |
|---|---|---|---|---|
| Steel/Stainless Steel 304 | Submerged 5% NaCl | 01:10 | 3.50μA/cm2 | Pérez et al., 2022 |
| Steel/Copper | Immersion-Gravity 3.5% NaCl | 01:01 | 0.07μA/cm2 | Zink Taek Park, 2005 |
| Steel/Stainless Steel | -0.02μA/cm2 | |||
| Steel/Stainless Steel 1.4301 | Mortar with 3% Cl- added to the wáter in the mix | 01:05 | 5.00μA/cm2 | Elsener, 2002 |
| Steel/Titanium-platinum | Humid and drying | 01:08 | 3.00μA/cm2 | Raupach y Schiebl, 2001 |
| Steel/Stainless Steel 316 | 95% RH and concrete with 3% Cl- | 01:30 | 3.85μA/cm2 | Arya y Vassie, 1995 |
| 01:33 |
In the analysis of the macrocell current intensity (Figure 14), it was possible to determine that the A1 sensors placed at a shallower depth in the specimens exposed to SM presented higher macrocell currents (9 μA and 14 μA for the concrete with a /c of 0.4 and 0.6, respectively) than the A2 sensors located deeper (2.40 μA and 2.00 μA for concrete with a/c of 0.4 and 0.6). According to the first microcell, current intensity values were like those reported in the literature, with galvanic current limit values of 15 μA and 16 μA. However, the difference may be due to the different test conditions, the sensor materials, the anode/cathode area ratios, and the geometric arrangements within the concrete (Raupach and Schiebl, 2001; Elsener, 2002), Table 5.
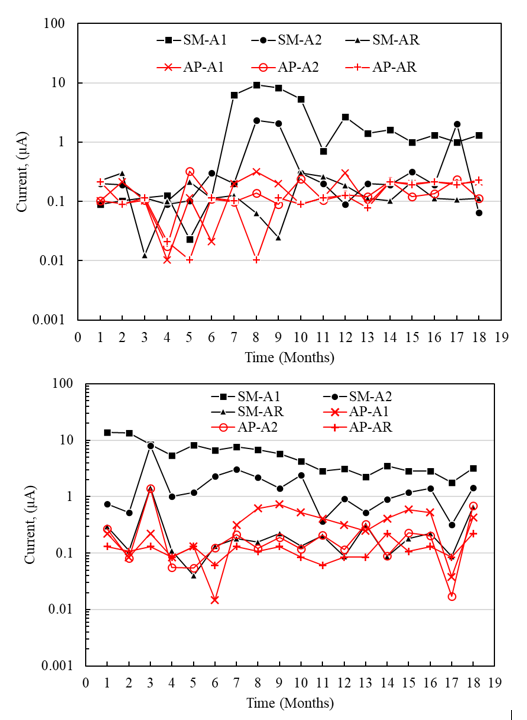
Figure 14 Macrocell current intensity of the specimens with a/c = 0.4 and 0.6 exposed to top water (AP) and 5% NaCl solution (SM).
Table 5 Comparison of current limit values
| Sensor type | Test conditions | Rel. Area: Anode/Cathode | Limit Values | References |
|---|---|---|---|---|
| Steel/Stainless Steel 304 | Submerged in 5% NaCl | 01:10 | 14 μA | Pérez et al., 2022 |
| Steel/Stainless Steel 1.4301 | Mortar with 3% Cl- added to the mix | 01:05 | 16 μA | Elsener, 2002 |
| Steel/Titanium-platinum | Humid and drying | 01:08 | 15 μA | Raupach y Schiebl, 2001 |
3.4 Electrochemical noise
Due to the null activation obtained from the sensors in AP, only the electrochemical noise results of the specimens exposed in SM are shown, and their analysis to determine the type of corrosion of the system. Potential (E) and current (I) data were recorded with 1024 pts at 1 pt/sec.
Figure 15 and Figure 16 show the example graphs of the potential and current density series over time for the A1 anodes immersed in concrete with a w/c ratio of 0.4 and 0.6, respectively. In both concrete mixtures, a behavior correspondence between the potential and current series could be observed, showing random oscillations of the signals with transients of 1.0 mV and 1.0 µA/cm2 on the base signal of the potential and current. This type of behavior was associated with a kind of generalized corrosion.
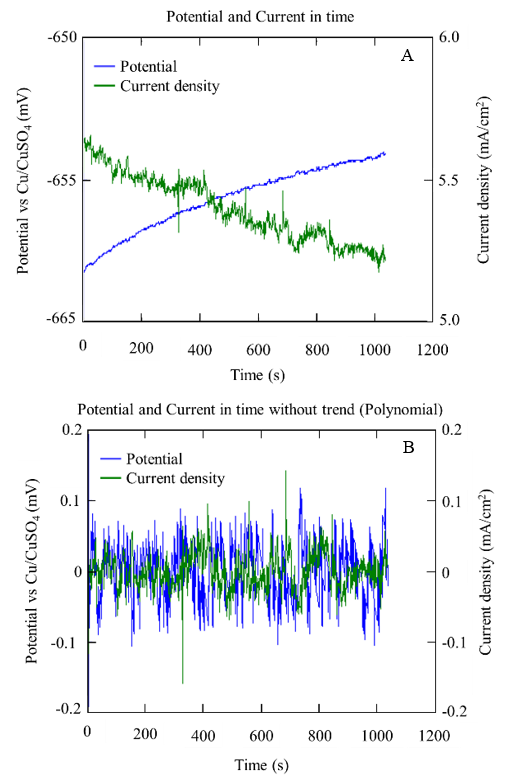
Figure 15 Series of potential and current over time obtained from anode A1 specifically with w/c 0.6, after 10 months in SM: with bias (A) and without bias (B).
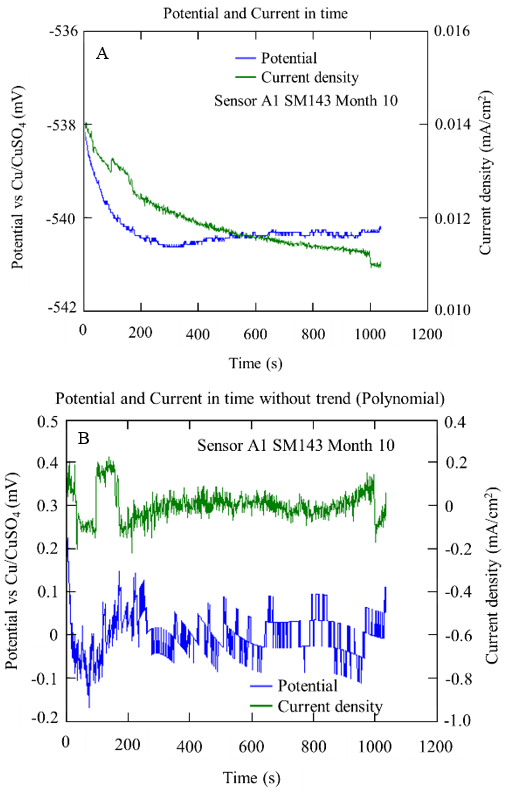
Figure 16 Potential and current series over time obtained from sensor A1 specifically with a/c D0.4, after 10 months in SM: with bias (A) and without bias (B)
Figures 17 and 18 show examples of the spectral densities of the potential and current density of the A1 anodes for concrete with a w/c ratio of 0.6 and 0.4 after 10 months of exposure. These graphs made it possible to determine the slopes with which the corrosion phenomenon in the anodes was evaluated. For this case, steeper slopes were indicative of some corrosion activity.
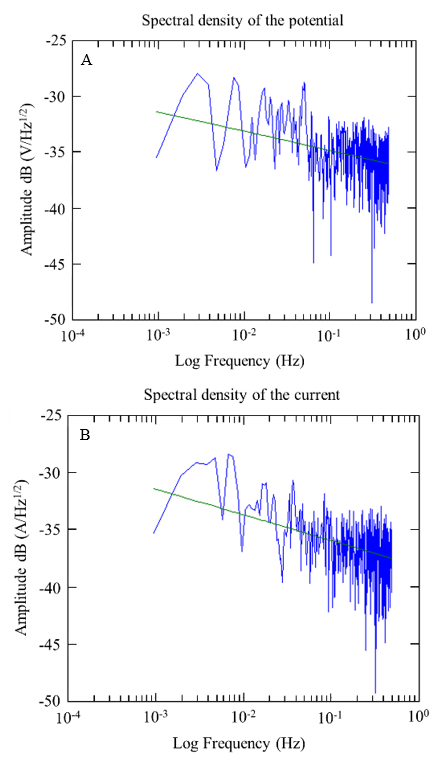
Figure 17 Spectral densities of potentials and currents over time were obtained from the A1 sensor, specifically at w/c 0.6 after 10 months of exposure.
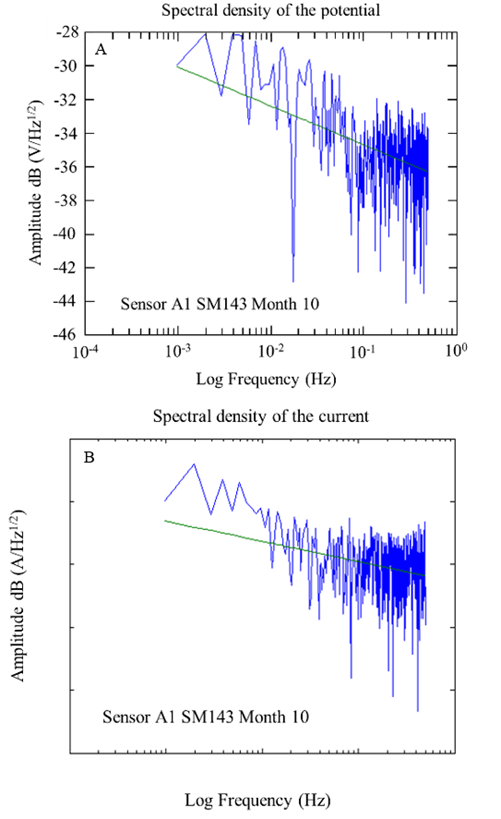
Figure 18 Spectral densities of potentials and currents over time were obtained from the A1 sensor, specifically at w/c 0.4 after 10 months of exposure.
During the 9 months of monitoring the sensors and the reinforcing steel of the 0.4 w/c specimens, the slopes obtained from the potential spectral densities were between -1.72 and -3.76; while for the specimens of w/c 0.6, they were between -2.06 and -3.48. The slopes of the spectral density records of the current of the 0.4 a/c specimens were -0.63 and -4.92, while for the specimens of w/c 0.6, they were between -0.43 and -3.26. As a function of the slope of the frequency spectral densities, these values correspond to a type of uniform corrosion and passivation-uniform (Figures 17 and 18) (Legat and Dolecek, 1995).
With the electrochemical noise records of the test tubes with a w/c ratio of 0.6 and 0.4, a statistical analysis was carried out to determine the resistance, potential, and current data that allowed classifying the type of corrosion in the anodes, which are summarized in Table 6.
The values of the location index (I.L) (Kelly et al., 1996) obtained from the electrochemical noise records of the anodes for month 10 in both qualities of concrete indicate the types of generalized and mixed corrosion (Table 6). For month 18, mixed or hybrid corrosion was observed for both concrete types without exceeding a level greater than unity (>1), where there would be a pitting process in the sensors.
Table 6 Results of the statistical analysis of electrochemical noise and interpretation of the type of corrosion in the anodes of the concrete of w/c 0.6 and 0.4 for months 10 and 18.
| W/C ratio | Electrode - Mes | Rn (Ω-cm2) | Location index, I.L. | Corrosion type | PSD potential (mV) | Corrosion type | PSD corrosion (µA/cm2) | Corrosion type |
|---|---|---|---|---|---|---|---|---|
| 0.40 | A1-10 | 2.35E+04 | 0.0058 | Generalized | -3.76 | Uniform | -1.67 | Uniform |
| 0.40 | A2-10 | 1.92E+04 | 0.0294 | Mix | -3.24 | Uniform | -0.63 | Uniform Passivation |
| 0.40 | AR-10 | 1.26E+05 | 0.0878 | Mix | -1.72 | Uniform | -4.92 | Uniform |
| 0.60 | A1-10 | 1.50E+04 | 0.0048 | Generalized | -2.19 | Uniform | -2.24 | Uniform |
| 0.60 | A2-10 | 1.40E+04 | 0.0046 | Generalized | -2.09 | Uniform | -3.03 | Uniform |
| 0.60 | AR-10 | 2.26E+05 | 0.0406 | Mix | -2.06 | Uniform | -0.43 | Uniform Passivation |
| 0.40 | A1-18 | 1.30E+04 | 0.0325 | Mix | -2.93 | Uniform | -3.98 | Uniform |
| 0.40 | A2-18 | 2.50E+04 | 0.0175 | Mix | -2.00 | Uniform | -1.39 | Uniform |
| 0.40 | AR-18 | 1.26E+05 | 0.0878 | Mix | -1.72 | Uniform | -4.92 | Uniform |
| 0.60 | A1-18 | 1.40E+04 | 0.0246 | Mix | -3.48 | Uniform | -3.26 | Uniform |
| 0.60 | A2-18 | 1.60E+04 | 0.0469 | Mix | -3.38 | Uniform | -2.32 | Uniform |
| 0.60 | AR-18 | 1.40E+04 | 0.0548 | Mix | -2.27 | Uniform | -0.68 | Uniform Passivation |
3.5 Content of free chlorides within the concrete by weight of the cement
Table 7 shows the results of the percentage of chloride ions soluble in water with respect to concrete and cement for the concrete specimens with a w/c ratio of 0.4 and 0.6. For both types of concrete exposed to AP, the amounts of chloride ions were negligible. In the case of the 0.4 w/c specimens exposed to 5% NaCl solution, the percentages of chloride ions were lower than in the 0.6 w/c beams, the latter reaching a value of 0.44% Cl- with respect to cement. This value can be considered an eminent risk of corrosion, according to the values reported in the literature (Mohammed and Hamada, 2001; Alonso, 2001), Table 8; and by the values of macrocell voltages and currents that were monitored in this work, where at 10 months they show values of a high probability of corrosion.
Table 7 Water-soluble chloride ion content of both concrete mixtures
| Mixture | % Cl- with respect to concrete | % Cl- with respect to cement | ||
|---|---|---|---|---|
| Ambient | Tap water | NaCl solution | Tap water | NaCl solution |
| w/c: 0.40 | 0.0000 | 0.0470 | 0.00 | 0.21 |
| w/c: 0.60 | 0.0035 | 0.065 | 0.02 | 0.44 |
3.6 Simple compression test
Table 9 shows the average compressive strength values of three cylindrical concrete specimens for each w/c ratio of 0.4 and 0.6. These stress values are relatively high, related to a slow corrosion process despite being in an aggressive environment in a 5% NaCl solution. These results corroborate that the concretes made with the standard specifications guarantee good quality and are less vulnerable to the entry of aggressive agents.
4. Conclusions
Using galvanic sensors, it is possible to monitor and evaluate the state of risk due to corrosion in reinforced concrete structures because the macrocell voltages of the internal galvanic sensor (carbon steel/stainless steel) presented a good correlation with respect to the corrosion potentials of the external Cu/CuSO4 sensor, during the system test time.
Galvanic sensors can be considered for their implementation as a preventive method in correlation with existing electrochemical techniques because current limit values and current density, like other similar systems, were observed.
The behavior of the stainless-steel reference electrode (cathode "C"), embedded in reinforced concrete, generally maintained its stability against the risk of corrosion by chloride ions during the evaluation stage.
The value of free chlorides found near the sensor at 10 months reached a percentage of 0.44% with respect to the cement, which represents a risk with sufficient probability for the activation of corrosion in the reinforcing steel, this diagnosis being consistent with the macrocell voltage and current measurements, and by values close to those reported in the literature.
The information obtained with the electrochemical noise technique shows that the specimens have a uniform and mixed corrosion on the reinforcing steel and sensors due to the passivation of the system during the formation of the oxides in the exposure time; except for the lower quality specimen, which shows higher signs of corrosion in months 17 and 18, but still does not show localized corrosion.

