


 nova página do texto(beta)
 Inglês (pdf)
 Artigo em XML
 Referências do artigo
 Enviar este artigo por email
 Citado por SciELO
  Similares em
SciELO
Similares em
SciELO 
 Permalink
Introduction
Prunus serotina Erhr belongs to the Rosaceae family [1]. It is a native North American tree, widely distributed in Mexico, commonly called ''capulín" or American black cherry [2, 3]. Medicinal properties are attributed to this species, including expectorant, sedative and antispasmodic effects, among others [2]. "Capulín" fruits are also part of the Mexican diet and are consumed fresh, dried or prepared in jam. The infusion is used as a cough remedy, and it has a phenolic content higher than strawberries [4]. The decoction of P. serotina leaves has beneficial effects for the treatment of hypertension [2]. In one of the first studies of capulín fruit, cyanidin-3-glucoside, cyanidin-3-rutinoside and rutinose were identified by spectral analyses, HPLC and mass spectroscopy [5]. It was also demonstrated that the P. serotina inflorescences and leaves are an excellent source of antioxidants [6]. Additionally, it was found that capulín seed oil contains highly polyunsaturated fatty acids [7]. The antioxidant and antimicrobial activity from polar extracts of P. serotina fruits have been assessed previously, and the results indicated that the ethanolic extract showed the highest antioxidant and antimicrobial effect [8]. The studies of the nutraceutical value and antihypertensive properties of P. serotina fruits suggest that polar extracts may be used to prevent hypertension and to aid in its treatment [9].
Among optimization methods, the Taguchi method makes it possible to design and optimize the product yield or improve the processes. This method can be applied when there are a considerable number of factors and interactions because it provides a smaller number of assays than others [10]. This procedure has been employed to optimize processes such as food quality [11], improvement of the yield of chemical reactions [12], the extraction of flavonoids [13] and the formulation of processes to elaborate nanoparticles [14]. Currently, no optimal extraction conditions, such as the type of solvent and stirring time, have been reported for the extraction of phenolic compounds from the fruits of P. serotina. The objective of this study was to apply the Taguchi method to determine the optimal solvent type and stirring time for phenolic content extraction from capulín fruits.
Experimental
Plant material
P. serotina fruits were hand-harvested in June 2014 in Huejotzingo, Puebla, Mexico. Three servings of seedless fruit, previously crushed, were taken to determine the moisture content according to the AOAC method [15]. The remaining fruit was stored at 40 °C in polyethylene bags until used.
Extract preparation
Portions (100 g) of fresh capulín fruit were ground using a mechanical grinder. A sample of 1.0 g was kept in contact with the test solvents (10 mL), namely, acetone/water (7:3 v/v), methanol/water (4:1 v/v), ethanol/water (7:3 v/v) ethanol/water (4:1 v/v) and ethanol/water (1:1 v/v). Based on literature methodology (8), each sample was adjusted at pH ~3.5 with 5% HCl, and then stirred by vortex for 1 minute at 1000 rpm (Vortex Synergy, WVR International). The sample was then treated under sonication for 15 min at 20 °C, using ice as needed to maintain this temperature (Ultrasonic Cleaner 8890, Cole-Palmer). After that, the samples were shake in an incubator at 130 rpm (Orbital incubators Prendo INO-650 M) for 30, 40 and 50 min. Finally, the samples were sonicated again for 15 min and then filtered.
Total phenolic content
The total phenolic content was assayed using the filtered samples, applying the Folin-Ciocalteau method adapted to microplates [16]. Microplates from 96 wells were used, each containing an aliquot (25 μL) of a suitably diluted sample, 125 μL of deionized water and 20 μL of Folin-Ciocalteau reagent. The mixture was shaken and allowed to stand for 5 min, and then 30 μL of 20 % Na2CO3 solution was added. After incubation for 60 min, the absorbance versus a prepared blank was read at 760 nm in a microplate reader (Synergy 2 Microplate reader, Biotek International, software Gen5). The total phenolic content of dried P. serotina fruit (three replicates) was expressed as milligrams of gallic acid equivalents per gram on a dry weight basis, using a calibration curve with gallic acid. The calibration curve range was 2.5 to 29.0 μg GA mL-1.
Optimization of the extraction process of phenolic content
The treatments to optimize the extraction of phenolic content from capulín fruits are described in Table 1. For the statistical analysis, two controllable factors were considered: solvent ratio and stirring time. Both levels were determined based on previous investigations [8] and complemented by preliminary tests. Taking in account that the capulín extract can be used as a component in a food, it was decided to explore the extraction using ethanol/water mixtures.
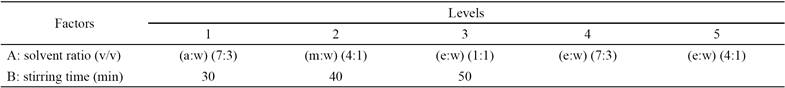
An experimental design with asymmetric factorial arrangement (5X3) was used with three replicates. The statistical model is presented in Equation 1:
Where
 (2)
(2)
y = Phenolic content expressed in mg GAE
nr = number of replications of the treatment
Equation 2 was applied to maximize the response variable [17]. This transformation maximizes the signal above the noise and has been denominated as "the larger the better". SNLij is the effect of the i th level of time, of the j th level of solvent; μ = general mean; timei = time to the ith level, i= 1,..., 3; solventj = solvent to the jth level, j = 1, ..., 5; eij = error of the ith level of time, of the jth level of solvent. In this case, the objective of the process is to reach the maximum value, and therefore the maximum values obtained by SNL are the optimal ones [18].
To find the optimal levels of the factors evaluated (solvent and stirring time), the average of each run was first obtained. The SNL values were obtained by substituting the average of each run into Equation 2. The values calculated according to the experimental design (SNL ) and the average of the response variable (y) are presented in Table 2. For ANOVA, the SAS package version 9.1 was used (SAS Institute Inc., Cary, NC, USA).
Table 2 Orthogonal arrangement of the experimental design and response variables: y, SNL .
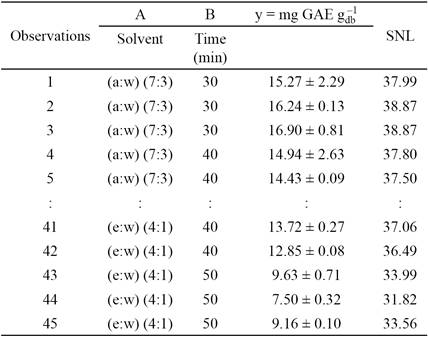
a: acetone; w: water; m: methanol; e: ethanol.
Equation 3 describes the general production model for the significant factors [19].
Where
Optimal ŷ = result of phenolic content expressed in mg
Fnm = factor n at level m
y = average of the runs
For the prediction of the optimal value, the confidence interval was defined by Equation 4:
Where
F (n 1 * n 2) = value of F for the degrees of freedom n1 and n2, with a confidence level of 0.05, obtained from the table for the F distribution [20].
n 1 = degrees of freedom (d. f.) of the mean (always equal to 1)
n 2 = d. f of the error
Ve = variance of the error
Ne = number of equivalent replicates, defined by Equation 5
Results and discussion
Phenolic content
The average moisture content of the capulín fruits was 73.00 ± 0.05 %, lower than reported for fruits of Prunus avium L [21]. The Box and Whiskers diagram of the phenolic content is shown in Fig. 1. The phenolic content among the extracts ranged from 8.0 to 18 mg GAE
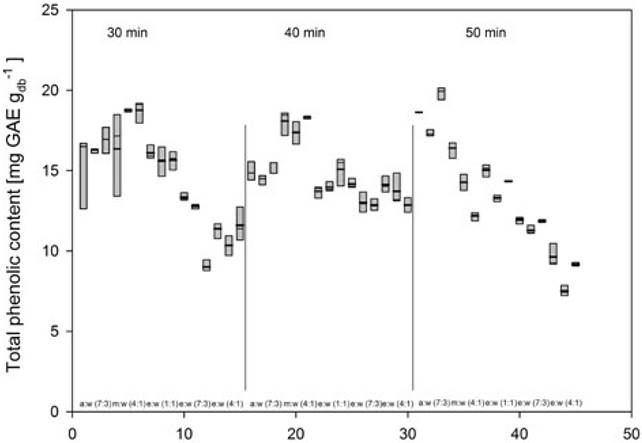
Fig. 1 Box and Whiskers diagram of GAE content in treatment extracts. a:w= acetone:water; m:w= methanol:water; e:w = ethanol:water.
Effect of the solvents and stirring time in the extraction of phenolic content
Tables 3 and 4 present an analysis of variance (ANOVA) for the experimentally obtained data (y) and the values calculated from Equation 2 (SNL). Both the factors evaluated and their interaction were significant (p < 0.05). In the case of the response variable (y), the transformation "larger is better" does not identify the significant signals of the noise existing in each run. However, when the variable is transformed SNL, it is possible to detect the differences among the factors. The model used to identify the factors and significant interactions is presented in Equation 1.
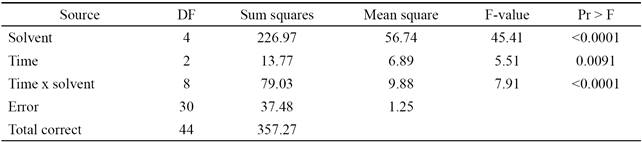
Table 4 Analysis of variance of the response variable SNL.
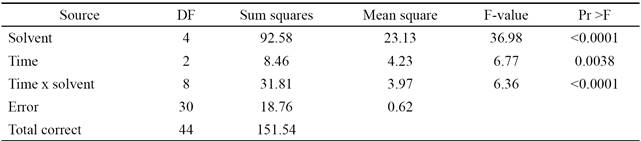
SNL = Values calculated using Equation 2.
Fig. 2 shows the behavior of the mean SNL of the levels of each factor, as well as their interactions. There was no significant difference among the amount of phenolic content extracted with acetone:water (7:3, v/v), methanol:water (4:1, v/v), and ethanol:water (1:1, v/v). This set of treatments was statistically significantly different from the extracts obtained with ethanol:water (7:3 and 4:1, v/v), however, which had lower yield.

Fig. 2 Effects of the principal factors in SNL units. Means with different letters are significantly different (Tukey; P ≤ 0.05). a:w = acetone:water; m:w= methanol:water; e:w = ethanol:water.
With respect to the stirring time, there was no significant difference between 30 and 40 min, and the lowest yield of phenolic content was obtained when the stirring time was increased to 50 min. Although only slightly lower, the 50 min value presents a statistically significant difference compared to the treatments for 30 and 40 min. This result could be explained by the effect of prolonged exposure to light and the extraction time on phenolic compounds stability [23, 24]. Fig. 3 shows significant interaction (p ≤ 0.05) between the factors solvent ratio and stirring time.
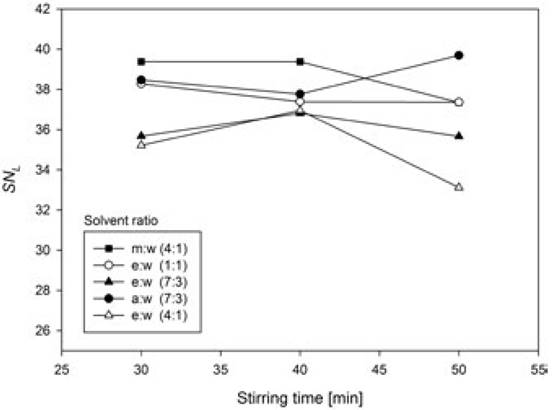
Fig. 3 Interaction of principal factors in SNL units. a:w = acetone:water; m:w = methanol:water; e:w = ethanol:water.
Table 5 presents the maximum values of the optimal levels of extraction of phenolic content. The optimal value in terms of the experimentally calculated values (y) was obtained with Equation 6 derived from Equation 3.

By substituting the significant values of the phenolic content extraction into Equation 6, the maximum level that can be obtained under optimal conditions was found.
To calculate the confidence interval (CI), Equation 4 was used, and by substituting the values of the confidence interval at 95%, the following results are obtained:
Where
F (n 1 * n 2) = F0.05n 1 = 1 n 2 = d. f. of the error.
Ve = mean squared error, 1.25, Ne = 45/15(14 g.1. + 1).
The values F and Ve were calculated as a function of the ANOVA of the experimentally obtained data, as presented in Table 1. To estimate the optimal ŷ, the significant factors in the analysis of variance corresponding to SNL (Table 2) were considered, given that SNL maximizes the signal and minimizes the noise.
Total phenolic content analysis
The general mean of the yield of phenolic content was 14.28 mg GAE
In this case, although the total phenolic content obtained using acetone:water (7:3, v/v), ethanol:water (1:1, v/v) and methanol:water (4:1, v/v) were statistically equal, the test was performed using acetone:water (7:3, v/v) because it gave the numerically highest yields, with a stirring time of 30 minutes. For the quantification of phenolic content under optimal conditions (acetone:water (7:3, v/v), 30 min stirring), a yield of 20.13 mg GAE
The optimal value obtained in this study for phenolic content was higher than the values reported for juices of different cultivars of ripe raspberry (13.82 ± 1.66 mg GAE
Conclusions
The Taguchi method made it possible to determine the optimal conditions for the extraction of phenolic compounds from capulín fruit (P. serotina). These conditions were an acetone:water (7:3, v/v) mixture and a stirring time of 30 min. The optimal yield was 20.13 ± 0.86 mg GAE

