


Services on Demand
Journal
Article
 text in
  English (pdf)
 Article in xml format
 Article references
 Send this article by e-mail
Indicators
-
 Cited by SciELO
 -
 Access statistics
Related links
-
 Similars in
SciELO
Similars in
SciELO
Share

 Permalink
Revista mexicana de ciencias pecuarias
On-line version ISSN 2448-6698Print version ISSN 2007-1124
Rev. mex. de cienc. pecuarias vol.12 n.2 Mérida Apr./Jun. 2021 Epub Nov 15, 2021
https://doi.org/10.22319/rmcp.v12i2.5466
Technical notes
Prediction of the fermentative quality of sunflower silage by near-infrared reflectance spectroscopy (NIRS) on oven-dried samples
a Centro de Investigacións Agrarias de Mabegondo de la Axencia Galega da Calidade Alimentaria de la Consellería do Medio Rural. Xunta de Galicia, Mabegondo, Abegondo, A Coruña, Galicia, España.
b Universidad Autónoma del Estado de México, Instituto de Ciencias Agropecuarias y Rurales. Toluca, Estado de México, México.
c Laboratorio Interprofesional Galego de Análise do Leite, Mabegondo, Abegondo, A Coruña, Galicia, España.
The objective of the present work was to evaluate the predictive ability of calibration equations developed by NIRS (near-infrared reflectance spectroscopy) on dry and ground samples for estimating the fermentative quality of sunflower silage. NIRS spectra of a total of 52 oven-dried and ground silage samples from different laboratory silo tests carried out at the Mabegondo Agricultural Research Center (Centro de Investigacións Agrarias de Mabegondo, CIAM) were registered. The fresh samples were analyzed using reference methods. The pH, lactic acid, acetic acid, ethanol, ammonia nitrogen and soluble nitrogen levels were determined. NIRS calibrations were developed by modified partial least squares regression, performing a regression between spectral and reference data. The predictive capacity of the equations obtained ranged from excellent to good, with cross-validation coefficients of determination (r2 cv) equal to or above 0.88. The RPD index values for all the parameters studied were equal to or above 3.0; therefore, the calibration equations obtained on dry and ground samples can be used satisfactorily to predict the fermentative quality of sunflower silages in routine analyses.
Key words Forage crops; Fermentation parameters; Reflectance spectroscopy
El objetivo del presente trabajo fue evaluar la capacidad de predicción de las ecuaciones de calibración desarrolladas mediante NIRS (espectroscopía de reflectancia en el infrarrojo cercano) sobre muestras secas y molidas, para estimar la calidad fermentativa de ensilados de girasol. Un total de 52 muestras de ensilados procedentes de diferentes ensayos de silos de laboratorio realizados en el CIAM (Centro de Investigacións Agrarias de Mabegondo), cuyo espectro NIRS se registró sobre muestras secas en estufa y molidas. Las muestras en estado fresco fueron analizadas por métodos de referencia. Se determinó el pH, ácido láctico, ácido acético, etanol, nitrógeno amoniacal y nitrógeno soluble. Las calibraciones NIRS fueron desarrolladas utilizando regresión por mínimos cuadrados parciales modificada, realizando la regresión entre los datos espectrales y los de referencia. La capacidad predictiva de las ecuaciones obtenidas osciló entre excelente y buena, mostrando coeficientes de determinación de validación cruzada (r 2 vc) iguales o superiores a 0.88. Los valores del índice RPD para todos los parámetros estudiados fueron iguales o superiores a 3.0, por lo tanto, las ecuaciones de calibración obtenidas sobre muestras secas y molidas pueden utilizarse satisfactoriamente para predecir la calidad fermentativa de ensilados de girasol en análisis de rutina.
Palabras clave Forrajes; Parámetros de fermentación; Espectroscopía de reflectancia
The nutritional evaluation of forages is relevant due to the high variability of their nutritional value and to their high contribution to the total dry matter of cattle rations, compared to concentrate. In addition to the intrinsic characteristics of the forage at the time of cutting, the nutritional value of the silage is fundamentally conditioned by the quality of fermentation developed during storage in the silo1, being highly variable depending on forage ensilability and post-harvest treatment2, and particularly affecting the nitrogen value and the voluntary intake of silage3. Therefore, for an efficient use of silage, its fermentative quality must be first characterized, for which it is essential to have fast, accurate and reliable methods. Instrumental analyses for determining the fermentative quality parameters of silage are complex, time-consuming and costly.
NIRS (Near-Infrared Reflectance Spectroscopy) technology is widely recognized as a fast, inexpensive and highly accurate analytical technique for characterizing the keeping quality of silage as an alternative to wet analysis4. Moreover, it is an environmentally clean technology that uses no reagents and generates no waste. NIRS analysis of silage in intact mode, in its fresh state, involves great difficulty, due to the high heterogeneity of the material5. On the other hand, the presence of water in the intact sample interferes with the NIRS spectrum, since it absorbs part of the infrared radiation, generating two very significant absorption bands in the spectrum. However, it should be noted that NIRS analysis of dried samples has disadvantages compared to analysis with fresh samples, because the volatile constituents of silage, such as fermentation acids, alcohols and ammonium, are released and lost during the drying process of the sample. In one study, a series of samples before and after the drying process were determined by reference methods, and the prediction of the NIRS equations developed on dry samples were compared with those performed on wet material. As a result, it was observed that the prediction of pH, lactic acid and ammonia nitrogen was more robust on dry material, while the quality of the prediction for acetic acid was better when the NIRS measurement was performed on the wet sample6. This is attributed to the fact that the quality of prediction obtained for the different parameters by the two methods is not related to the losses during the drying of the samples, since the reduction in the concentration of lactic acid, acetic acid, ethanol and ammonia nitrogen in the dry matter during drying was 3.5, 57, 53 , and 100 %, respectively, for grass silage, and 3.5, 83, 16, and 100 % for corn silage, in clear correspondence with their volatility (free version)6.
On the other hand, another study evaluated the effect of a corn silage sample preparation (fresh vs. dry and ground) on the estimation of fermentation parameters by NIRS. The results indicate that fresh samples provide a slightly higher predictive ability for acetic acid (r2 cv = 0.85 vs 0.82) and lactic acid (r2 cv = 0.78 vs 0.73), and a lower predictive ability for pH (r2 cv = 0.54 vs. 0.63)7. A study carried out at the Mabegondo Agricultural Research Center (Centro de Investigacións Agrarias de Mabegondo, CIAM) in Galicia indicates the convenience of using dry and ground samples instead of intact ones, by obtaining predictive models of the chemical composition and fermentative quality of grass silage with higher accuracy8. In another work recently carried out at CIAM, the prediction of fermentation parameters of grass silage was evaluated by means of NIRS calibrations, developed on dry and ground material; the results obtained were satisfactory, with determination coefficients equal to or above 0.809. The knowledge of the fermentative quality of new types of forages in a fast and accurate way requires progress in the development of new NIRS calibrations. In this sense, the objective of the present work was to evaluate the predictive capacity of NIRS calibration equations in dry and ground samples to estimate fermentative quality parameters of sunflower silage.
The work was carried out with a total of 52 sunflower silage samples from different laboratory silo trials conducted at CIAM in 2016 and 2017. The collection of samples covers a high variability in terms of maturity stage, including sunflower samples harvested at different phenological stages according to the Schneiter and Miller scale, from stage R4 (1 wk before flowering) to stage R7 (5 wk after the beginning of flowering)10. The forage used for filling the laboratory silos came from the cultivation of two commercial hybrids: a forage variety (Rumbosol 91) and an oil variety (ES Shakira), grown on CIAM's experimental farms located in two locations in Galicia (Spain): Mabegondo (in the northwestern Atlantic coastal area of Galicia, at 100 masl) and Pobra de Brollón (an inland area of Galicia, at 400 m asl). In addition, the trials included silage without additives and with different additives: formic acid and two commercial inoculants (one based on homofermentative lactic acid bacteria, and the other, on homo- and heterofermentative lactic acid bacteria).
The laboratory silos were opened 60 d after they were filled. The silage samples, after manual homogenization, were divided into two aliquots, one of which was dried in an oven at 80 ºC for 16 h11, while the other was frozen at -18 ºC; both were vacuum-packed in hermetically sealed plastic containers until fermentative analysis was performed using reference methods. The spectral information of the dried and ground samples at 1 mm was obtained in a Foss NIRSystem 6500 monochromator spectrophotometer (Foss NIRSystem, Silver Spring, Washington, USA), located in a temperature-controlled room (24 ± 1 °C) and equipped with a spin module that performs reflectance (R) measurements in the spectral region between 400 and 2,500 nm, at 2 nm intervals. Absorbance data are expressed as Log (1/R, R= Reflectance). The spectra collection and chemometric analysis of the data was carried out using Win ISI II v.1.5 software (Infrasoft International, Port Matilda, PA, USA)12. Using the CENTER algorithm13, a Principal Component Analysis (PCA) was performed, followed by the calculation of distances between spectra in an n-dimensional space through the Mahalanobis distance, which allowed studying the structure and spectral variability of the population and detecting anomalous samples13. The Global Mahalanobis distance (GH) is defined as the distance between a sample and the center of the population in the space defined by the PCA (Figure 1), considering as outlier samples those with GH values above 3 (spectral outlier)13.
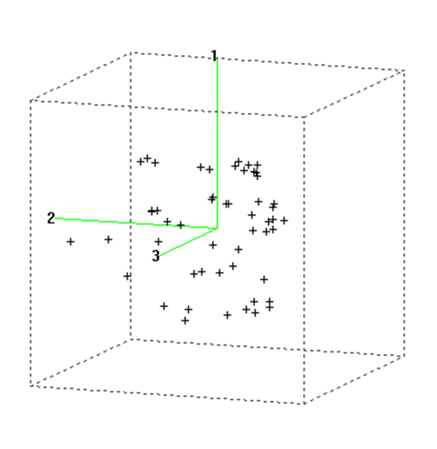
Figure 1 Three-dimensional representation of spectral data of samples according to the global Mahalanobis distance
SNV-Detrend pretreatment was applied to the spectral data14 in order to correct for the scattered radiation phenomenon and the following eight mathematical treatments were evaluated: 1,5,5,1; 1,6,4,1; 1,10,5,1; 1,10,10,1; 2,5,5,1; 2,6,4,1; 2,10,5,1; 2,10,10,1. The first digit expresses the order of the derivative (1= first derivative, 2= second derivative); the second digit indicates the size of the segment on which the derivative is performed (interval expressed in nanometers); the third and fourth digits indicate the size of the intervals, expressed in nanometers, used for the signal smoothing calculation15.
The development of the calibration equations was performed by modified partial least squares regression (MPLS)16 between spectral and reference data, including four cross-validation groups to prevent overfitting, which were used sequentially to perform the validation of the generated equations.
Fermentative analysis of intact silage samples was performed by reference methods, in duplicate17. On an extract of 50 g of fresh silage sample, macerated at room temperature for 2 h in 150 ml of distilled water, pH, ammoniacal nitrogen (N-NH3) was determined with a selective electrode (Orion) and soluble nitrogen (sol-N) by macro Kjeldahl digestion. Fermentation acids (lactic, acetic, and propionic) and ethanol were determined by gas chromatography (Agilent Technologies, USA) with a BR-SwaxAcids high polarity capillary column (30 m x 0.53 mm x 1 µm; Bruker, USA). N-NH3 and sol-N parameters referred to total nitrogen, and fermentation acids and ethanol, to dry matter.
The statistics used to select the best calibration equations were the standard errors of calibration (SEC) and standard errors of cross-validation (SECV) and the coefficients of determination (r2 c and r2 cv) obtained in the calibration and cross-validation process, respectively18. In addition, other useful statistics were utilized to evaluate the predictive capacity of the calibration equations obtained, such as the RER index, or the ratio between the range of the reference data and the SECV, and the RPD index, or the ratio between the standard deviation of the reference data and the SECV19.
The descriptive characteristics (range, mean, and standard deviation) of the fermentation parameters of the calibration collective are shown in Table 1; they exhibit a wide range and a high standard deviation for each of the components analyzed using reference methods. This high variability confirms that this group is made up of very diverse silages, a key factor for obtaining robust calibration equations20. The mean value (and range of variation) of the dry matter content of the silage population that made up the calibration set was 16.0 % (11.3 to 21.9 %).
Table 1 Range, mean, and standard deviation of fermentative quality parameters of the calibration group (n=52) of sunflower silage
| Parameter | Range | Mean | SD | |
|---|---|---|---|---|
| pH | 3.55 | 4.29 | 3.91 | 0.21 |
| Lactic acid, %DM | 0.00 | 15.74 | 7.99 | 5.51 |
| Acetic acid, %DM | 0.52 | 4.04 | 2.39 | 1.10 |
| Ethanol, %DM | 0.90 | 12.50 | 3.78 | 3.43 |
| N-NH3, %TN | 2.21 | 10.37 | 6.09 | 2.59 |
| Soluble N, %TN | 26.96 | 52.95 | 41.41 | 7.68 |
DM= dry matter; N-NH3= ammonia nitrogen; TN= total nitrogen; SD= standard deviation.
Table 2 shows the statistics of the calibration equations obtained for the prediction of fermentation quality parameters. The coefficients of determination in the cross-validation process (r2 cv) provide information on the quality of the calibration, based on which three levels of accuracy of the prediction models have been defined: r2 cv values above 0.90 indicate excellent predictive ability; r2 cv values between 0.89 and 0.70 indicate that the calibration is considered to have good quantitative predictive ability, and calibrations with r2 cv values between 0.69 and 0.50 allow only adequate discrimination between high, medium and low values21. Therefore, the r2 cv values for pH (r2 cv =0.98), N-NH3 (r2 cv =0.96), acetic acid (r2 cv =0.94), lactic acid (r2 cv =0.90), and ethanol (r2 cv =0.90) parameters indicate an excellent predictive ability, while the soluble N content (r2 cv =0.88) exhibits a good accuracy ability21. The accuracy of the prediction can be judged according to the values of the RER and RPD indexes19; RPD values above 3 and RER values above 10 are taken as indicators of the usefulness of the predictions19. The high standard deviation and the wide range of variation of the calibration collective account for the adequate RPD (3.0 - 6.5) and RER (9.0 - 22.8) values obtained.
Table 2 Statistics of the calibration equation developed for the prediction of fermentative quality parameters of sunflower silage
| Parameter | MT | SEC | r2c | SECV | r2cv | RER | RPD |
|---|---|---|---|---|---|---|---|
| pH | (1,5,5,1) | 0.02 | 0.99 | 0.03 | 0.98 | 22.8 | 6.5 |
| Lactic acid, %DM | (2,10,10,1) | 1.63 | 0.91 | 1.75 | 0.90 | 9.0 | 3.2 |
| Acetic acid, %DM | (2,10,5,1) | 0.17 | 0.97 | 0.25 | 0.94 | 13.9 | 4.3 |
| Ethanol , %DM | (2,6,4,1) | 0.97 | 0.92 | 1.07 | 0.90 | 10.9 | 3.2 |
| N-NH3, %TN | (2,10,10,1) | 0.44 | 0.97 | 0.54 | 0.96 | 15.1 | 4.8 |
| Soluble N, %TN | (2,10,10,1) | 2.18 | 0.92 | 2.58 | 0.88 | 10.1 | 3.0 |
DM= dry matter; MT= mathematical treatment; N-NH3= ammonia nitrogen; TN= total nitrogen; SEC= standard error of calibration; SECV= standard error of cross validation; r2 c and r2 cv: coefficient of determination in calibration and cross validation; RER= Range/SECV; RPD= standard deviation/SECV.
The prediction equations for pH, acetic acid, ethanol, N-NH3 and sol-N exhibit values of RPD>3 and RER >10, in compliance with those recommended in the literature19. Thus, the pH value is the most accurately estimated one (RER=22.8; RDP=6.5), followed by the values for acetic acid (RER=19.5; RDP=4.3), N-NH3 (RER=19.5; RDP=4.3), ethanol (RER=10.9; RDP=3.2), and sol-N- (RER=10.1; RDP=3.0). In the case of the lactic acid prediction equation, the value of the RER index (9.0) did not reach the recommended value; however, the RPD value (3.2) exceeds the minimum value recommended in the literature19. Therefore, the values of the RER and RPD statistics confirm the high accuracy and precision of the equations obtained, ensuring their validity from the point of view of their application in quantitative analysis19.
There is little information in the literature on the applicability of the NIRS technique for predicting the pH of forage sunflower silage22. A work carried out with a group similar to the present work ―a collection of 50 dry and ground samples of experimental sunflower silage― exhibited a lower predictive capacity for pH estimation than the present work, with lower values of r2 cv (0.86), RER (5.9), and RPD (2.5), and higher values of SECV (0.44)22. Other studies, carried out on fresh samples, have obtained a lower predictive capacity for the pH value than the one determined in this work, with r2 cv values of 0.85, 0.72, and 0.78 for grass silage4, barley silage23, and ryegrass silage24, respectively.
The lactic acid, acetic acid, and ethanol content in fresh grass silage samples were determined with a lower precision than that observed in this study, with r2 cv and RPD values of 0.83 and 2.5, 0.73, and 2.0, and 0.77 and 2.8, respectively25. Values of r2 cv and RPD of 0.89 and 3.3 for sol-N, and of 0.92 and 4.0 for N-NH325 ―similar to those obtained in this study― have been reported for grass silage.
Once the prediction models have been developed, the fit of the data to the model must be evaluated, for which purpose a chart of the values predicted by NIRS versus the reference values is used. Figure 2 shows such a chart for the fermentation quality parameters studied. The results obtained exhibited a high correlation between the values predicted by NIRS and the reference values for all the parameters studied, with values for the coefficient of determination (R2) of the regression above 0.90, while the values of the slope of the regression ranged between 0.98 and 1.01, confirming the high precision of the equations developed, with values close to 1 in both cases26.
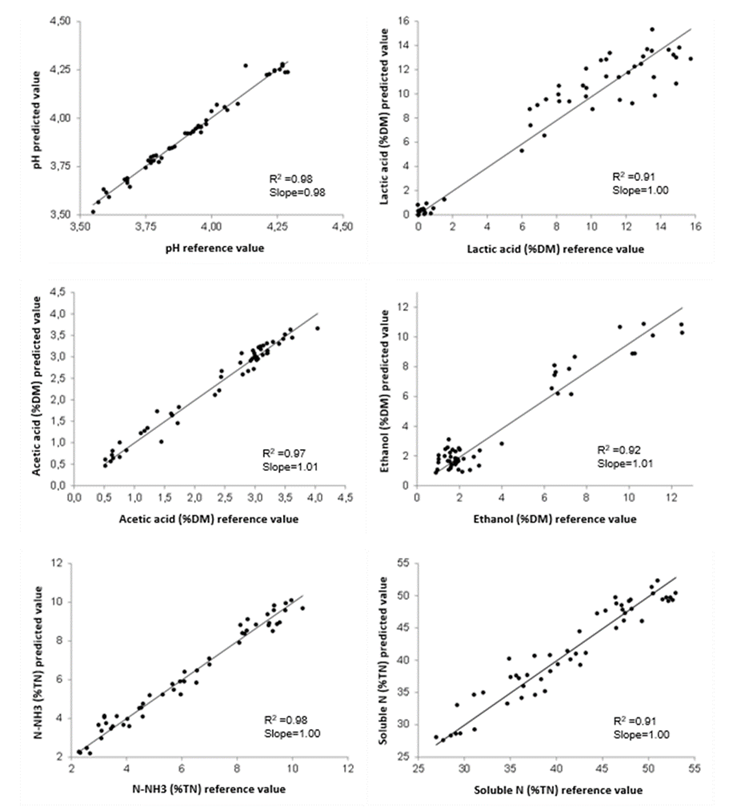
The reference values of the studied parameters are distributed among all concentration ranges and in a very broad range of variation. In the case of lactic acid concentration, the analytical reference values show a very broad range of variation, but they are not distributed among all concentration ranges (Figure 2), with most of the samples in the range between 6 and 15.7 % DM, and only a small number of samples between 0 and 2 % DM. These low lactic acid contents are related to the application of formic acid to the silages27.
This work should be considered preliminary as it is based on a limited number of samples, and it is desirable to increase the database in future studies18. It is advisable to incorporate new representative samples, with values distributed among the least represented sectors, mainly for the lactic acid content; increasing the number of samples of the calibration group will reinforce and increase the robustness of the developed models18.
The authors conclude that NIRS technology, applied to dry and ground samples, is a useful and appropriate tool for the prediction of fermentative quality parameters of sunflower silage, and, therefore, an alternative for determining these parameters in relation to conventional analytical methods.
Acknowledgments and conflicts of interest
This work was funded by projects ATT 2016/106, ATT 2017/180 and 2017/182 of the Ministry of Rural Affairs of the Xunta de Galicia (Consejería del Medio Rural de la Xunta de Galicia). The authors thank the National Council for Science and Technology of Mexico (Consejo Nacional de Ciencia y Tecnología) for awarding mixed grants to Sainz-Ramírez, Plata-Reyes, Gómez-Miranda, and González-Alcántara, and postdoctoral fellowships to Prospero-Bernal. The authors declare that they have no conflicts of interest.
REFERENCES
1. Demarquilly C. Composition chimique, caractéristiques fermentaires, digestibilité et quantité ingérée des ensilages de fourrages: modifications par rapport au forage vert initial. Annales de Zootechnie 1973;(22):1-35. [ Links ]
2. McDonald P. Silage fermentation. In : Forage Conservation in the 80´s. E.G.F. Occasional Sympossium nº 11. British Grassland Society. Brighton, Reino Unido. C. Thomas 1979:67-75. [ Links ]
3. Woolford MK. The silage fermentation. Nueva York, EEUU. Marcel Dekker, Inc. 1984:350. [ Links ]
4. Park RS, Agnew RE, Gordon FJ, Barnes RJ. The development and transfer of undried grass silage calibrations between near infrared reflectance spectroscopy instruments. Anim Feed Sci Technol 1999;(78):325-340. [ Links ]
5. Givens DI, De Boever JL, Deaville ER. The principles, practices and some future applications of near infrared spectroscopy for predicting the nutritive value of foods for animals and humans. Nutr Res Rev 1997;(10):83-114. [ Links ]
6. Sorensen LK. Prediction of fermentation parameters in grass and corn silage by near infrared spectroscopy. J Dairy Sci 2004;(87):3826-3835. [ Links ]
7. Park R, Agnew E, Porter M. Recent developments in methods to characterize the chemical and biological parameters of grass silage. In Park R, Stronge M. editors. Silage production and utilization. Proc XIV Int Silage Conf, a satellite workshop of the XX Int Grassland Cong. Belfast, Northern Ireland: Wageningen Academic Publishers; 2005:109-119. [ Links ]
8. Castro P. Use of near infrared reflectance spectroscopy (NIRS) for forage analysis. Lowland and grasslands of Europe: Utilization and development. Corporate Document Repository. FAO- Food And Agriculture Organization Of The United Nations, Rome, Italy. 2002. http://www.fao.org/DOCREP/006/AD236E/ad236e14.htm . Accessed July 1, 2019. [ Links ]
9. Pereira-Crespo S, Fernández-Lorenzo B, Resch C, Valladares-Alonso J, González L, Dagnac T, et al. Predicción de la calidad fermentativa de ensilados de hierba mediante NIRS sobre muestras secas y molidas. Pastos y Forrajes en el siglo XXI. Palma de Mallorca, España, Sociedad Española para el Estudio de los Pastos. 2015:161-167. [ Links ]
10. Schneiter AA, Miller JF. Description of sunflower growth stages. Crop Sci 1981;(21):901-903. [ Links ]
11. Castro P. Efecto de tres temperaturas de secado sobre la composición química de forrajes y heces. En: Consejería de Agricultura, Ganadería y Desarrollo Rural Ed. Actas de XXXVI Reunión Científica de la SEEP. La Rioja, España: Sociedad Española para el Estudio de los Pastos. 1996:365-368. [ Links ]
12. WIN ISI 1.5. ISI WINDOWS. Near-Infrared Software, The Complete Software Solution for Routine Analysis, Robust Calibration and Networking, Port Matilda, PA, USA. ISI (Infrasoft International), LLC, 2000. [ Links ]
13. Shenk JS, Westerhaus MO. Population definition, sample selection, and calibration procedures for near infrared reflectance spectroscopy. Crop Sci 1991;(31):469-474. [ Links ]
14. Barnes RJ, Dhanoa MS, Lister SJ. Standard normal variate transformation and Detrending of near infrared diffuse reflectance spectra. Appl Spectroscopy 1989;(43):772-777. [ Links ]
15. Shenk J, Westerhaus M. Routine operation, calibration, development and network system management manual. Silver Spring, MD, USA NIRS Systems Inc, 1995. [ Links ]
16. Martens H, Naes T. Multivariate calibration by data compression. In: Williams P, Norris K. editors. Near-infrared technology in the agricultural and food industries. St. Paul, Minnesota, USA. American Association of Cereal Chemists. 1987:57-88. [ Links ]
17. Stern M, Endres M. Laboratory manual: Research techniques in ruminant nutrition. Department of Animal Science. Minnesota, USA. University of Minnesota. 1991. [ Links ]
18. Shenk JS, Westerhaus MO. Analysis of agriculture and food products by Near Infrared Reflectance Spectroscopy. USA: Monograph, NIR Systems Inc. MD, USA. Silver Spring, 1995. [ Links ]
19. Williams PC, Sobering DC. How do we do it: a brief summary of the methods we use in developing near infrared calibrations. In: Davies AMC, Williams P. editors. Near Infrared Spectroscopy: The future waves. Chichester, England, United Kingdom: NIR Publications; 1996:185-188. [ Links ]
20. Shenk JS, Westerhaus MO. Population structuring of near infrared spectra and modified partial least squares regression. Crop Sci 1991;(31):1548-1555. [ Links ]
21. Shenk JS, Westerhaus MO, Calibration the ISI way. In: Davies AMC, Williams P. editors. Near Infrared Spectroscopy: The future waves. Chichester, England, United Kingdom, NIR Publications; 1996:198-202. [ Links ]
22. Fassio A, Gimenez A, Fernandez E., Vaz Martins D, Cozzolino D. Prediction of chemical composition in sunflower whole plant and silage (Helianthus annus L.) by Near Infrared Reflectance Spectroscopy. J Near Infrared Spec 2007;15(3):201-207. [ Links ]
23. Park H, Hoon Lee S, Cheol Lim Y, Seo S, Choi K, Hea Kim J, et al. Prediction of the chemical composition of fresh whole crop barley silages by Near Infrared Spectroscopy. J Kor Grassl Forage Sci 2013;33(3):171-176. [ Links ]
24. Park H, Hoon Lee S, Choi K, Cheol Lim Y, Hea Kim J, Won Lee K, et al. Prediction of the chemical composition and fermentation parameters of winter rye silages by Near Infrared Spectroscopy. J Kor Grassl Forage Sci 2014;34(3):209-213. [ Links ]
25. Park RS, Agnew RE, Gordon FJ, Steen RWJ. The use of near infrared reflectance spectroscopy (NIRS) on undried samples of grass silage to predict chemical composition and digestibility parameters. Anim Feed Sci Technol 1998;72(1):155-167. [ Links ]
26. Shenk JS, Westerhaus MO, Abrams SM 1989. Protocols for NIRS calibration: monitoring analysis results and recalibration. In Near Infared Reflectance Spectroscopy (NIRS): Analysis of forage quality. Marten GC, Shenk J, Barton FE editors. USDA. ARS. Agriculture Handbook Nº 643, Washington, USA. 1989:104-110. [ Links ]
27. Sainz-Ramírez A, Botana A, Pereira-Crespo S, González-González L, Veiga M, Resch C, et al. Efecto de la fecha de corte y del uso de aditivos en la composición química y calidad fermentativa de ensilado de girasol. Rev Mex Cienc Pecu 2020;11(3):620-637. [ Links ]
Received: August 23, 2019; Accepted: April 18, 2020
 Este es un artículo publicado en acceso abierto bajo una licencia
Creative Commons
Este es un artículo publicado en acceso abierto bajo una licencia
Creative Commons
