


Services on Demand
Journal
Article
 text in
  English (pdf)
 Article in xml format
 Article references
 Send this article by e-mail
Indicators
-
 Cited by SciELO
 -
 Access statistics
Related links
-
 Similars in
SciELO
Similars in
SciELO
Share

 Permalink
Revista mexicana de ciencias agrícolas
Print version ISSN 2007-0934
Rev. Mex. Cienc. Agríc vol.9 n.1 Texcoco Jan./Feb. 2018
https://doi.org/10.29312/remexca.v9i1.850
Articles
Spatial simulation of Claviceps gigantea (Fuentes, of the Isla, Ullstrup and Rodríguez) in the State of Mexico
1Facultad de Ciencias Agrícolas y Geografía-Universidad Autónoma del Estado de México. Toluca, México. AP. 5020. (sakua_02@hotmail.com; irita_3@hotmail.com; davinn@hotmail.com; rob_m@live.com.mx; xantonion@uaemex.mx).
The cultivation of corn in Mexico is one of the most important highlighting the High Valleys of Mexico, in this region the main problem of cultivation are diseases, mainly those that cause ear rot which decreases yield and represents large economic losses. One of these diseases is caused by the fungus Claviceps gigantea which is commonly known as horsetooth. This disease can invade the whole cob, preventing the formation of grain. In recent years, climatic conditions have favored the proliferation of this fungus in farms cultivated with corn Zea mays L. The present work was carried out in plots of one hectare of five municipalities of the State of Mexico, with the natural incidence of the fungus during three growing cycles (2013-2015) using geostatistical techniques and performing the conditioned and unconditioned simulation process to predict the spatial behavior of the disease over time. The results show that the simulation techniques used to predict the behavior of Claviceps gigantea are an effective tool to prevent the infestations produced by this fungus. This type of study aims to help the development of integrated management programs.
Keywords: corn; fungal disease; horse tooth; simulation
El cultivo de maíz en México es uno de los más importantes destacando los Valles Altos de México, en esta región la principal problemática del cultivo son las enfermedades, principalmente las que originan la pudrición de la mazorca lo que disminuye el rendimiento y representa grandes pérdidas económicas. Una de estas enfermedades es causada por el hongo Claviceps gigantea que comúnmente se conoce como diente de caballo. Esta enfermedad puede invadir toda la mazorca impidiendo la formación de grano; en los últimos años, las condiciones climáticas han favorecido la proliferación de este hongo en predios cultivados con maíz Zea mays L. El presente trabajo se llevó a cabo en parcelas de una hectárea de cinco municipios del Estado de México, con la incidencia natural del hongo durante tres ciclos de cultivo (2013-2015) usando técnicas geoestadísticas y realizando el proceso de simulación condicionada y no condicionada para predecir el comportamiento espacial de la enfermedad a través del tiempo. Los resultados muestran que las técnicas de simulación usadas para predecir el comportamiento de Claviceps gigantea, son una herramienta eficaz para prevenir las infestaciones producidas por este hongo este tipo de estudio pretende ayudar a la elaboración de programas de manejo integrado.
Palabras clave: diente de caballo; enfermedad fúngica; maíz; simulación
Introduction
The fungus C. gigantea causes the disease called horse tooth that affects corn in the High Valleys of Mexico and as reported by Fucikovsky and Moreno (1971) can reduce the yield by 50%. White (1999) the dispersion is carried out through the air or possibly by some insects that can be found consuming the honey produced by this fungus by the same author, in 2003 he reported that this disease is not spread by insects.
The sclerotium that this fungus generates is elongated in the form of a coma of up to 8 cm. long and two in diameter, at the beginning you can find a soft white mass that over time hardens and changes to a purple color of this sclerotium emerge several stromas up to 5.8 cm long, capitated, globose where they are immersed perithecia. From these perithecium, filiform, hyaline and accepted ascospores emerge (Fuentes, 1964). Sclerotia can be maintained for more than one crop cycle in the soil while maintaining its viability.
Fucikovsky and Moreno (1971), indicate that the development of the fungus is favored by temperatures of 13-15 °C and high precipitation (1 000 mm per year), conditions that coincide with the annual average temperatures of the State of Mexico (INEGI, 2015). This disease has been reported in several municipalities of the State of Mexico, such as Calimaya, Villa Victoria, Metepec, Almoloya of Juarez, among other municipalities. No control is applied to prevent the spread of the disease (CIMMYT, 2015).
For this reason, authors such as Campbell and Benson (1994) point out that correct control is linked to the knowledge of the spatial distribution of diseases. Oliver and Webster (1991) and Isaaks and Srivastava (1988), mention that geostatistics allows to characterize the spatial distribution of a microorganism in a spectrum of scales and multiple directions; In addition, according to Sciarretta et al. (2001); Bloom and Fleischer (2001); Speight et al. (1998), state that geostatistical methods provide a more direct measure of spatial dependence, since they take into account the two-dimensional nature of the distribution of organisms and allow the elaboration of highly useful maps forming gradients of the intensity of the disease. It is possible to establish distribution maps and their percentage of infection, which allows generating economic savings and reducing environmental risks by directing the control alternatives to the specific areas where the disease occurs.
The works carried out with respect to simulation are few, Lantuejoul (1997) points out that simulation methods have played a relevant role in the application of geostatistics. It is a tool introduced by Matheron, who since 1970 introduced in his courses at the school of mathematics Fontainebleau these theories about simulation, which were developed in various studies by Journel, who in 1974 published a study on the conditioned simulation of mineral deposits using the method of rolling bands in third dimension, in this study you can find the bases of the conditioned simulation applied to metallurgy.
Another example of the application of unconditional simulation methods is the work on the modeling of hydrogeological reservoirs carried out in 1995 and 1993 applying the rolling band method in the first case and the Gaussian multidimensional stochastic simulation method in 1993. In all previous works, simulation models have proven to be efficient to predict the presence or absence of certain phenomena, and that may be applicable in precision agriculture.
C. gigantea is considered of low economic importance for government institutions, but the producers say that the disease represents serious losses of up to 90%, due to the fact that grain production is significantly reduced, which is in accordance with that of Warham et al. (1999) who mentions the economic losses in the cultivation of corn caused by this fungus C. gigantea are very severe, as well as the total decrease in grain quality. C. gigantea replaces healthy grains with sclerotia that affect grain yield.
Little is known about this disease, so there is a great lack of information on the behavior of the disease, and its spatial distribution, which is why it is important to generate references that explain the behavior of the fungus within the plots where it occurs, since with these tools it is possible to address accurately the control measures in the corn crop. Additionally, we find geostatistical techniques that can be adapted in agriculture for the prevention and control of this disease; this is how spatial simulation is a process that is carried out through the use of two techniques: 1) classical geostatistics; and 2) conditioned simulation. The first uses point and block kriging, having as main advantage, the use of the information contained in the semivariogram, the maps of the estimated values are optimal, in the sense that the best possible linear estimate is obtained.
On the other hand, conditioned simulation is a technique for generating random fields that locally reproduces the available information, while at the same time globally accounting for the observed variability. This type of interpolation also takes as a basis the semivariogram, but, unlike what happens with the kriging, it does not carry out an estimation, but it does a simulation.
The objective of this work was to make use of geostatistical techniques as a tool to obtain representative values of the incidence of C. gigantea of the corn in Valles Altos of México, and to simulate the behavior of this disease in the study plots. For the study, annual samplings were carried out in crops of the cycles (2013-2015). With the data obtained, the behavior of the disease was evaluated, observing if its behavior was determined by the disease or external agents; annual evaluations were made to know the performance of the disease was progressive in each locality studied.
Materials and methods
For the development of this work, a database collection was obtained, obtained from field samplings in Zea mays L corn plots, which presented damages due to the disease. In the cultivation cycles (2013-2015) in five plots of municipalities in the State of Mexico (Almoloya of Juárez Calimaya, Metepec, Ocoyoacac and Villa Victoria) in November, samplings were carried out when the crops were about to be harvested. The area under study consisted of plots of one hectare each, using the transect method, quadrants of 10x10 m2, within each quadrant 10 plants were selected at random to know the presence or absence of the disease as well as the degree of severity. At each intersection, its georeference was defined, for which a model Trex Vista HCx2007 navigator was used.
Geostatistical analysis. The procedure performed with the sampling data and its geographical location consisted of: 1) estimation of the experimental semivariogram; 2) estimation of the parameters of the semivariogram model; and 3) estimation of the surface (maps) using points (estimated) from the kriging. The experimental semivariogram was estimated with data collected on the incidence of the disease in the five municipalities sampled. This semivariogram was adjusted to a theoretical model (spherical, Gaussian or exponential) through the Model program of Variowin 2.1. (Software for spatial data analysis in 2D, Spring Verlag, New York, USA).
The estimation of the parameters of the semivariogram model was made when estimating the experimental semivariograms, corresponding to each sampling of the C. gigantea population, adjusting to some theoretical semivariogram. With this nonparametric procedure, a sampling value is eliminated and the geostatistical interpolation method called kriging is used, together with the semivariogram model to be validated, to estimate the value of the variable of interest at said sampling point, starting from the remaining sample values. This process is carried out successively in all sampling points (Isaaks and Srivastava, 1989).
In order to know the degree of relationship between the corresponding data, the level of spatial dependence was established, which was obtained by dividing the nugget effect between the plateau and expressing its result as a percentage. If the result is less than 25%, the level of spatial dependence is high; if it is between 26 and 75% the level of spatial dependence is moderate, and if it is greater than 76% the level of dependence is low (Cambardella et al., 1994). Once the models of the corresponding semivariograms were validated, the geostatistical method called ordinary kriging was used to obtain the corresponding estimations, based on what was established by Samper and Carrera (1996) for the elaboration of the maps and to obtain the estimation of the density of C. gigantea at points where the presence of the fungus was not counted. Finally, the infested surface of the elaborated maps was established, using the Surfer 9.0 program. (Surface Mapping System, Golden Software Inc. 809, 14th Street, Golden, Colorado 80401-1866, USA).
Geostatistical simulation. The stochastic geostatistical simulation methods try to reproduce versions of reality while preserving their basic statistics and known spatial variability from the available information (measured points). This approximation is not fulfilled by the estimation methods in which its objective is the spatial inference of the measured characteristics of the variable. The estimated value is the most probable value of the property to be studied and there is a coincidence between the model and the reality at the measured points, but there is no coincidence of its statistics (histogram) or its spatial variability (variogram) as a consequence of the effect of smoothing that is introduced into the estimation process itself. (Delgado, 2007).
The choice of the simulation method must be carried out according to what was proposed by Deutsch (1994) who takes into account the calculation time, the information available for the conditioning process, the precision and accuracy required to the probabilistic prediction that we wish to raise. Thus, simulation constitutes techniques to imitate the functioning of real systems or processes through computer programs. In order to study the system it is usually necessary to make some assumptions about the way of operating; these hypotheses constitute a model that is nothing more than a simplified representation of a system that is constructed to study its behavior.
With the base information (georeferenced data, semivariograms and maps) we proceeded to make the simulation maps, the data base of 2014 was used as year zero, to proceed to the simulation of the year 2015 and its verification of the runs in the field, this through the program GS + Geostatistics Software, procedure: 1) a self-correlation analysis known as: analysis of variography which results in a spatial self-similarity represented as a variogram; 2) adjustment of the variogram, finding the curve that best describes the behavior of the object of study and which helps us to predict the locations without sampling through kriging or conditional simulation, with this we obtained unbiased and unbiased estimates of the property to through the sampled area; and 3) use of temporary data (temperature, humidity, precipitation, ear severity) to help the program to interpolate over time, optimally and obtain simulation maps.
Results and discussion
The use of geostatistical techniques allowed us to model and illustrate the behavior of C. gigantea using the maps obtained by the kriging method during the three cultivation cycles detailed, as well as the simulation methods conditioned to factors such as temperature and humidity, as well as the simulation. Unconditioned allowed to assertively predict the behavior of the disease.
During the sampling, it was observed that the plots with the highest incidence of C. gigantea were those located in municipalities such as Calimaya, Almoloya of Juárez and Villa Victoria, which presented an infestation of up to 93%. In all the plots studied, the highest densities of C. gigantea of the fungus occur at the edges of the plots, since the wooded areas that delimit the plots favor the presence of the fungus by moisture accumulation information that is corroborated with studies carried out by (Moreno et al., 2016). Where they used a cold treatment (4 °C) for 3 months, the humidity of the residual carbon and the temperature change at 22 - 24 °C for 2 months simulate the natural conditions of the field where the sclerotia are found, facilitating their germination (Figure 1-10). A similar situation was reported by Ferguson and collaborators in 2000, in their work on the distributions of larvae and adults of Ceutorhynchus assimilis found an aggregate type distribution and these aggregation centers were located from the edges towards the center of the plot and never reached infest 100% the parcels studied.
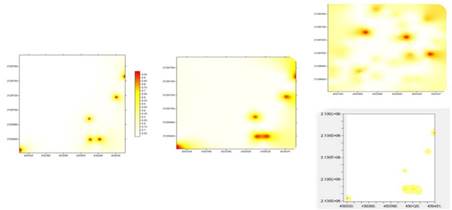
Figure 1 Map of density of C. gigantea of corn in the municipality of Ocoyoacac obtained cycle 2013-2014. Left, maps obtained by simulation for 2014 under conditioned simulation on the upper right and not conditioned on the lower right.
The models to which the presence of C. gigantea was adjusted in the plots during the three years of sampling were mostly attached to Gaussian models, this indicates that the disease occurs constantly within the corn plots and year with year can be seen the progress of the disease in adjacent corn plots, with these representations through the maps and based on the observations it is inferred, that the environmental factors (humidity and temperature) favor the proliferation of C. gigantea, the spherical models show us through maps more focused areas where the centers of aggregation are random but with great manifestation of horse teeth, this may be due to the areas of greater accumulation of sclerotia or to that the temperature conditions are adequate for a greater proliferation of the disease.
The high spatial dependence allows us to suppose that the soldier populations depend on each other and their level of aggregation is high Rossi et al. (1992) which implies that there is a stable distribution within the plot as indicated by the work carried out by Jiménez and collaborators in 2013 who determined that the eggs of thrips that affect the tomato of shell present an infection of continuous form within the plot, inferring the existence of several factors that intervene in the dissemination of females to oviposit, in this work, it was observed that the populations of thrips eggs are distributed in an aggregate form within the plot.
The value of the nugget in all cases was zero, which succeeded in determining a spatial structure of aggregate type and together with the low values obtained from the variance of the data, it reflects that the sampling scale chosen for carrying out the work was the adequate, which is corroborated with studies conducted by Ramírez and González (2006); Ramírez and Porcayo (2010); Sánchez, (2011); Solares et al. (2011); Rossi et al. (1992); in all cases, lower pip values were observed. The level of spatial dependence was determined as established by Cambardella et al. 1994, in all cases, the result is zero, which indicates a high dependency as Ramírez and Porcayo (2010) in the work done in dwarf mistletoe in the northern slope area of the Nevado of Toluca National Park. In carrying out the statistical adjustment, no difficulties were reported as reported by Gutiérrez (1970) in his analysis of the effect of dwarf mistletoe parasitism on the development of two pine species on the Telaron hill in the State of Mexico.
According to the data shown in Table 1, horse tooth populations are grouped in more than one aggregation center within each of the plots in the different sampling dates, a situation that is confirmed in Figures 1, 2, 3 , 4 and 5, where you can clearly see the different aggregation centers of C. gigantea, in the same way we can see that the disease increases or decreases each year, this is because in plots like Calimaya, Villa Victoria The materials used in the planting are the same each year, which increases the susceptibility of the disease. Mechanized harvesting makes the disease proliferate by leaving more sclerotia in the plots, unlike what happens in the Metepec and Ocoyoacac plots. where the plots are still harvested manually and creole materials are planted that have shown greater resistance to the disease, in the case of Almoloya of Juárez, despite the fact that a is not mechanized, factors such as the use of susceptible hybrids annually cause the disease to proliferate further.
Table 1 Models to which the semivariograms were adjusted by municipality and year of sampling Claviceps gigantea and estimation of the infested surface in five municipalities of the State of Mexico.
| Municipality | Year | Model | Nugget | Sill | Range | Nugget/ Sill | Spatial dependence | Sample media | Incidence C. gigantea (%) |
| Almoloya de Juárez | 2013 | Gaussiano | 0 | 0.77 | 1.83 | 0 | High | 0.225 | 42 |
| 2014 | Gaussiano | 0 | 0.65 | 18.2 | 0 | High | 2.01 | 89 | |
| 2015 | Esférico | 0 | 0.72 | 19.78 | 0 | High | 0.984 | 65 | |
| Calimaya | 2013 | Esférico | 0 | 1.08 | 14.64 | 0 | High | 1.92 | 81 |
| 2014 | Gaussiano | 0 | 0.79 | 15.96 | 0 | High | 2.09 | 91 | |
| 2015 | Esférico | 0 | 0.828 | 19.53 | 0 | High | 1.13 | 93 | |
| Metepec | 2013 | Gaussiano | 0 | 0.33 | 11.56 | 0 | High | 0.38 | 32 |
| 2014 | Gaussiano | 0 | 0.05 | 9.35 | 0 | High | 0.06 | 26 | |
| 2015 | Gaussiano | 0 | 0.062 | 25 | 0 | High | 0.092 | 23 | |
| Ocoyoacac | 2013 | Gaussiano | 0 | 0.39 | 11.76 | 0 | High | 0.383 | 36 |
| 2014 | Gaussiano | 0 | 0.02 | 14.4 | 0 | High | 0.05 | 38 | |
| 2015 | Gaussiano | 0 | 0.756 | 11.9 | 0 | High | 0.08 | 31 | |
| Villa Victoria | 2013 | Esférico | 0 | 0.12 | 12.84 | 0 | High | 0.125 | 62 |
| 2014 | Gaussiano | 0 | 0.70 | 11.53 | 0 | High | 0.5 | 62 | |
| 2015 | Gaussiano | 0 | 0.828 | 11.2 | 0 | High | 0.814 | 41 |

Figure 2 Map of density of C. gigantea of corn in the municipality of Ocoyoacac obtained cycle 2014-2015. Left, maps obtained by simulation for 2015 under conditioned simulation on the upper right and not conditioned on the lower right.
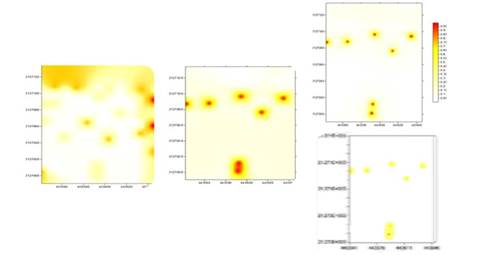
Figure 3 Map of density of C. gigantea of corn in the municipality of Metepec obtained cycle 2013-2014. Left, maps obtained by simulation for 2014 under conditioned simulation on the upper right and not conditioned on the lower right.

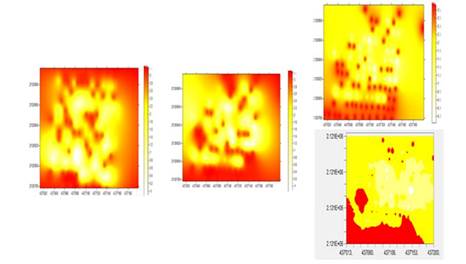
Figure 4 Map of density of C. gigantea of corn in the municipality of Metepec obtained cycle 2014-2015. Left, maps obtained by simulation for 2015 under conditioned simulation on the upper right and not conditioned on the lower right.

Figure 5 Map of density of C. gigantea of corn in the municipality of Villa Victoria obtained cycle 2013-2014. Left, maps obtained by simulation for 2014 under conditioned simulation on the upper right and not conditioned on the lower right.
The value of the plateau for the case of all the samplings was found within a range that ranged between 0.02 and 1.08. In the case of the range, it is the distance between which there is spatial dependence between the sampled points, I oscillate between 1.83 m (Mina México) and 25 m (Metepec) which allows explaining the aggregation types of C. gigantea, in the different study areas, cross validation statistics allowed to validate the semivariogram models, these analyzes showed a high level of spatial dependence for the five study plots.
The value of zero in the nugget effect is permanent in the five plots, this is an indication that the sampling error was minimal and that the sampling scale for each study area was correct. Rong et al. (2006) (Table 1).
To corroborate the severity of the infection that made this disease within the plots, the calculation of the infested surface was carried out based on the density maps obtained from the samplings made during the three cultivation cycles, the greatest infection was observed in the municipality of Calimaya, since in at least 93% of the evaluated surface, sclerotia are found generating infection, and the severity of the infection has reached the economic threshold of production.
Another of the plots with greater severity is located in the municipality of Almoloya of Juárez, specifically in the area known as Mina México, in this plot an infested area of up to 89% was determined for the second year of sampling and as shown in the Table 1, the smallest affectation was 42% in this locality, this in the 2013 cycle, due to the environmental conditions presented during that crop cycle. Situation similar to what happened with the infested area in the municipality of Villa Victoria, which decreased 62% in 2013 to 41% in 2015. In the case of the Municipality of Metepec, the percentage of infection was reduced during the sampling. In the municipality of Ocoyoacac, during the three samplings, the infested area varied between 31% and 38% but the maximum incidence was an ear infested with sclerotia and although it was found in more than 30% of the plot, its severity was minimal compared to the severity of the plot located in Calimaya.
During the three samplings, it was possible to observe in all the municipalities, that the infection follows the same pattern of development, and according to the observations that were made in the field from sowing to harvest, being in this time of sampling, it can be said , that the infestation is carried out during the spring this because the sclerotium happens in the soil approximately a period of 6 months under conditions of low temperatures and in spring it has the ideal conditions of high temperature and humidity for the proliferation of the disease.
In all the study plots it is observed that the development of the disease occurs inside the ear, infecting the ovules without fertilizing and secretes a type of “honeydew” that is probably a source of inoculum for other plants this through insects, because the necessary knowledge of the biologicalcycle of the disease is not yet available, it becomes more complex to be able to determine exactly the biotic and abiotic factors that are involved, then the projections obtained for the years 2014-2015 are presented, which are centered in values obtained from climatic variables that may be intervening in the disease.
Municipality of Ocoyoacac it was observed that the incidence was on the right part of the map for the first two years of sampling, while for the year 2015 an incidence distributed to the center of the plot was recorded (Figure 1). 2014-2015, the aggregation centers were found in the lower right part of the map to a greater extent. The simulation 2013, the conditioned simulation was the closest to reality (Figure 2), since the aggregation centers were located in the central part of the plot, a situation that was reflected in the distribution map achieved through the process of simulation where temperature and humidity conditions were used to perform the conditioned simulation. The centers of aggregation that are observed in the following years go from moderate to strong this because due to the change of white Creole corn to yellow Creole corn a selection made by the producer in 2015.
During the first sampling, in the municipality of Metepec the aggregation was located mainly on the edge of the plot sampled, while in the second sampling the aggregation centers were located in a strip located in the upper and lower part of the plot, being the simulation conditioned to environmental factors was the one that most suited what was found in reality (Figure 3).
During the sampling carried out in 2013, they were found in the upper and lower part again, although they reduced their incidence, a situation that was corroborated by the conditioned simulation again, since the aggregation centers and the severity of the presence of the fungus were attached in 90 % to what was found during the sampling, this situation can be observed in (Figure 4).
In Figure 5 we can see that, for the case of Villa Victoria, the main aggregation centers were located on the right side of the map for the year 2013. Once the simulation was done, it was observed that the unconditional simulation is the most it adheres to the real map taken in 2014, only that in reality, the severity was greater than the result of the simulation. For the year 2015, the simulation that was most attached was again the unconditional simulation although the severity in reality was greater.
In this locality, the focus of infestation is very well identified, in the years 2013 and 2014 the severity is higher this probably due to the low temperatures recorded in this area which affect the incidence these observations are similar to those reported by Gupta et al. (1983) in a study on (Claviceps microcephala), where he mentions that low temperatures provoke a greater incidence of ergot (Figure 6).
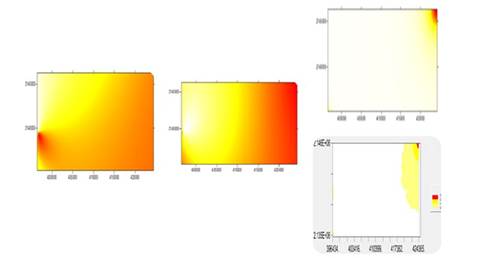
Figure 6 Map of density of C. gigantea of corn in the municipality of Villa Victoria obtained cycle 2014-2015. Left, maps obtained by simulation for 2015 under conditioned simulation on the upper right and not conditioned on the lower right.
In the municipality of Almoloya of Juarez, for the year 2013, aggregation centers were found in the upper left part of the map, which corresponds to the northeastern part of the plot and during 2014 the borders of the plots were the most affected by the disease, as well as the central part of the plot that has a slight subsidence. For this year, the simulation that most resembled reality was the unconditional simulation (Figure 7). In the case of 2015, in (Figure 8) we can see that the most accurate simulation was the unconditional simulation, since the aggregation centers are mainly located in the lower and upper part of the map as well as the reality observed during the sampling, a situation that is more serious in reality, with a greater severity up to 40%.
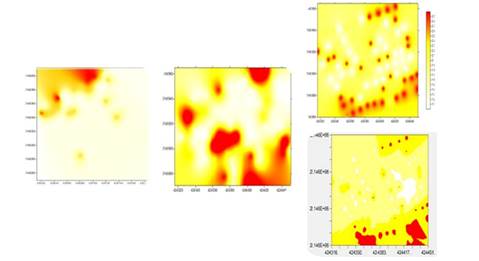
Figure 7 Map of density of C. gigantea of corn in the municipality of Almoloya of Juárez obtained cycle 2013-2014. Left, maps obtained by simulation for 2014 under conditioned simulation on the upper right and not conditioned on the lower right.
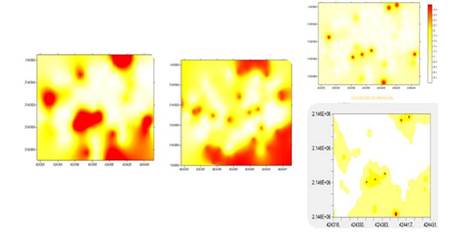
Figure 8 Map of density of C. gigantea of corn in the municipality of Almoloya of Juárez obtained cycle 2014-2015. Left, maps obtained by simulation for 2015 under conditioned simulation on the upper right and not conditioned on the lower right.
The maps obtained from simulations revealed that there will be a reduction of the favorable area for the disease in the study area, due to a reduction in relative humidity to levels below 30% in the future it is expected that this reduction will be gradual in 2016, 2017. In these plots were planted Quetzal hybrids (De Kalb) in previous years that have been very susceptible to C. gigantea, but it has been seen that when I switch to (Aspros HC8) low susceptibility up to 42% in 2014 not thus in the following years of study where the climate played an important role; this agrees with studies conducted by (Pecina et al., 2007) who observed hybrids and experimental lines were susceptible to ergot, the genotype NC+8R18 had lower incidence (5.1%) because their pollination was faster and more effective (95% of grain) which allowed to escape from the infection.
In the municipality of Calimaya, during 2013 the highest severity and incidence could be observed, since in this municipality the highest infested areas were shown during the three samplings with a surface superior to 85% infested by C. gigantea. In the map found in (Figure 9) it can be seen that the incidence is distributed along the plot and is aggravated on the banks of the property for 2013. Similar situation was reflected in the simulations obtained for the 2014 period, where the conditioned simulation is the one that sticks more closely to what was observed for the period.
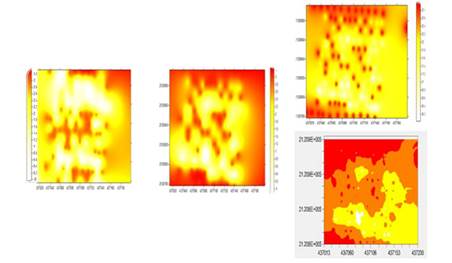
Figure 9 Map of density of C. gigantea of corn in the municipality of Calimaya obtained cycle 2013-2014. Left, maps obtained by simulation for 2015 under conditioned simulation on the upper right and not conditioned on the lower right.
During the samplings carried out in 2015, the distribution was repositioned on the banks and distributed to the center of the plot randomly and the precision of the conditioned simulation was much greater than the unconditional simulation. Studies like those by Ghini et al. (2011c) where they simulated future scenarios for the epidemics of coffee rust (Hemileia vastatrix) in Brazil by using a model that estimates the incubation period of pathogens, where in the same way that this study shows that one of the determining factors of the detonation or reduction of pathogens are the climatic effects (Figure 20).
Conclusions
The maps obtained by means of common kriging and interpolation (simulation), represent a visual form of how the disease is spread in the five study plots, the simulations helped us to identify possible zones of infestation being the main management strategy. Studies were carried out on the nature of the dispersion and interpolation of the pathogen from foci of infestation in the field, which will allow adequate management for the disease. It has been identified that the disease in maize plants depends largely on the material that is used at the time of planting, with hybrid maize being the most susceptible to damage by Claviceps gigantea, as well as the biotic factors that determine the conditions for the proliferation of the disease. It is recommended to continue with studies that provide epidemiological information, this in order to bring to fruition the geostatistical tools that allow us in real time to make a spatial and temporal analysis of the disease in order to provide control and management options adequate.
Literatura citada
Blom, E. and Fleischer, S. 2001.Dinamics in the spatial structure of Leptinotarsa decemlineata (Coleoptera: Chrysomelidae). Envirom. Entomol. 30(2):350-364. [ Links ]
Cambardella, C.; Moorman, T.; Novak, J.; Parkin, T.; Karlen, D.; Turcoy, R. and Konopka, A.1994. Field scale variability of soil roperties in central Iowa soils. Soil Sci. Soc. Am. J. 58(5):1501-1511. [ Links ]
Campbell, C. L. and Benson, D. M. 1994. Spatialaspect of352 / 2003thedevelopment of rootdiseaseepidemics. In: Campbell, C. L. and Benson, D. M. (Eds.). Epidemiologyand management of root diseases. Springer-Verlag. Berlin Heidelberg, Germany. 21(3):344- 356. [ Links ]
Delgado, G. J. 2007. Aplicación del método de simulación secuencial directa para la evaluación de la incertidumbre local en modelos digitales de elevaciones. Revista internacional de Ciencia y Tecnología de la información Geográfica. GeoFocus. 7:23-37 [ Links ]
Deutsch, C. V. 1994. Constrained modeling of histograms and cross plots with simulated annealing”. Report 7, Stanford Center for Reservoir Forecasting, Stanford, California, USA. [ Links ]
Ferguson, W.; Klukowski, Z.; Walczak, B.; Perry, J.; Mugglestone, M.; Clark, S. and Williams, I. 2000. The spatio-temporal distribution of adult Ceutorhynvhus assimilis in a crop of winter oilseed rape in relation to the distribution of their larvae and that of the parasitoid Trichomalus perfectus. Entomol. Exp. Appl. 95:161-171. [ Links ]
Fuentes, S. F.; De la Isla, M. de L; Ullstrup, A. J. and. Rodríguez, A.E. 1964 Claviceps gigantea, a new pathogen of maize in México. Phytopathology. 54:379-381. [ Links ]
Fucikovsky, L. and Moreno, M. 1971. Distribution of Claviceps gigantea and its percent attack on two lines of corn in the State of México, México. Plant Dis. Reptr. 55:231-233. [ Links ]
Gutiérrez, R. 1970. Efectos del parasitismo del muérdago enano (Arceothobium sp.) sobre el desarrollo en grosor del fuste de Pinusmoctezumae Lamb. y Pinushartwegii Lind. en el cerro de Telarón, Estado de México. INIF- SARH. Boletín técnico núm. 34. 22 p. [ Links ]
Gupta, G. K.; Subbarao, K. V. and Saxena, M. B. L. 1983. Relationship between meteorological fact and the occurrence of ergot disease (Claviceps microcephala) of pearl millet. Tropical Pest Management 29:321-324. [ Links ]
Ghini, R.; Hamada, E.; Pedro, J. M. J. and Gonçalves, R. R. V. 2011c. Incubation period of Hemileia vastatrix in coffee plants in Brazil simulated under climate change. Summa Phytopathologica. 38:85-93. [ Links ]
INEGI. 2015. Instituto Nacional de Estadística y Geografía. http://www.inegi.org.mx/. [ Links ]
Isaaks, E. H. and Srivastava, R. M. 1989. Applied geostatistics, New York, Oxford University Press. [ Links ]
Jiménez, C. R. A.; Ramírez, D. J. F.; Sánchez, P. J. R; Salgado, S. M. L. y Laguna, A. 2013. Modelización espacial de Frankliniella occidentalis (Thysanoptera: Thripidae) en tomate de cáscara por medio de técnicas geoestadísticas. Rev. Colomb. Entomol. 39(2):183-192. [ Links ]
Journel, A. G. 1974. Simulation conditionnelle de gisements miniers Theorie et Pratique: Paris, École des Mines de Paris, Thèse Docteur- Ingénieur. 110 p. [ Links ]
Lantuéjoul, Ch.1997. Interactive algorithms for conditional simulations. In: Baah, E. Y.; Ernest, Y.; Schohald, N. A. (Eds.). Geostatistics Wollongong ’96: Dordrecht, Kluwer. 1:27-40. [ Links ]
Matheron, G. 1970. La téorie des variables régionalisées, et ses applications: les cahiers du Centre de Morphologie Mathématique de Fontainebleau. 5-112 p [ Links ]
Oliver, M. and Webster, R. 1991. How geostatistics can help you. Soil use and management. 206-217 p. [ Links ]
Pecina, Q. V. 2007. Diversidad genética de aislamientos de cornezuelo (Claviceps africana Frederickson, Mantle y de Milliano) de Sorgo [Sorghum bicolor (L.) Moench.] en México. Rev. Mex. Fitopatol. 25(1):43-47. [ Links ]
Ramírez, D. J. F y González, A. J. L. 2006. Modelización y mapeo de la distribución espacial del muérdago enano (Arceuthobium sp.) en la ladera sur del Parque Nacional Nevado de Toluca. Rev. Geogr. Agríc. 38:19-32. [ Links ]
Ramírez, D. J. F. y Porcayo, E. 2010. Estudio comparativo de la distribución espacial del muérdago enano (Arceuthobium sp.) en la ladera norte del Parque Nacional Nevado de Toluca, México. Utilizando el método de SADIE. Madera y Bosques 34: 93-111. [ Links ]
Rong, J.; Dian, M. L.; Bao, Y. X.; Zhe, L. and Dong, L. M. 2006. Spatial distribution of oriental migratory locust (Orthoptera: Acrididae) egg pod populations: implications for site-specific pest management. Environ. Entomol. 35:1244-1248. [ Links ]
Rossi R.; Mulla, J.; Journel, G. and Franz, H. 1992. Geostatical tools for modeling and interpreting ecological spatial dependence. Ecological Monographs. 62(2):277-314. [ Links ]
Sánchez, P. J. R. 2011. Spatial distribution of head smut (Sporisorium reilianum) of corn in Mexico. Ciencia e Investigación Agraria. 38(2):253-263. [ Links ]
Samper, F. J. y Carrera, J. 1996. Geoestadística: aplicaciones a la hidrología subterránea. 2a (Ed.). Centro Internacional de Métodos en Ingeniería. In: Isaaks, E. H. R. M. Barcelona, España. 484 p. [ Links ]
Sciarretta, A.; Trematerra, P. and Baumgartner, F. 2001. Geostatistical análisis of Cydia funebrana (Lepidoptera: Tortricidae) Pheromonetrapcatches at twospatialscales. Am. Entomol. 47(3):174-184. [ Links ]
Solares, V.; Ramírez, J. F.; Sánchez, R. 2011. Distribución espacial de trips (Insecta: Thysanoptera) en el cultivo de aguacate (Persea americana Mill.) Boletín del Museo de Entomología de la Universidad del Valle. 12(2):1-12. [ Links ]
Speight, M.; Hails, R.; Gilbert, M. and Foggo, A. 1998. Horse chestnut scale (Pulvinaria regalis) (Homoptera: Coccidae) and urban host tre invironment. Ecology. 79(5):1503-1513. [ Links ]
Warham, E,J.; Butler, L. D. and Sutton, B. C. 1999. Seed testing of maize and wheat: a Laboratory Guide. CIMMYT. México. 84 p. [ Links ]
White, D. G. 1999. Ergot. In: White D. G. Compendium of corn diseases. Third Edition (ed. by White DG) APS Press. St. Paul Minnesota, EUA.78 p. [ Links ]
Received: January 00, 2018; Accepted: February 00, 2018
 Este es un artículo publicado en acceso abierto bajo una licencia Creative Commons
