


 text new page (beta)
 English (pdf)
 Article in xml format
 Article references
 Send this article by e-mail
 Cited by SciELO
  Similars in
SciELO
Similars in
SciELO 
 Permalink
Introduction
Capsicum annuum L. (cv. xcatik), which has its center of domestication and genetic diversity in Mexico [1], is one of the most economically important, and widely grown chilli species that has allowed the development of different cultivars and landraces maintained in traditional agricultural systems [2,3]. The xcatik chili pepper (XCP) is the second chili fruit consumed in the Mexican Yucatán peninsula with great acceptance and demand, increasing its consumption in the national and international markets. The size, colour, and pungency of this pepper may be attributed to the soil and weather of the region [4]. Although the economic importance of chili peppers is mainly based on their use in food preparation because of their sensory attributes, such as aroma, flavour, colour, and pungency [5], it has been demonstrated that chili peppers are an excellent source of natural dyes, pigments, minerals, vitamins, and bioactive compounds, used in different industrial fields [6]. The biological activities studied from different varieties of chili peppers are antioxidant, antimicrobial, anti-inflammatory, anti-tumor, and anti-teratogenic activities [7-9], making them interesting raw materials for the pharmaceutical industry in the development of new treatments mainly attributed to the high concentration of phenolic compounds and capsaicinoids [10,11].
The study and analysis of phytochemical compounds and the biological and functional properties of the chili peppers products are mainly performed on the whole fruit to understand the effect of processing conditions. In this sense, during the last decades, different methods have been studied for the recovery of both capsaicinoids and phenolic compounds from chili pepper species. Some extraction procedures of bioactive compounds implicate microwave, stirring, sonication, or pressurized fluids treatment, being the most common maceration method [12,13]. Recently, ultrasound-assisted extraction (UAE) has been employed as a sustainable extraction method for the recovery of bioactive compounds [14,15]. The UAE is an adequate technique to obtain polyphenols and capsaicinoids due to its simplicity and low equipment cost; the energy derived from the acoustic cavitation, combine with organic solvents, produces higher extraction yields at lower temperatures and shorter times than conventional methods [16]. Additionally, UAE favours the reduction of particle size, rupture of cell walls, and enhancement of mass transfer in the extraction processes [17,18].
Nevertheless, few studies of the Mexican landraces from C. annuum have been reported [19]. Particularly, the Mexican southeast region represents a diversified place for the Capsicum cultivars, some of which have been little studied and characterized. Although bioactive compounds from chili peppers have been well studied, scarce studies have reported the profile of phenolic compounds and capsaicinoids of XCP, and there is no report on the use of UAE in this fruit. For this reason, the main objective of this work was to carry out a physicochemical characterization of XCP followed by the quantification and identification of their principal bioactive compounds (phenolic compounds and capsaicinoids) extracted by the UAE method and identified by UPLC-PAD-ESI-MS, and the determination of their antioxidant capacity.
Experimental
Plant material
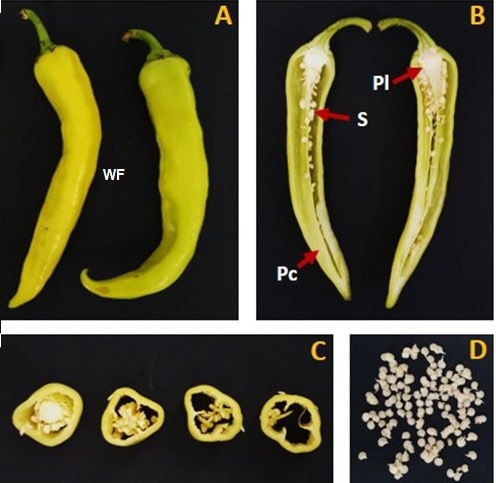
Xkatik chili fruits in a state of advanced maturity (°Brix/ titratable acidity >25) [20,21] were acquired in the local market of Merida, Yucatan, Mexico. The fruits were purchased in June 2020 and May 2022, the taxonomic analysis of the xkatik fruit was performed by the workgroup of the Plant Physiology Laboratory, Centro de Investigación y Asistencia en Tecnología y Diseño del Estado de Jalisco (CIATEJ), Mérida, México, and the identification of the fruit was confirmed with the specimen produced from the germplasm collection held at the Colegio de Posgraduados Campus Campeche. The raw materials were washed with fresh tap water to remove soil and adhered particles. Whole fruit, placenta, pericarp, and seeds in fresh or dried powder were used in the analyses (Fig. 1). The powder samples were prepared by thermal treatment in a HS60-AID Novatech laboratory scale electric convection oven (Tlaquepaque, JAL, MX) at 60 °C ± 1 °C during 24 h. The dried samples were milled into a conventional laboratory scale mill and sifted in a sieve of 500 µm to obtain the powder samples.
Whole fruit physicochemical analysis
Measurement of pH was performed according to Mexican codex NMX-317-S-1978 using an Oakton pH 700 Benchtop meter (Vermon Hills, IL, USA). Titratable acidity was conducted according to Mexican codex NMX-F-102-S-1978 and the results were expressed as citric acid milliequivalent (mEq). Water activity and moisture percentage were determined using a LabSwift-aw Novasina (Lachen, Switzerland) and MB45 Ohaus moisture analyzer (Parsippany, NJ, USA), respectively. Soluble solids were measured in a NAR─1T LIQUID Atago Abbe refractometer and were reported as °Brix. Bidistilled water was used to calibrate the instrument to 0° Brix. Colour measurement was performed using a HunterLab MiniScan EZ 4500L colourimeter (Reston, VA, USA). Before measuring, the hunter meter was calibrated using a white reference tile and a light trap (black tile). The HunterLab coordinates L* (lightness, 0 for black to 100 for white), a*(red-green), and b* (yellow-blue) were determined and used to obtain Croma (C*, Eq. 1) and hue angle (h°, Eq. 2) according to:
Polyphenols and capsaicinoids extraction
Bioactive compounds were obtained using the UAE and maceration extraction methods following the methods described by Medina-Torres et al., [22] with slight modifications. UAE was performed in an Ultrasound processor GEX130PB (Newtown, CT, USA) at 20 kHz. The ultrasound device was programmed at 90 % of amplitude with a probe of 12 mm diameter. Two grams of sample in 20 mL of ethanol/water (70:30, v/v) was subjected to ultrasound radiation for 10 min and then the mixture was filtered and taken to a known volume. Collins or maceration extraction was carried out using one gram of sample in 10 mL of ethanol (96 %) and the mixture was subjected to extraction in a water bath at 80 °C for 2 h. Then, the mixture was filtered and taken to a known volume. The maceration extraction method was used as a control.
Total polyphenols content (TPC)
The TPC was determined by Folin-Ciocalteu’s phenol method [23] with slight modifications. A sample of each extract (25 µL) was mixed with 250 µL of Folin-Ciocalteu’s phenol reagent (1 N), 1,250 µL of Na2CO3 (7.5 % w/v), and 475 µL of distilled water. The reaction mixture was incubated at room temperature for 2 h in dark conditions. For a blank, 25 µL of distilled water was used instead of extract. The absorbance was measured in a Biomate 3S spectrophotometer Thermo Scientific (Madison, WI, USA) at 760 nm. Estimation of TPC was carried out using gallic acid as a standard and the results were expressed in mg gallic acid equivalent per gram in dry weight (mg GAE g(1 DW).
Total flavonoid content (TFC)
To determine the content of total flavonoids, the procedure established by Pekal and Pyrzynska [24] was performed, and a standard curve of 0 to 600 ppm of quercetin was prepared. An aliquot of 0.5 mL of 2 % AlCl3 (w/v) was added to 1 mL of each of the solutions of the quercetin standard used to construct the curve and to the extracts; subsequently, 0.5 mL of 1N HCl was added, then the solutions were shaken vigorously and incubated for 10 min at room temperature. The absorbance of the solutions was measured at 425 nm. The results were expressed as equivalents of quercetin (QE) per gram of dry weight (g DW).
Determination of capsaicinoids and phenolic compounds by UPLC-PAD-ESI-MS
Profile analysis of capsaicinoids and phenolic compounds was performed by ultra-high-performance liquid chromatography (UPLC) in Acquity H Class (Waters, Milford, CA, USA) chromatographer, equipped with a sample manager (UP-SMFTN), a quaternary pump (UP-QSM), and a photodiode array detector (UP-PDALTC). Chromatographic separations were performed with a Waters Acquity UPLC BEH C18, 1.7 μm, 100 × 2.1 mm ID column (Milford, MA, USA). Determination of capsaicin and dihydrocapsaicin was performed as reported by Medina-Torres et al., [22]. The mobile phases were acetonitrile (A) and Milli-Q water (B). The elution program was isocratic (A: 60 % v/v; B: 40 % v/v); elution time: 10 min; flow rate: 0.2 mL/min; column temperature: 27 °C; injection volume: 2 μL; UV-vis reading range: 210 to 400 nm; reading channel: 280 nm. Capsaicin and dihydrocapsaicin contents were expressed as mg g(1 dry wt. Total capsaicin content (TCC) was expressed as the sum of capsaicin and dihydrocapsaicin.
Determination of phenolic compounds was performed using 0.1 % v/v formic acid in ultrapure water (A) and 0.1 % v/v formic acid in acetonitrile (B) as mobile phases; the elution program was non-isocratic: 100 % A (0 to 2 min), linear gradient from 100 % to 90 % A (2 to 4 min), linear gradient from 90 % to 77 % A (4 to 6 min), 77 % A (6 to 17.5 min), a linear gradient of 77 % to 100 % of A (17.5 to 18.0 min), linear gradient of 100 % to 50 % of A (18.0 to 24.0 min), linear gradient of 50 % to 100 % of A (24.0 to 30.0 min), 100 % de A (30.0 to 31.0 min); elution time: 31.0 min; flow rate: 0.15 mL/min; column temperature: 27 °C; injection volume: 2 μL; UV-vis reading range: 210 to 400 nm; reading channel: 290 nm [25].
Mass spectrometry for phenolic compounds analysis
For mass spectrometry (MS) analysis, a Waters micro Xevo TQ-S instrument was used. The analysis was performed in negative polarity (negative ion mode); capillary voltage: 2.70 kV; source temperature: 150 °C; desolvation temperature: 350 °C; desolvation gas flow rate (nitrogen): 650 L/h; cone flow rate: 0 L/h. A cone voltage of 25 to 150 V was used. The collision energy was 3 eV. Mass spectra were recorded in full scan mode over a range of m/z 20 to m/z 1,000 [16]. MassLynx V4.1 software (Waters, Milford, MA, USA) was used for data acquisition and processing. Tentative identification was assigned according to that reported in published literature and public databases.
Antioxidant capacity evaluation
Antioxidant capacity was evaluated employing two methods: DPPH and ABTS. The 2,2-diphenyl-1-picrylhydrazyl (DPPH) scavenging method [25] with slight modifications was used. A sample extract (100 µL) was mixed with 2,900 µL of 0.1 mM DPPH solution (prepared with methanol), followed by homogenization, and incubated in dark conditions for 30 min. For the blank, 100 µL of distilled water was used instead of extract. Absorbance was measured in a Biomate 3S spectrophotometer Thermo Scientific (Madison, WI, USA) at 517 nm.
The ABTS radical decolorization assay was carried out using the method reported by Zhou et al., [26] with slight modifications. A stock solution of 2 mM ABTS was prepared for testing. This was activated with 40 μL of 70 mM K2S2O8 stored in the dark for 16 h at room temperature before use. The ABTS+ radical solution was diluted with phosphate buffer (pH 7) until reaching an absorbance value of 0.70 - 0.80 nm. Then, 990 μL of ABTS+ radical solution was mixed with 10 μL of fresh extracts. After incubation for 6 min, the absorbance of the samples at 734 nm was measured.
The results of both methods of antioxidant capacity (DPPH and ABTS+) were expressed as µmol TE/g DW.
Statistical analysis
All experiments were conducted in triplicate and the data were reported as the mean ± standard deviation. Data were analyzed by analysis of variance (ANOVA) and significant differences were assessed by multiple comparisons of mean by LSD-Fisher at p ˂ 0.05 using the Statgraphics Centurion XVI software program (Warrenton, VA, USA). Pearson correlation analysis and principal component analysis were performed in Minitab® (20.3) statistical software.
Results and discussion
Physicochemical characterization of the fresh product
The quality of the fresh chili is defined by the physicochemical parameters. The fresh XCP parameters are presented in Table 1; high moisture content (95 %), high water activity values (0.97), and low soluble solids (4.75) were obtained. For lightness (L*), values over 43.36 were observed, which indicates the luminosity of the sample depending on the redness and yellowness level of the fruit. Parameter a* measures the difference between green (-) and red (±), while parameter b* measures the difference between blue (-) and yellow (±). The a* value was (0.74, indicating that the fresh fruit presented a characteristic color that tends to the green color, while the b* value was 34.85, indicating that the fresh fruit tends to the yellow color. The saturation index or chroma (C*) presented a value of 31.86, which indicates the intensity of a specific hue, based on the purity of color (intense or colorless).
Table 1 XCP whole fruit and tissues characterization.
| Characteristic | Whole fruit | |||
| Colour of whole fruit | L* | 43.36 ± 0.77 | ||
| a* | - 0.74 ± 0.12 | |||
| b* | 31.85 ± 0.20 | |||
| c | 31.86 ± 0.20 | |||
| h | 88.67 ± 0.24 | |||
| Water activity | 0.97 | |||
| Moisture content (%) | 95.06 ± 1.98 | |||
| Tissue of fruit | ||||
| Pc | Pl | S | ||
| Proportion of weight (%) | 90.78 ± 2.32 | 5.42 ± 2.25 | 3.80 ±0.85 | |
| Moisture content (%) | 93.32 ± 0.93 | 93.79 ± 0.10 | 61.93 ± 4.83 | |
Pc: pericarp, Pl: placenta, S: seeds.
The pericarp of XCP fruits is the most abundant tissue, representing more than 90 % of the fruit, followed by the placenta (5.42 %), and then the seeds (3.8 %) (Table 1).
The physicochemical parameters of XCP fresh fruit are similar to the values reported in Mexican chili varieties by Orellana-Escobedo et al., [27] and higher than those of King chili [28]. Color values indicated low intensity for chili fruit that refers to the lightness (L*) and a*, b* behaviour with a tendency to green-yellow colour characteristic, which may be related to lower concentrations of capsanthin and capsorubin, pigments responsible for the reddish colour of peppers, such as the Byadgi chili variety [29]. For the hue angle, the value obtained was 88.67° and indicating that the fresh chili fruit tends to yellow colour in a greater proportion between 0-90° according to CIELAB system [30]. The physicochemical andcolourr parameters obtained for XCP fresh fruit can be used as a reference to the quality characteristics of the raw material before its treatment and processing.
Total phenolic and flavonoid content
The results of total phenolic content (TPC) and total flavonoid content (TFC) obtained from different dry and fresh parts of XCP extracts employing UAE and maceration are presented in Table 2. The multifactorial analysis showed that all factors (pretreatment, fruit tissue, and extraction method) had a significant effect (p < 0.05). TPC values of dry samples were higher (p < 0.05) than those obtained from fresh samples, probably caused by the disruption of the cellular matrix during drying [31]. The values of TPC from fresh samples recovered with UAE ranged from 1.96 to 11.67 mg GAE/g DW, being the highest content of phenols observed in the whole fruit extracts (11.67 ± 3.34 mg GAE/g DW). The maceration of fresh sample extracts presented TPC values from 0.53 to 9.15 mg GAE/g DW, finding that placenta was the tissue with the highest content of phenols (9.15 ± 0.74 mg GAE/g DW). For extracts obtained from the dehydrated XCP samples, the use of UAE showed concentrations from 2.71 to 15.94 mg GAE/g DW, while the TPC of the extracts obtained by maceration remained in a range that varied from 0.66 to 10.81 mg GAE/g DW. According to the statistical analysis, all factors presented an effect on TFC (p < 0.05). The part of the fruit with the highest TFC content was the placenta extracted with UAE, with a yield of 7.59 ± 0.88 and 7.22 ± 0.71 mg QE/g DW for fresh and dry samples, respectively (p < 0.05) (Table 2). As for the content of phenols, the seeds samples were the ones with the lowest concentration of flavonoids.
Table 2 Total phenolic content (TPC), total flavonoids content (TFC), capsaicin content (CSC), dihydrocapsaicin (DHC) content, and antioxidant capacity (DPPH and ABTS+) of extracts recovered from different parts of XCP.
| TPC (mg GAE/g DW) | TFC (mg QE/g DW) | ABTS+ (µmol TE/g DW) | DPPH (µmol TE/g DW) | CSC (µg/g DW) | DHC (µg/g DW) | |||
| Fresh | UAE | Wf | 11.67±3.34ab | 10.45±0.03a | 106.03±9.51ab | 42.00±6.79a | 781.81±101.56d | 290.20±3.54c |
| Pl | 9.14±0.16bcd | 7.59±0.88b | 109.09±15.93a | 18.76±1.07b | 1767.295±95.79c | 936.34±92.75b | ||
| Pc | 6.68±2.14cdef | 6.13±0.59cd | 64.74±4.74de | 11.39±1.36de | 128.32±6.31e | 0±0f | ||
| S | 1.96±0.74fgh | 1.90±0.18e | 14.69±2.67f | 3.17±0.71hi | 24.17±2.19f | 6.04±6.59f | ||
| MC | Wf | 5.02±1.25defg | 2.39±0.21e | 85.43±2.08bcd | 18.12±2.05bc | 380.7±19.58e | 243.78±46.93cd | |
| Pl | 9.15±0.74bcd | 1.56±0.33e | 104.62±1.42ab | 12.31±2.36cd | 407.68±16.35e | 198.31±13.17cde | ||
| Pc | 0.53±0.06gh | 0.00±0.00g | 59.42±7.47de | 10.62±2.38def | 380.70±66.36e | 175.27±43.20cdef | ||
| S | 2.18±0.31efgh | 0.61±0.08fg | 16.22±1.42f | 4.73±1.57fghi | 204.84±24.74e | 80.06±21.87def | ||
| Dry | UAE | Wf | 7.02±0.33cd | 6.29±0.52cd | 84.07±1.38bcd | 4.68±0.76efghi | 380.7±19.58e | 243.78±46.93cdef |
| Pl | 15.94±0.76a | 7.22±0.71bc | 102.01±2.21abc | 10.85±0.45defg | 407.68±16.36a | 198.31±13.17a | ||
| Pc | 9.52±0.12bcd | 6.03±0.01cd | 69.66±8.34de | 2.17±0.43i | 380.7±66.36f | 175.27±43.20f | ||
| S | 2.71±0.22efgh | 1.92±0.20e | 31.51±2.44f | 4.27±0.17ghi | 204.84±24.74e | 80.06±21.87e | ||
| MC | Wf | 6.33±0.61de | 6.26±0.10cd | 77.52±2.31cde | 5.25±0.21eghi | 318.84±6.31e | 190.45±21.43cde | |
| Pl | 10.81±0.01bc | 6.39±0.57bcd | 74.18±1.90de | 12.53±2.73bcd | 2580.98±317.68b | 1251.22±169.36a | ||
| Pc | 6.99±0.28cd | 5.66±0.04d | 55.38±6.34e | 9.10±0.61degh | 191.50±28.27e | 112.42±17.43cde | ||
| S | 0.66±0.13h | 2.48±0.40e | 21.47±2.44f | 2.56±0.45i | 86.17±15.15ef | 45.48±9.74e | ||
Wf : Whole fruit, Pl: placenta, Pc: pericarp, S: seeds, UAE: ultrasound-assisted extraction, and MC: maceration. Different lowercase letters indicate statistically significant differences (p < 0.05) between values in the same column.
Total capsaicinoids content
Statistical analysis showed significant differences in capsaicin content (CSC) in the different tissues of the fruit. The mayor CSC was found in the fresh placenta (Pl) for UAE and dry Pl for maceration (MC), 1,767 µg/g DW and 2,580 µg/g DW, respectively, followed by the pericarp (Pc) and seeds (S) (Table 2). The major DHC was found in the fresh Pl for UAE and dry MC, 936 µg/g DW and 1,251 µg/g DW, respectively, followed by the Pc and S (Table 2). The extraction of capsaicinoids presented a higher response using dried fruit than fresh material. The use of UAE for extraction represented a major recuperation of capsaicinoids compared to the maceration method. Results about the effect of drying on the capsaicinoids composition coincide with the postulate that the drying of chili peppers should be carried out at temperatures between 60 and 70 °C, to minimize the loss of capsaicin [32,33] and to reduce the peroxidase activity [34,35]. The content of capsaicin and dihydrocapsaicin shows a pattern similar to that presented by the content of total capsaicinoids, that is, a high content of these compounds in the placentas, especially dehydrated and recovered by UAE. In both cases (dry and fresh chili peppers), the placenta presented the highest content of phenols among all the tissues. The concentration of phenols determined in the seeds was the lowest of all the parts; this phenomenon can be explained because this part of the peppers, as it has been reported, has a higher content of steroidal capsicoside A-D glycosides than other biomolecules [36], and the hardness of the cellular matrix in this tissue makes difficult for the solvent to enter to the cell. The effect of the pretreatment of the extracts of dry raw material is observed since a significant increase in TFC is detected when these were obtained by maceration. This variation is not evident when comparing the samples recovered by UAE from both fresh and dried fruits, allowing to conclude that drying as a pretreatment increases the bioavailability of flavonoids present in XCP to such a level that it is not necessary to use ultrasound to recover these phenolic species. This phenomenon was evidenced in residues of oven-dried [37] lemon and mango [38].
Naturally, the placenta has a higher concentration of capsaicinoids than the other parts of the fruit because these compounds are synthesized in this tissue [39]. The seeds presented the lowest levels of capsaicinoids, and this may be because capsaicinoids inhibit seeds germination, therefore, the high content of these molecules would be counterproductive for the continuation of the cycle of chili plants [40]. For the effect of drying pretreatment, the behavior of capsaicinoids was similar to TPC and TFC, corroborating the idea that the drying condition employed in this research enhances the release of XCP bioactive compounds. It is important to highlight that in addition to the use of placentas and pericarps of chili peppers for the development of food products at an industrial level, due to their high content of bioactive compounds, such as polyphenols and capsaicinoids, these parts could represent an interesting source of them, especially for the pharmaceutical industry, because these compounds have shown to have different beneficial properties in the treatment of pain, inflammation, and oxidative diseases, among others [41]. Regardless of the tissue studied in this research, the concentration values of total capsaicinoids are higher than those reported for the placenta and pericarp of Jeromin pepper during the different stages of maturation [42], results that would position the XCP as a source of molecules of pharmaceutical interest.
Antioxidant capacity of xkatik chili extracts
The extracts recovered from fresh whole fruits presented higher (p < 0.05) antioxidant capacity evaluated by the DPPH method than that presented by samples of dehydrated whole fruits (Table 2).
The extracts recovered from fresh samples show a greater (p < 0.05) capacity to scavenge DPPH● radicals when these are obtained using UAE (15.14 ± 0.42 µEq Trolox/g DW) (Table 2), a phenomenon that could be caused by a greater release of antioxidant agents from the interior of the cells towards the solvent by cavitation effect [43]. While in the extracts recovered from dry samples, a significant effect (p < 0.05) of the extraction method was only observed on the pericarp samples.
The multifactorial analysis indicated that all factors evaluated affected the antioxidant capacity (ABTS method) (p < 0.05) and an interaction between two factors was observed, the part of the fruit evaluated, and the pretreatment used before the extraction. Regarding the antioxidant capacity of the extracts obtained from the different parts of the XCP, it stands out that the Pl extracts were the ones that presented the highest antioxidant capacity both by the DPPH method and by the ABTS+ method (Table 2), followed by the Pc extracts and the seeds extracts, which presented the lowest values of this biological property. These results coincide with the works that describe the accumulation of bioactive compounds [44]. A decrease in DPPH radical scavenging is presented when chili fruits were dried. This could be caused by the degradation or volatilization of the biomolecules responsible for DPPH● radical stabilization, a degradation that has been reported for extracts as one of the critical points to consider in the pretreatment of the raw material [45]. The effect of the extraction method is mainly observed by a reduction in the activity to capture ABTS+ radicals by the extracts of dry samples recovered using maceration, which could be caused both by the deficiency of the method to release the compounds that act against the radical ABTS+, and that could be an indicator that these compounds could be linked to macromolecules such as proteins or due to the alteration of their structure [46]. These results demonstrate the advantages of UAE as a green extraction method [47] because it allows high recovery yields of polyphenols with a higher capacity to capture DPPH● radicals in short periods using G.R.A.S.-type solvents compare to maceration.
Phenolic compounds identified by UPLC-PDA-ESI-MS
The presence of 19 molecular ions and their description is presented in Table 3. Based on UV spectra, molecular weights, fragmentation patterns, and database registers, the identification of 12 compounds classified as phenolic compounds on the whole fruit of XCP was achieved. Additionally, with the same UPLC-PDA-ESI-MS conditions an amino acid and a nucleoside were also identified. The first compound observed was guanosine (7.13 min), which has a molecular ion at m/z 282. The m/z 150 fragment that corresponds to the guanine ion (purine nucleoside), represents the loss of a ribosyl ([M - H - 132](, C5H8O4) (https://massbank.eu/MassBank/RecordDisplay?id=MSBNK-Keio_Univ-KO000839&dsn=Keio_Univ) [48]. The UV-vis spectrum shows a maximum lambda (λmax) of 253 nm, which coincides with the UV spectrum reported for this compound. Additionally, this compound has been detected in different fruits of the Capsicum genus [49].
Table 3 Phenolic and other compounds identified in XCP by UPLC-PDA-ESI-MS in extracts obtained using ethanol/water by UAE.
| Number | t R (min) | PDA UV bands (nm) | [M – H] - | Molecular formula | Negative ion | Classification | Tentative identification |
| 1 | 7.13 | 250, 276sh | 282 | C10H13N5O8 | 150 | Nucleoside | Guanosine |
| 2 | 7.57 | 206, 268, 291 | 249 | C13H18N13O3 | 135 | Phenolamide | N-Caffeoyl putrescine (Isomer I) |
| 3 | 8.09 | 218, 231, 293sh, 317 | 249 | C13H18N13O3 | 135 | Phenolamide | N-Caffeoyl putrescine (Isomer II) |
| 4 | 8.17 | 198, 270 | - | - | - | - | Unknown |
| 5 | 8.45 | 206, 259, 305sh | 299 | C13H16O8 | 137 | Hydroxybenzoic acid | Hydroxybenzoic acid glucoside |
| 6 | 8.65 | 223, 279 | 203 | C11H12N2O2 | 116 | Amino acid | Tryptophan |
| 7 | 8.65 | 219, 288, 317 | 329 | C14H18O9 | 167 | Hydroxybenzoic acid | Vanillic acid glucoside |
| 8 | 8.76 | 215, 290sh, 329 | 757 | - | 594, 301, 299, 271 | Flavonoid | Unknown |
| 9 | 9.15 | 216, 298sh, 320 | 353 | C16H18O9 | 191 | Hydroxycinnamic acid | Chlorogenic acid |
| 10 | 9.15 | 216, 298, 321 | 341 | C15H18O9 | 179 | Hydroxycinnamic acid | Caffeic acid glucoside |
| 11 | 9.24 | 207, 284 | 325 | C15H18O8 | 163 | Hydroxycinnamic acid | Coumaroyl glucoside |
| 12 | 9.34 | 202, 255, 267sh, 345 | 799 | - | 637, 299, 271 | Flavonoid | Unknown |
| 13 | 9.5 | 218, 330 | 385 | - | - | - | Unknown |
| 14 | 9.55 | 218, 292, 329 | 355 | C16H20O9 | 193, 175, 160 | Hydroxycinnamic acid | Feruloyl hexoside |
| 15 | 9.91 | 216, 299sh, 310 | 337 | C16H18O8 | 163 | Hydroxycinnamic acid | Coumaroylquinic acid |
| 16 | 10.79 | 210, 334 | - | - | - | - | Unknown |
| 17 | 11.35 | 215, 255sh, 266, 344 | 579 | C26H28O15 | 285 | Flavonoid (Flavone) | Luteolin-7-O-(2-O-apiosyl) hexoside |
| 18 | 14.18 | 208, 253, 262sh, 347 | 665 | C29H30O18 | 621, 451, 285, 225 | Flavonoid | Luteolin 7-O-(2-apiosyl-6-malonyl)-glucoside |
| (Flavone) | |||||||
| 19 | 19.16 | 214, 264, 338 | 827 | C35H39O23 | 621, 603, 285 | Flavonoid | Luteolin 7-O-(2-apiosyl-4-glucosyl-6-malonyl) glucoside |
With retention times (t R) of 7.57 and 8.09 min, two isomers of N-caffeoyl putrescine were identified, whose molecular ion is m/z 249. The m/z 135 fragment corresponds to the 4-vinylcatechol ion, a structure that is derived from caffeic acid after the loss of a carboxyl group. The characteristics of the UV-vis spectrum correspond to those reported by Herrera-Pool [16].
Hydroxybenzoic acid glucoside, tryptophan, and vanillic acid glucoside was also identified with t R of 8.45, 8.65, and 8.65 min, respectively. Hydroxybenzoic acid glucoside has a molecular ion of m/z 299. The m/z 137 fragment corresponds to the hydroxybenzoic acid ion ([M - H - 162](, C6H10O5), corroborated by the characteristics of the UV-vis spectrum, which corresponds to those of hydroxybenzoic acid. Furthermore, a molecular ion at m/z 203 is characteristic of tryptophan, with a fragment of m/z 116 corresponding to the indole ion (2,3-benzopyrrole) ([M - H - 87](, C3H5NO2), whose λmax is 279 nm. Finally, vanillic acid glucoside co-elutes with tryptophan. The molecular ion corresponding to this compound is the fragment at m/z 329. The m/z 167 fragment corresponds to vanillic acid after the loss of a glucosyl moiety ([M - H - 162](, C6H10O5). The UV-vis spectrum of this compound is similar to that of vanillic acid in its aglycone form. Both glucosides of hydroxybenzoic acid and vanillic acid have recurrently been reported in phenolic profiles of peppers of the Capsicum genus [50,51].
In the t R interval of 9-11 min, five compounds were identified: neochlorogenic acid (9.15 min), caffeic acid glucoside (9.15 min), coumaroyl glucoside (9.24 min), feruloyl glucoside (9.55 min), and coumaroylquinic acid (9.91 min). Neochlorogenic acid has a molecular ion of m/z 353 with a m/z 191 ionization fragment corresponding to the quinic acid ion ([M - H - 162](, C9H6O3). The UV-vis spectrum of this compound is similar to that of chlorogenic acid (analytical standard). As for the caffeic acid glucoside, it has a molecular ion of m/z 341, and the identification of a m/z 179 fragment was achieved, corresponding to the caffeic acid ion after the loss of a glucosyl group ([M - H - 162](, C6H10O5). Coumaroyl glucoside has a molecular ion of m/z 325 and its most representative fragment has m/z 163, corresponding to the ion of coumaric acid after the loss of a glucosyl group ([M - H - 162](, C6H10O5). On the other hand, the UV spectrum of this compound is similar to that of coumaric acid in its aglycone form. Feruloyl glucoside has a molecular ion of m/z 355. The m/z 193 fragment corresponds to the ferulic acid ion after the loss of a glucosyl group ([M - H - 162](, C6H10O5), while the m/z 175 fragment corresponds to the loss of a molecule of water ([M - H - 162 - 18](, C6H10O5 - H2O). While coumaroylquinic acid has a molecular ion of m/z 337. The m/z 163 fragment corresponds to coumaric acid after the loss of glucose ([M - H - 174](, C6H10O5). The UV-vis spectrum of this compound is similar to that of coumaric acid (analytical standard) in its aglycone form.
Finally, the identification of three compounds derived from luteolin was achieved, luteolin-7-O-(2-O-apiosyl) hexoside (11.26 min), luteolin 7-O-(2-apiosyl-6-malonyl) glucoside (14.18 min), and luteolin 7-O-(2-apiosyl-4-glucosyl-6-malonyl) glucoside (19.16 min), whose molecular ions are m/z 579, 665, and 827, respectively. Luteolin-7-O-(2-O-apiosyl) hexoside presented a fragment (m/z 285) that corresponds to the luteolin ion in the form of aglycone after the loss of its glucosyl substituent 2-O-apiosyl group ([M - H - 294](, C11H18O9). Luteolin 7-O-(2-apiosyl-6-malonyl)-glucoside presented two ionization fragments at m/z 621 and m/z 285 that correspond to the loss of a carboxyl group ([M - H - 44](, CO2), and to the luteolin ion in its aglycone form. Moreover, luteolin 7-O-(2-apiosyl-4-glucosyl-6-malonyl) glucoside presented three ionization fragments at m/z 621, 603, and 285, which represent the loss of a glucosyl ion and a carboxyl group ([M - H - 162 - 44](, C6H11O5 and CO2), the loss of a glucose and a carboxyl group ([M - H - 180 - 44](, C6H12O6) and CO2), and the luteolin ion in its aglycone form [51].
Conclusions
This study showed that extracts with high antioxidant activity can be obtained from the different tissues of the XCP (Capsicum annuum L.) using UAE, which have a varied phenolic profile, with more than 19 compounds, among which stands out the presence of hydroxycinnamic acid known for its biological properties. Additionally, it was possible to expose that XCP can be a source of capsaicinoids, especially XCP placentas, which could be used, after processing the fruit, for the recovery of phytochemical compounds that are of interest to the food and pharmaceutical industries either as natural preservatives or for the treatment of oxidative stress. However, further studies should be carried out to explore the fractions of the crude extracts for pharmacological and toxicological characterization.

