


 text new page (beta)
 English (pdf)
 Article in xml format
 Article references
 Send this article by e-mail
 Cited by SciELO
  Similars in
SciELO
Similars in
SciELO 
 Permalink
1. INTRODUCTION
Activated carbons are regarded as one of the most important commercial materials, with many unique properties with large specific surface áreas, high porosity, and adequate pore size distributions. Also, they mostly have high mechanical strength to be used for separation, purification and catalysis (Hameed, Din, & Ahmad, 2007). Activated carbons are produced from many carbonaceous materials of lignocellulosic in origin; this includes coal, wood, peat and agricultural materials (Rodriguez-Reinoso, Molina-Sabio, & Muñecas 1992).
Granular activated carbons (GAC) in various forms are quite widely employed in water and wastewater treatment processes for removing organic compounds including phenol and its derivatives (Tan, Ahmad, & Hameed, 2008). Most carbonaceous materials available in nature can be converted into active carbons, differ by their porosity and specific surface área. Depending upon the nature of raw material used and the condition of the activation process chosen, properties of the final carbón product vary. Also, surface modifications of many carbón materials leads to genérate more active sites on their solid surface, can be suitably utilized for effective adsorption
removal and separation purposes. Such carbons are used as a substitute for other more expensive ion exchange resins, adsorbents and catalyst support (Liu, Zheng, Wang, Jiang, & Li, 2010; Mohd Din, Hameed, & Ahmad, 2009). Literature on carbón science discuss a multitude of activating agents extensively known employed for the production of activated carbón materials with desired pore structure. The purpose of physical/chemical activation is to créate and develop porosity in the carbón material and thereby increase their adsorption efficiency. This enhanced porous surface quality has been exploited for the removal of many organic compounds from solutions particularly using coconut shell based carbons (Shen, Li, & Liu, 2008).
All the known carbón activation procedure belongs into two types, namely, physical activation or chemical activation depending on whether a gaseous or the chemical activating agent is used. Chemical activation is a single step process for the preparation of activated carbón where carbonization of precursor in the presence of chemical agents is done under controlled conditions in a furnace. For this, a solid activating agent like alkali and alkaline earth metal containing substances or some acids are used (e.g. KOH, NaOH, Li2C03, Na2C03, K2CO3, Rb2C03, Cs2C03, ZnCl2, and H3PO4). Physical activation involves two steps, namely (i) carbonization of the precursor in an inert atmosphere (ii) subsequent activation of the resulting char in the presence of carbón gasification agents such as carbón dioxide, steam, air or a suitable combination of these (Namasivayam & Kadirvelu, 1997). However, the impregnation of metal ion/salts onto char matrix modifies the porous structure of resulting activated carbón. An increase in the adsorption efficiency was given by metal ions impregnated carbón for the removal of mercury, lead, arsenic, chromium, Nickel etc. (Sreedhar. Madhukumar & Anirudhan, 1999). Innovative approach regarding activation of carbón with new catalysts is an área of active research in adsorption science.
Zirconium and its salts are reported to be relatively safe and acceptable inorganic substance, has low biotoxicity and are relatively inexpensive. The most important characteristics of this material is their catalytic potential, high reactivity, large specific surface área, ease of separation, and the presence of a large number of active sites for interaction with different contaminants (Holmes, Fuller, & Gammage, 1972). Adsorption performances of various activated carbons with respect to phenol removal have been reported in many earlier studies (Achari & Anirudhan, 1995; Stoeckli, López-Ramón, & Moreno-Castilla, 2001). An active carbón granule with remarkable porous structure has many advantages over the native carbon form, with respect to porosity and adsorption capacity. In this study, we report the adsorption efficiency of coconut shell based granular activated carbón (GAC) incorporated with zirconium (as ZrOCl2) that resulted extra porosity during thermal activation. Adsorption efficiency of the new activated carbon has been tested with phenol in aqueous phase as regards to study of solid -liquid equilibria.
Phenol is a common organic pollutant and its máximum concentration level in the industrial effluents for safe discharge into surface water bodies is 1.0 mg/L (EPA, 2002). WHO recommends a permissible phenol concentration of O.OOlmg/L in potable waters (WHO, 1963). The main sources of phenol in aquatic environments are the wastewater discharges from industries; mainly coke ovens in steel plants, petroleum refineries, resin, petrochemical, fertilizer, pharmaceutical, chemical and dye industries (Girish & Murty, 2012).
The current study is done with a purpose to correlate the effect of Zr4+ ions onto native carbón (GAC 383) to generate extra porosity, how it effect the surface complexes, porosity and pore size distribution of activated carbon. The study also discusses the adsorption behaviour of zirconium impregnated carbón for the removal of phenol from aqueous solution.
2. METHODOLOGY
The activated carbon purchased from Indo Germán Carbón Limited, Binanipuram, Cochin, Kerala, India [particle size (US mesh) 12 x 40, iodine No. 1100 mg/g, apparent density 0.50 g/cc, moisture 5%, ash 4 %] was used throughout the study as the starting material. It was washed with 0.5M NaOH solution and repeated with 0.5M HC1. Finally, more than 1L bed volume of distilled water is passed through a glass column until a neutral pH was noted. Washed carbón was then dried in a hot air oven at 110°C; it is designated as GAC 383. A portion of this carbón was then nitric acid treated for surface oxidation.
The oxidation of GAC was done in a reaction mixture consisting of 100 g acid washed activated carbón, 130ml of con.HN03 and 540ml of distilled water, it is refluxed for 3 hours. After filtration, the procedure was repeated by adding a fresh solution of HN03 and distilled water in the same ratio as the previous. After oxidation, carbón filtered and thoroughly washed with distilled water and dried in a hot air oven at 110"C. This nitric acid oxidised granular activated carbón is designated as GACO 383.
2.1 IMPREGNATION RATIO OF ZIRCONIUM
Different weights of zirconyl chloride (ZrOCi2.8H20) noted as the impregnation ratio (Izr = weight of salt to carbón weight for every lOg carbón) 0.0065, 0.026, 0.052 and 0.078 were used for surface loading. This was done by mixing the raw carbón and activating agent zirconyl chloride at 85°C for 2 hours using magnetic stirrer. After stirring samples were placed in a water bath for about 5 6 hours and finally dried in a hot air oven at 110"C.
All these impregnated carbons were activated under steam at 873K for choosing the best impregnation ratio for better efficiency in a temperature programmed furnace designed/maintained in the laboratory. The samples with best impregnation ratio, were further activated under steam at a higher temperature of 1273K. This granular activated carbón impregnated with Zr4+ is designated as GACZR 1273. Similarly, carbón GACOZR 1273 (carbón oxidized zirconyl chloride impregnated and activated at 1273K) was also prepared.
Granular activated carbons
Four carbón samples used for characterization and adsorption studies are designated as GACZR 1273, GACOZR 1273, GAC 383 and GACO 383, being ZR for zirconium and the last figures are for activation temperatures.
The granular activated carbón (GAC) prepared were assigned by the degree of burn off, which was calculated as follows (Ngah & Fatinathan, 2006).
Winitial is the initial weight of GAC; Wfinal is the weight of GAC after activation.
2.2 CARBON CHARACTERIZATION AND ANALYTICAL METHODS
Surface characterization of newly prepared carbons was performed using FTIR (Thermo Nicolet, Avatar 370) spectroscopy for analyzing the surface functional groups. Boehm's titration method was used for their quantitative determination. In this method, the number of acidic sites, namely carboxylic, lactonic, and phenolic groups on the carbón surface were distinguished by neutralization with bases (NaHCO3, Na2CO3, NaOH). Their basic character was determined by neutralization with HC1. XRD analyzer (Bruker AXS D8 Advance) was used to measure powder X-ray diffraction patterns of the new GAC series. Scanning Electron Microscope (JOEL Model JSM -6390LV) and High-Resolution Transmission Electron Microscopy (JOEL/JEM 2100) were used for the study of surface morphological features of carbón material.
2.3 SOLID-GAS EQUILIBRIA STUDIES
The pore structure characteristic of the new activated carbón series was determined by N2 adsorption-desorption isotherm at 77K volumetrically using Micromeritics TriStar 3000 V6.07 BET analyzer. Isotherm data were subjected to BET, I point, Langmuir, Dubinin-Radushkevich (D-R), t plot and BJH isotherm methods for the determination of pore volume and specific surface area.
2.4 BATCH EQUILIBRIUM ADSORPTION STUDY
Batch test reactors are used for the adsorption studies. 25 mi aqueous solutions of known concentrations of phenol [25, 50, 75, 100, 150, 200, 250, 35, 500, 750, 1000, 1250, 1500, 2000, 2500 & 3000 mg/L] were prepared and added to 0.025g of GAC in a 100 mi Erlenmeyer flask and placed in a temperature-controlled water bath shaker (model LABLINE). The solution was withdrawn from the shaker at the predetermined time interval, filtered through Whatmann No.l filter paper prior to analysis. The concentration of the phenol in aqueous solution is determined using uv-visible spectrophotometer (CARY 50 Probé) at wavelength 260 nm. The amount of phenol adsorbed at a time t, represented as q t (mg/g) and adsorbed at equilibrium condition, q e (mg/g) was calculated according to the following Eq.(2) and Eq.(3) (Gebresemati, Gabbiye, & Sahu, 2017; Kyzas, Deliyanni, & Matis, 2016; Srivastava, Swamy, Malí, Prasad, & Mishra, 2006).
Where C u and C e are initial and equilibrium phenol concentrations (mg/L) respectively. Ct is phenol concentration at time t (mg/L). V is the volume of solution (L) and W is the mass of carbón. An adsorption isotherm profile describes the interaction between adsórbate and adsorbent and is critical for the design of adsorption process. The Langmuir, Freundlich and Dubinin-Radushkevich (D-R) isotherms models were used to describe the equilibrium adsorption isotherm data.
3. RESULTS AND DISCUSSION
3.1 IMPREGNATION RATIO AND BURN OFF
Burn off valué of a carbón impregnated with a metal catalyst is the weight loss occurred during the process of activation. Figure 1 shows that burn off found to increase with the amount of zirconium (as zirconyl chloride) loaded. An incorporation of 0.2 % zirconium results 13.1% burn off. Active carbón formed by low burn off are usually undesirable as they lead to a low surface área carbón product, which in turn may reduce adsorption capacity for the target molecule. In the present study burn off is in the range 13-17 % given in Table 1. Development of microporosity occurs in carbón char without a noticeable increase in the micropore width when the burn off valué is in between 10- 25% (Molina-Sabio et al., 2006).
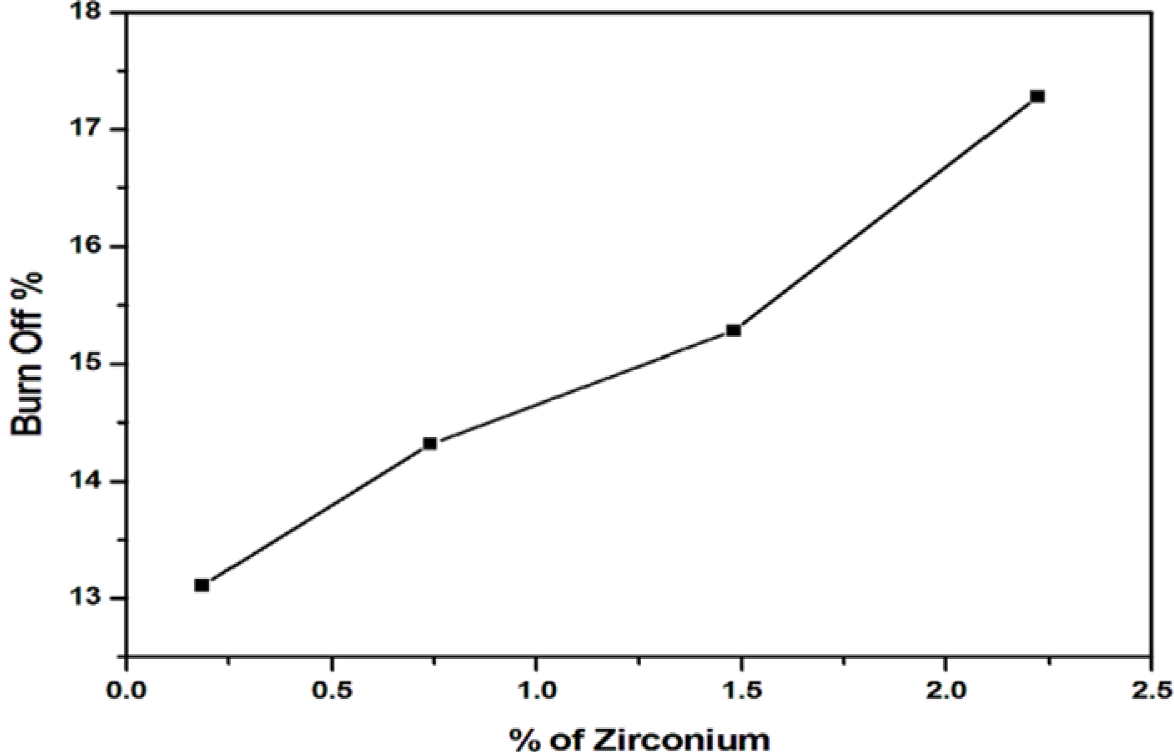
Table 1 Effect of zirconyl chloride on carbón yield and burn off.
| Amount of | % of | Carbón | Burn |
|---|---|---|---|
| (ZrOCl2.8H20) | zirconium | yield% | off% |
| in carbón | |||
| 0.065 | 0.2 | 86.89 | 13.11 |
| 0.26 | 0.7 | 85.68 | 14.32 |
| 0.52 | 1.5 | 84.72 | 15.28 |
| 0.78 | 2.2 | 82.72 | 17.28 |
The optimum carbón yield 84.72 % with a burn off of 15.28 % is given by an impregnation of 1.5% zirconium, indicate a stage of progressive carbonization (Figure 1). Further incorporation of Zr i+ (2.2%) exhibited marked enhancement in burn off (17.28 %) leads to results a lower carbón yield (82.72 %), It is presumed that the impregnation of 1.5 % attributes to a better carbón yield due to uniform distribution and large dispersión of Zr 4+ ions throughout the accessible interior of the carbón granules.
Based on this observation, 1.5 % of Zr4+ impregnated carbón char are used for activation at temperature 1273K for better yield and burn off to obtain GACZR 1273 and GACOZR 1273. More impregnation of zirconium may cause the widening of the existing pores as well as the formation of large pores by additional burning of the walls between the adjacent pores during the later stages of activation.
3.2 SURFACE CHEMISTRY OF Zr4 + IMPREGNATED CARBON
Nitric acid treatment of carbons genérate larger amounts of oxygen functional groups on the carbón surface. These extra surface oxygen groups on the resulted carbons are having acidic character, due to carboxylic, phenolic, and lactonic groups are determined by neutralization with a base of NaHCOs, NaOH, and Na2COs respectively in aqueous phase. Whereas, basic groups (pyrones) are determined by neutralization with HC1. The results shown in Table 2 indicate surface modified carbón GACO has more C-0 acid functional groups. It indicates that, the number of acidic sites increases when carbón is reacted with the oxidizing agent. On the other hand, the numbers of basic sites are decreased during acid oxidation modification (Pradhan & Sandle, 1999).
Figure 2(a) and Figure 2(b) shows the FTIR spectra of new activated carbón series. Relatively high intensity-peak is observed at 3460 crrr1, 1640 crrr1, 2919 cm_1and 1100 crrr1 for HNO3 modified carbons compared to the native form GAC 383.
Table 2 Surface oxygen functional groups by Bochm titration and Crystallinc parameters by XRD.
| Sample name | Surface functional group | XRD parameters | |||||
|---|---|---|---|---|---|---|---|
| Carboxylic | Phenolic | Lactonic | Base | ||||
| meq/g | meq/g | meq/g | meq/g | Le | La | dü02 | |
| (0.9) | (1.84) | ||||||
| GAC 383 | 0.40 | 0.45 | 0.18 | 0.50 | 1.14 | 2.28 | 0.36 |
| GACO 383 | 1.38 | 2.10 | 1.34 | 0.20 | 0.97 | 1.94 | 0.36 |
| GACZR 1273 | 0.39 | 0.44 | 0.20 | 0.62 | 0.98 | 2.00 | 0.37 |
| GACOZR 1273 | 0.62 | 1.52 | 0.90 | 0.38 | 1.31 | 2.68 | 0.36 |
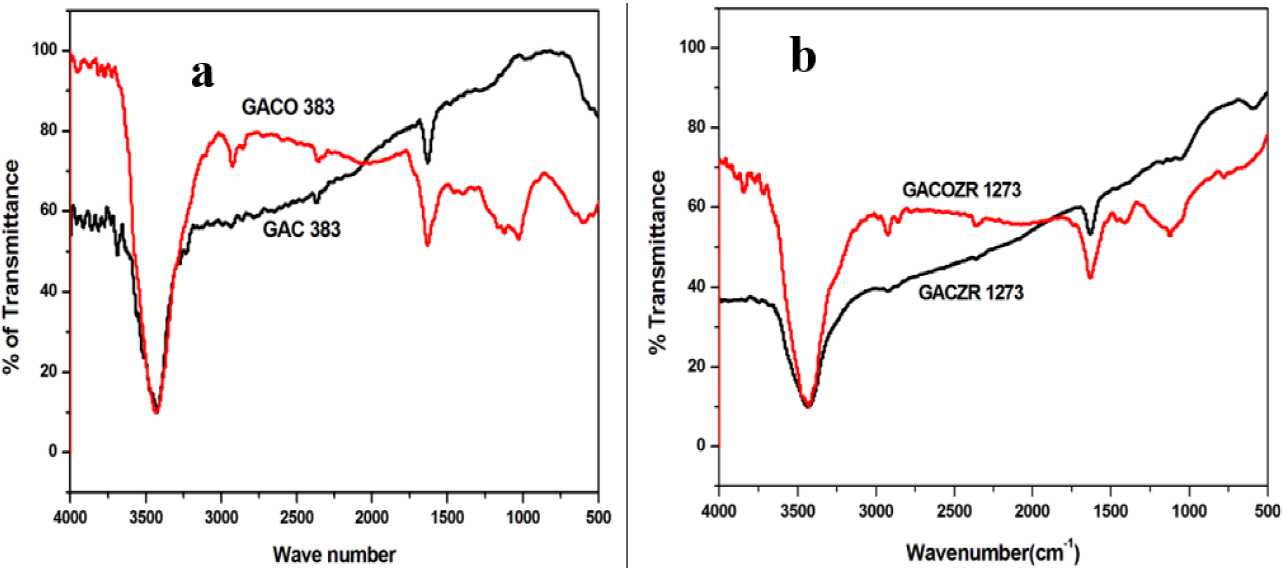
The peak at 3460 cm1 attributed to O-H stretching vibration of the hydroxyl group and 2919 cm1 is due to symmetric and asymmetric stretching vibration of C-H bond. The peak at 1640 cm1 is a characteristic of most carbon materials, is ascribed to the carbonyl group which is highly conjugated in the graphene layers having quinine structure C=0. The band at 1100 cm1 is ascribed as C-O stretching and O-H bending modes of alcoholic, phenolic, and carboxylic groups (Belhamdi, Merzougui, Trarib, & Addoun, 2016; Jia & Thomas, 2000; Liao, Sun, Guo, Ding, k Su, 2016; Liu et al., 2012).
XRD spectrum for GAC 383 and GACZR 1273 is given in Figure 3(a) and GACO 383 and GACOZR 1273 given in Figure 3(b) . From the XRD spectrum, the interlayer spacing doo2 is determined using the Bragg Eq.(4)
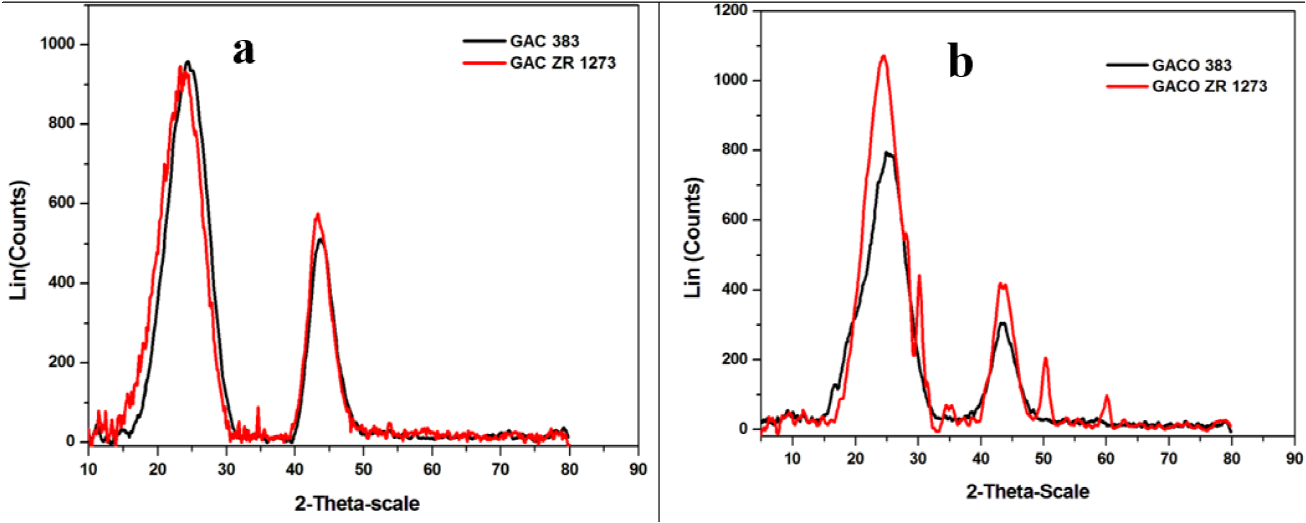
Where λ is the x-ray wavelength and ϑ is the scattering angle for the peak position. The crystallite size along c-axis Lc, and the size of the layer planes La, are determined from the half-width of the respective diffraction peak using the Scherrer Eq.(5)
Where L is Lc or La, B is the half-width of the peak in radians, and K is the shape factor. The quantities Le and La are named as stack height and stack width of carbón crystallites for the new carbón respectively. The shape factor K = 0.9 and K = 1.84 are used for calculation of Le and La, respectively (Kercher & Nagle, 2003; Zhao, Yang, Li, Yu, & .Tin, 2009). The diffraction pattern had broad peaks at around 24 and 42° for the new carbón are assigned to the reflection from (002) and (100) planes, respectively. The (002) peaks are used to calcúlate Le and La. The oceurrence of broad peaks at 28 indicated a well-defined crystal structure that resulted in better layer alignment. The interlayer spacing (dore), summarized in Table 2 are in the range of 0.36 to 0.37 nm. This indicates that the granular activated carbons obtained are nongraphitized carbons.
It is known that nongraphitized carbón shows well developed microporous structure, that is preserved even during the high temperature treatment. Most activated carbons exhibit a more open structure, characteristic of highly defective carbón plates. Subsequently, smaller regions of orientational order (microscale order) are more prevalent (Thomson & Gubbins, 2000).
Morphological observation by SEM shows that, the wide ranges of pores are present on new granular activated carbón. Pores present in GACOZR 1273 are appearing more open compared to GACZR 1273 as seen in the Figure 4(a) & (b) . It reveáis nitric acid modification caused the widening of pores on GACOZR 1273. This carbón has relatively less N2 adsorption; measured BET pore volume and surface área are lower than that of starting carbón GAC 383 as seen in Table 3. This is because an increase in the degree of activation makes the pore walls thin. These are more easily destroyed during the HNO3 treatment, results in widening of the microporosity (Fierro, Torné-Fernández, Montané, & Celzard, 2008).
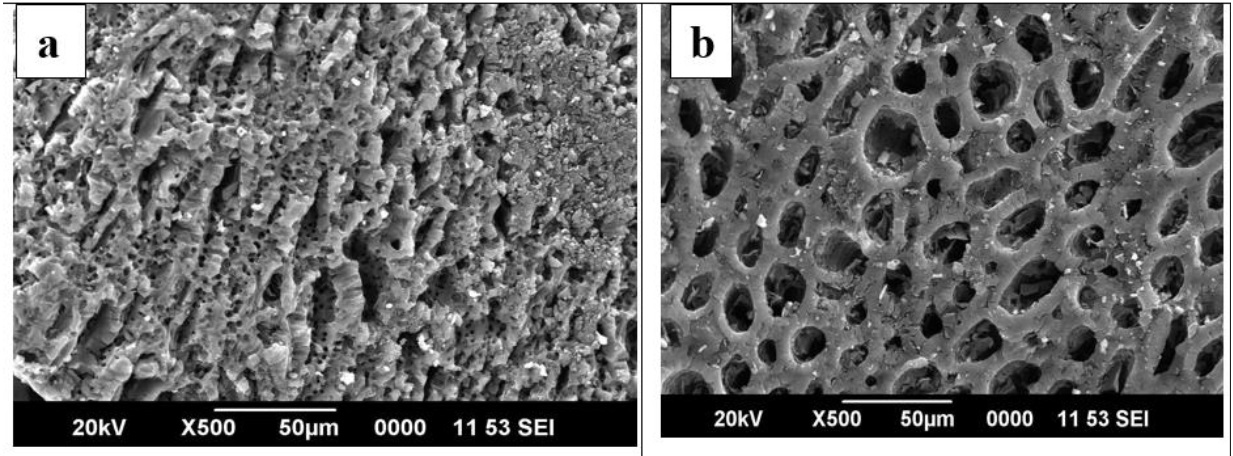
Table 3 Porosity parameters calculated from nitrogen absorption isotherms (N2/77K) using BET and I plot methods
| SAMPLE | BETAnalysis | I plot | BET Analysis | |||||||
| Total Pore Volumen cm3/g | (p/p0 upto 0.3) | SI m2/g | Vm=VI Cm3/gSTP | (p/p0 upto 0.1) | ||||||
| S.ABET m 2 /g | Vm Cm3/g STP | CBET | SA BET m2/g | Vm Cm3/g STP | CBET | Pore width (nm) | ||||
| GAC 383 | 0.573 | 996.8 | 229 | -81.6 | 1275.4 | 293 | 1298.5 | 298.3 | 524 | 1.76 |
| GACO 383 | 0.526 | 974.3 | 224 | -119 | 1164.6 | 267.5 | 1186.5 | 272.5 | 439 | 1.77 |
| GACZR 1273 | 0.640 | 1217.2 | 280 | -104 | 1482.1 | 340.5 | 1497.3 | 343.9 | 873 | 1.71 |
| GACOZR 1273 | 0.531 | 976.2 | 224 | -103 | 1193.2 | 274.1 | 1212.2 | 278.5 | 563 | 1.75 |
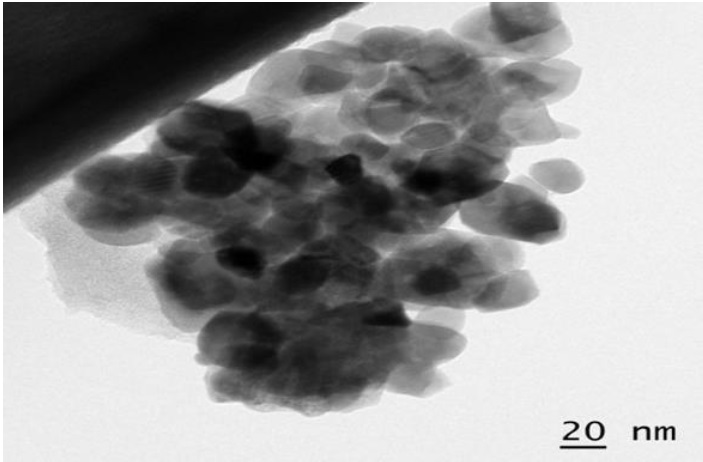
TEM images ¡Ilústrate (Fig. 5) the variation of the surface features due to the loading of the zirconium ions onto the GAC. In the TEM image, the presence of dark área on carbón suggests successful impregnation of zirconyl chloride onto GAC granules and the particles are randomly oriented inside the pore structure.
3.3 SOLID-GAS ADSORPTION ISOTHERMS (Na ISOTHERM AT 77 K)
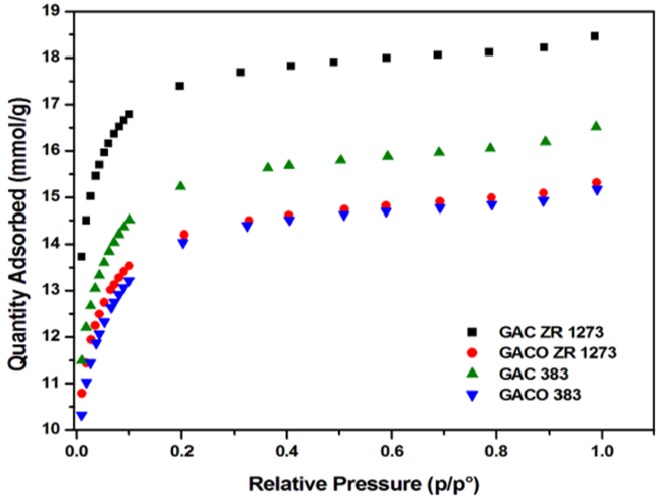
The Ng adsorption isotherms of the activated carbons show Type 1 isotherm as per the IUPAC classification.
It is seen in the Figure 6 that all isotherms have a steep rise in the initial stage of adsorption at lower p/po range. Thereafter adsorption progressed well to attain saturation at high pressure range. Micropores are preferably filled at p/Po < 0.2 as evidenced by a distinct steep adsorption front, assaigned to very high adsorption efficiency of the material within the narrow micropore range (Simoes, Hoffmann, Claudio, & Wilhelm, 2016).
The pore volume and the respective specific surface área of each carbón have been determined for predicting the efficiency of the material. In this regard, a series of isotherm analysis applied. BET, I plot, Langmuir, Freundlich, and Dubinin- Radushkevich (D-R) methods were foliowed using Ng adsorption data at 77K.
3.3.1 Brunauer Emmett Teller (BET) Isotherm Analysis
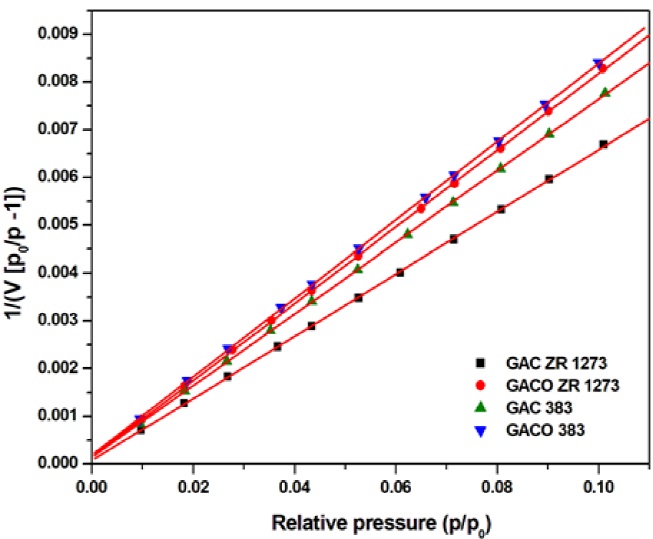
The BET isotherm method based on a theory of multilayer adsorption was applied for the carbons and the respective BET surface área was calculated from the isotherm using Eq. (6)
A plot of
Accordingly, the monolayer volume V m and the constant C are calculated. The linear plot, is extended in the range 0.05 < P < 0.3 for the respective BET analysis. From the isotherm constant V m calculated the specific surface área using Eq. (7)
Table 3 shows the results of BET analysis for the new carbons. Here some discrepaney due to lack of a positive C character is observed for the BET equation in the región 0.05 < P < 0.3. The negative valué of Chas no significant meaning. For ideal microporous materials, C BET is usually positive and it has to be greater than 150. This shows the multilayer adsorption on the new carbons is not fully following the BET model. BET analysis of the adsorption data for the relative pressure range p/po up to 0.1 make C BET become positive. Here, the condition for C BET valué greater than 150 is satisfied in all cases (Fig.7).
Furthermore, it is known that C in Eq. (6) is not actually a
constant but a parameter, is given by the relation
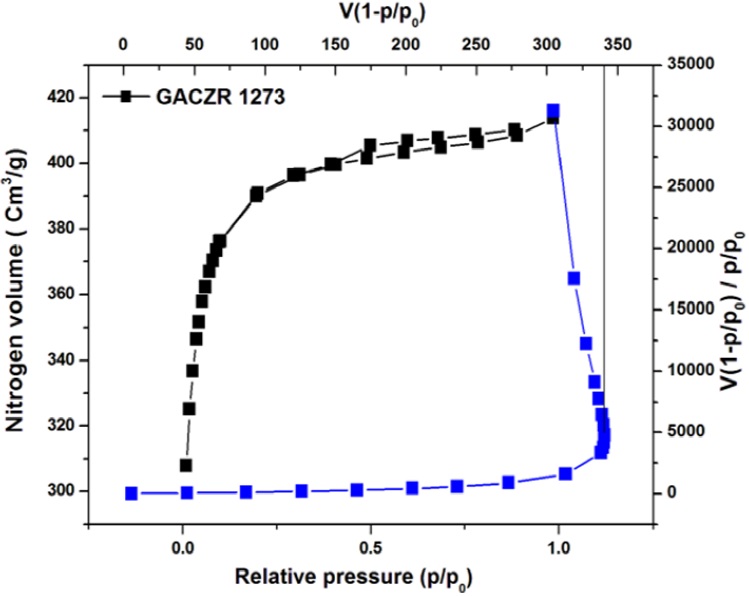
3.3.2 I-Point method Analysis
The rearrangement of the BET equation in Scatchard-type form, provide the isotherm line with slope equal to (C-l) at any p/po and V. This plot is known as BET-Scatchard (B-S) plot (Pomonis et al., 2005) given by Eq. (8)
The graphs (Fig. 8) give an inclined V shape curve () with an inversión point termed / point. The extrapolation of this point towards x-axis ismarked and taken as V m i.e. [V (1-P)] ipomi = V m (monolayer volume of /plot method) (Collins et al 2011). V m can be used for the determination of surface área. Specific surface área is calculated using Eq. (9)
Hence the
I
point method provides an altérnate way determine the Surface to
determine the surface área of new carbons without any ambiguities. Mostly,
these carbons have a C parameter (BET) positive for further
plotting of N
2
data at p/p
o
< 0.1 and simultaneously fitting the BET model for
confirmation. The surface área was calculated from the monolayer volume
On BET analysis of isotherm data up to p/po = 0.1 has resulted comparable surface área similar to that obtained from I plot. The critical evaluation of isotherm constants by the BET and I-plot method revealed that the materials are convincingly microporous with pore width ranges 1.71 - 1.77 nm. The average pore width of carbón calculated using the Eq. (10)
The major factors governing the selectivity of active carbons is the pore characteristics, i.e. pore size distribution and pore volume (Branton & Bradley, 2011).
In this regard, pore volume, pore width and surface área of new carbons are shown in Table 3.
BET surface área of the carbón activated and impregnated with Zr 4,+ has been 1497.3 m2/g for the pore volume of 0.640 cm3/g while, that for GAC 383 was 1298.5 m2/g for the pore volume 0.573 cm3/g. The significance of this study is that Zr 4+ activation enhanced the total pore volume, micropore volume and specific surface área of GAC.
The monolayer-multilayer adsorption appears to happen as a cooperative micropore filling at high p/po prior to capillary condensation. This allows to apply a series of isotherm models for the evaluation of monolayer volume valid for a Type I (Langmuir type) isotherm.
3.3.3 Langmuir Isotherm Analysis (Kaneko, 1994) Figure 9(a) (Lowell & Shields, 1991)
Langmuir equation (Langmuir, 1918) is applied to the new carbons to study monolayer adsorption behaviour. The general form used to plot N2 isotherm at 77K is given by Eq. (11)
p 0 V m P/V P, V m b Zr J,+ V m = 388 cm 3 /g) (1687 m s /g). N%
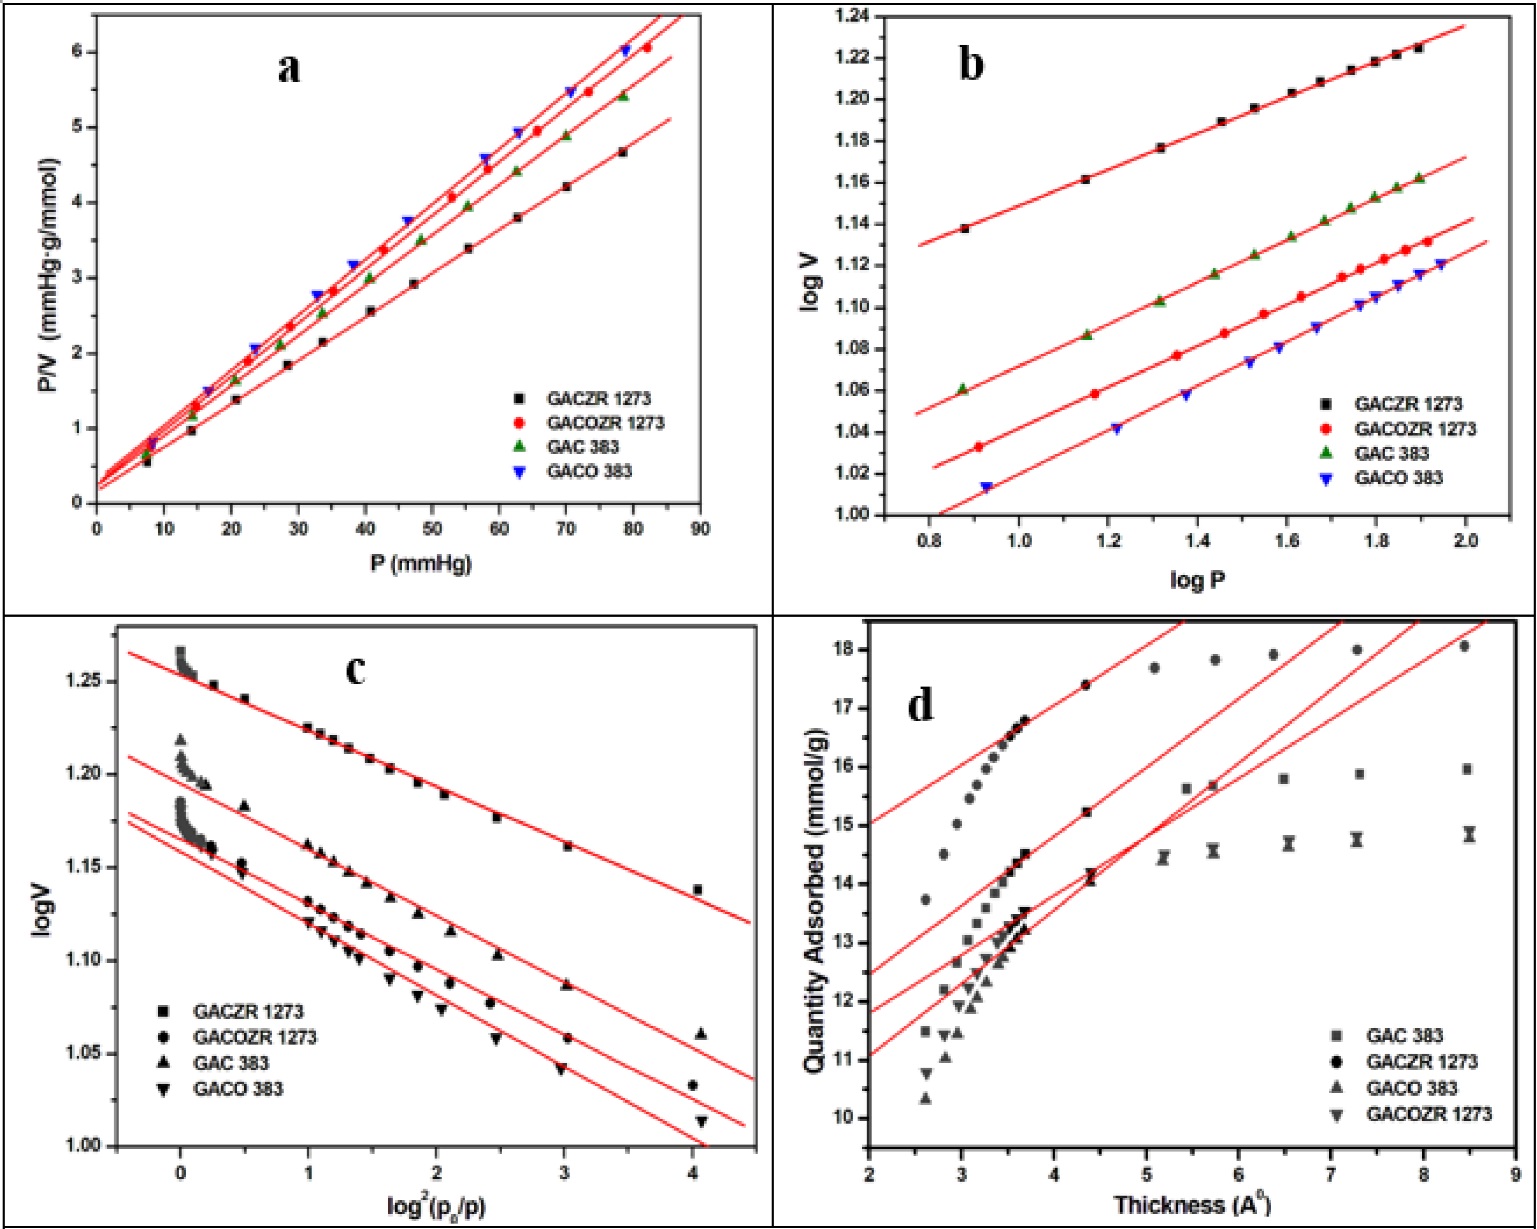
3.3.4 Freundlich Isotherm Analysis
Physisorption of N 2 gas on the carbons was evaluated using the Freundlich isotherm equation by the relationship as per Eq. (12) (Achari, 1998; Kumar, de Castro. Martinez-Escandell, Molina-Sabio, & Rodriguez-Reinoso. 2010).
A plot of log V verses log P gives a straight line with intercept log Kf and slope 1/n as given in Figure 9(b) . All the carbons have straight line graphs with the correlation coefficient R 2 = 0.999 revealed a strong interaction between the carbón and nitrogen gas at 77K. It is known that Freundlich "n" valué is a measure of adsorption intensity for physisorption mechanism to occur and it ranges from 9.4 -11.5 for the carbón studied . The modified carbón GACZR 1273 shows the highest 'n' (11.5) and K F , (259) compared to others (Table 4).
Table 4 Porosity parameters calculated from nitrogen adsorption Nz/TTK using Langmuir, Freundlich, & Dubinin-Radushkevich isotherms.
| Sample | Langmuir | Freundlich | D-R | ||||||||
|---|---|---|---|---|---|---|---|---|---|---|---|
| SAl | Vm | R2 | n | KF | R2 | SAD-R | Wo | L | E | R2 | |
| m2/g | cm3 | m2/g | cm3/g | nm | kJ/ | ||||||
| /g | mol | ||||||||||
| GAC 383 | 1465 | 337 | 0.99 | 9.4 | 210 | 0.99 | 424.7 | 351.3 | 2.56 | 15.6 | 0.98 |
| GACO 383 | 1326 | 304 | 0.99 | 9.4 | 184 | 0.99 | 334.1 | 322.8 | 2.99 | 15.0 | 0.98 |
| GACZR 1273 | 1687 | 388 | 0.99 | 11.5 | 259 | 0.99 | 647.9 | 401.7 | 1.92 | 17.0 | 0.99 |
| GACOZR1273 | 1367 | 314 | 0.99 | 10.1 | 196 | 0.99 | 409.4 | 327.8 | 2.48 | 15.8 | 0.99 |
The isotherm behaviour and porosity development of the new carbón have been further evaluated, applying the Dubinin-Radushkevich (D-R) isotherm model.
3.3.5 Dubinin-Radushkevich (D-R) Isotherm Analysis
Dubinin-Radushkevich (D-R) equation (Dubinin,
1960; Dubinin & Kadlec,
1975) is used to determine micropore volume of the new carbons
from the N
2
> adsorption isotherm at 77K. A plot of log
W verses log
2
W is the amount (mmol) of Ng gas gets filled in micropore of carbons. The parameters. characterization energy (E 0 ), pore width (L), and micropore surface área (SA D-R ) are calculated and given in Table 4. E 0 is related to pore width L as per the Eq. (14)
The carbón obtained by incorporating Zr 4+ has an L valué between 1.92 - 2.48 nm i.e the micropore surface área was contributed mainly by pores less than 2.0 nm that are very much generated by Zr 4+ ions during chemical activation.
Dubinin-Radushkevich (D-R) isotherm analysis shows that GACZR 1273 has much higher micropore volume (401.7cm3/g) and micropore surface área (648 m2/g) as compared to that of basic carbón GAC 383 (micropore volume of 351.3 cm3/g and surface área, 425 m2/g). This indicates that carbón has extra porosity due to Zr4+ activation and the energy of adsorption (Eo) is 15-17 k J/mol, common for the physical nature of adsorption in pores having width < 2.0 nm.
3.3.6 t-plot method
Lippens and de Boer (Lippens & de Boer, 1964; Lippens, Linsen, & de Boer, 1964) proposed 't' plot method for the determination of micropore volume and external surface área by plotting the thickness of adsorbed layer t against the amount adsorbed as shown in the Figure 9(d) This isotherm is specific to determine micropore and mesopore filling. The external surface área (SA mic ), micro pore surface área (SA mie ), and micropore volume (V mi ) are given in Table 5. The GAC has the distinct steep rise with respect to quantity adsorbed (mmol/g) in 't' plot in the initial range of adsorbed thickness, to attain máximum with a. round knee. Finally become oriented slightly parallel to x-axis at the higher ranges of adsorbed thickness. A straight line is drawn in the linear región of the t plot. From the slope and intercept the external surface área (SA cxt) and micropore volume (Vmi) are calculated.
Table 5 Porosity parameters calculated from nitrogen adsorption isotherms at 77K using t-plot &
| Sample | t-plot | BJH | |||||||
|---|---|---|---|---|---|---|---|---|---|
| V mi | SA mi | SA ext . | ADCSA | DCSA | ACPV | DCPV | Pore | Pore | |
| cm 3 /g | m 2 /g | m 2 /g | m 2 /g | m 2 /g | cm 3 /g | cm 3 /g | width | width | |
| ( ads) | ( des) | ||||||||
| A° | A° | ||||||||
| GAC 383 | 226.70 | 588.65 | 408.10 | 226.21 | 220.52 | 0.138 | 0.134 | 24.35 | 24.30 |
| GACO 383 | 191.96 | 540.28 | 433.72 | 250.00 | 242.84 | 0.142 | 0.137 | 22.78 | 22.55 |
| GACZR 1273 | 291.07 | 863.84 | 353.40 | 196.07 | 207.50 | 0.117 | 0.121 | 23.89 | 23.22 |
| GACOZR 1273 | 219.58 | 628.45 | 347.80 | 204.04 | 205.76 | 0.123 | 0.123 | 24.10 | 23.86 |
Where t is the thickness of the pores and p/p o is the relative pressure.
External surface área,
Where D is the density conversión factor = 0.0015468. F = surface área correction factor, for most samples it is taken as 1.0.
Micropore volume, Vmi (cm3 /g), can be calculated by multiplying intercept obtained from the t plot with density conversión factor D, given in Eq. (18).
Micropore surface área
Where SA BET is the BET surface área and SA ext is the external surface área.
High external surface área of GACO 383 indicates that nitric acid modified carbón possesses a significant amount of larger pores. This is evidenced by the external surface área up to 6.28 % more compared to basic carbón GAC 383. This is caused by the reduction of micropore volume up to 15.32 % due to the widening of existing micropores. Activation of carbón GAC 383 with Zr 4+ (GACZR 1273) enhances the micropore volume up to 28.40 %, indicate that the activated carbón GACZR 1273 produced is predominantly consists of micropores. In fact, of the total surface área of this carbón (St), micropore surface área contributes 70.0 % and only the remaining 30.0 % contribute external surface área. Means, Z 4+ activation leads to the acceleration of porosity development on the activated carbón matrix of GAC 383. It is seen that Z 4+ activated nitric acid modified carbón GACOZR 1273 has a less proportion of micropores. This is evidenced by a 24.56 % decrease in micropore volume compared to GACZR 1273. Simultaneously, there is no increase in the external surface área, because the extent of pore widening in GACOZR 1273 is relatively less.
3.3.7 BJH (Barrett Joyner Halenda) method
Pore size distribution of GAC series has been done based on SA BET , V mi , V ext . and adsorption average pore width from tire Ng adsorption data at 77 K. The pore size distribution is a measure of physical characteristics of carbón (porous) materials to predict the extent of pore accessibility of an adsórbate molecule. The pore size distribution was determined by the BJH (Barrett Joyner Halenda) method. Distribution curves of pore volume and specific surface área are described as a function of pore width (A°) drawn from the Ng adsorption-desorption data. The adsorption cumulative surface área (ADSCA), desorption cumulative surface área (DCSA), respective pore volumes (ACPV and DCPV) and pore width (ads and des) are computed, given in Table 5.
The BJH pore size distribution shows the new carbons are having pore width in the range 2.0-2.24 nm. This supports the evidence for the existence of the fractional mesoporosity (Bindia, 2016).
3.4 SOLID-LIQUID ADSORPTION ISOTHERM STUDY: PHENOL
Adsorption characteristics of all carbons for the removal of phenol are shown in the Figure 10. Equilibrium adsorption isotherm studies show that the adsorption increases with phenol concentration. Adsorption data are fitted to well-known models of Langmuir, Freundlich, and Dubinin-Radushkevich (D-R) isotherms. Adsorptive capacity of Zr4+ impregnated coconut shell based granular carbón is relatively high. Among this group studied, oxidized carbón GACO 383 has less adsorption capacity than others. This is because, a higher proportion of carbón- oxygen surface functional groups (mainly COOH) ionize in water to produce H+ ions. The resulting COO directed towards liquid phase bear negative charges on the carbón surface henee suppresses the further adsorption of phenol. Langmuir, Freundlich and D-R isotherm parameters were determined and presented in Table 6.
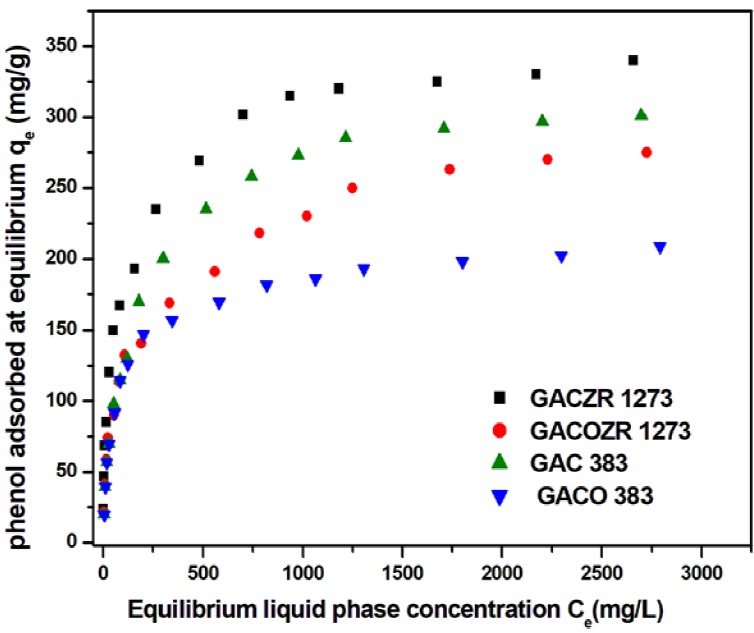
Table 6 Adsorption parameters of phenolon GAC obtained from Langmuir, Freundlich and Dubinin-Radushkevich isotherm at 300C.
| Sample | Langmuir isotherm parameter | Freundich isotherm parameter | D-R- isotherm parameter | |||||||
|---|---|---|---|---|---|---|---|---|---|---|
| qm (mg/g) | KL L/mg | R | N | KF L/g | R | qmi | β | R | E kJ/mol | |
| GAC 383K | 312.5 | 2.48 | 0.999 | 2.49 | 16.73 | 0.972 | 57.38 | 5.08 | 0.983 | 0.293 |
| GACO 383K | 209.64 | 2.48 | 0.999 | 3.12 | 20.71 | 0.945 | 57.41 | 5.50 | 0.985 | 0.302 |
| GACZR 1273 | 342.47 | 4.83 | 0.999 | 3.10 | 33.85 | 0.973 | 69.21 | 0.622 | 0.984 | 0.897 |
| GACOZR 1273 | 280.90 | 2.11 | 0.997 | 2.87 | 20.99 | 0.981 | 55.51 | 2.07 | 0.974 | 0.492 |
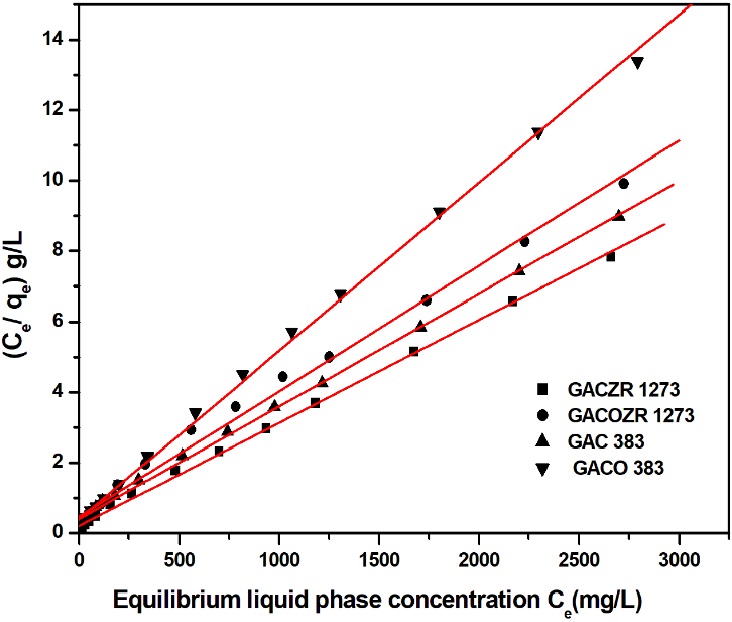
3.4-1 Langmuir isotherm:
The Langmuir isotherm is prominent to describe a homogeneous adsorption system in liquid phase where each molecule adsorbed onto the surface has uniform adsorption energy. Linear form of Langmuir isotherm model is used to evalúate phenol adsorption behaviour of new carbons. (Achari & Jayasree, 2014; Achari & Rajalakshmi, 2014)
Where C
e
and q
e
are the phenol concentration in the liquid phase and solid phase
respectively at equilibrium. K
L
and a
L
are the Langmuir constants, K
L
/a
L
(=q
m
) is known as monolayer adsorption capacity. The parameter
q
m
and K
L
, are determined by plotting C
e
versus
3.4.2 Freundlich isotherm:
Freundlich isotherm model commonly used to describe the adsorption characteristic of heterogeneous surfaces is applied to the new carbón - phenol adsorption system. Figure 12 represents the Freundlich isotherm plots of phenol adsorbed by unit mass of carbón. The linear form of the equation applied is given as follows (Ma, Zhu, Xi, Zhu, & He, 2016).
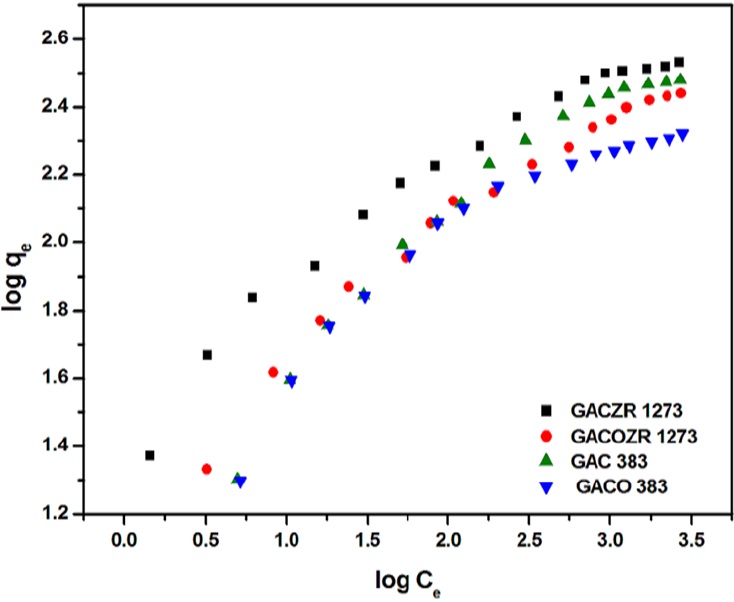
Where C c and q c are the liquid phase phenol concentration (mg/L) and solid phase concentration (mg/g) respectively at equilibrium. Kr is a function of the energy of adsorption as well as a measure of adsorptive capacity. 1/n determines the intensity of adsorption. As regards to new carbón series, Kr and n are evaluated and given in Table 6.
3.4.3 Dubinin-Radushkevich (D-R) isotherm:
The D-R isotherm generally applied to express the adsorption mechanism with a Gaussian energy distribution onto a heterogeneous surface specifically for gas-solid equilibria. In the case of liquid-phase adsorption Dubinin-Radushkevich (D-R) equation assumes that, the adsorption occurs in micropores and is limited to a monolayer. The linear form of D-R equation is expressed as
β is a constant related to the energy of adsorption, Ɛ is the Dubinin-Radushkevich isotherm constant and q mi is a measure of adsorption capacity.
Where
D-R isotherm is plotted as a function of the logarithm of amount adsorbed (In q e ) versus Ɛ2 (Fig. 13).
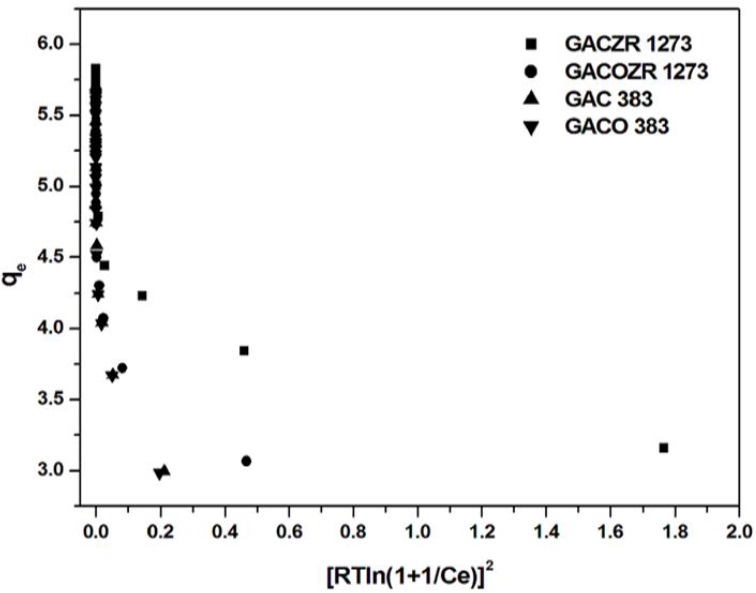
Fig. 13 Dubinin-Radushkevich Adsorption Isotherm of phenol on GAC 383, GACO 383, GACZR 1273 and GACOZR 1273.
The mean free energy, E per molecule of adsórbate (for removing a molecule from its location in the sorption space to the infinity) can be determined by the Eq.(24) (Dada, Olalekan, Olatunya, & Dada, 2012; Stoeckli et al., 2001).
Regarding the isotherm analysis, equilibrium data for phenol adsorption were well fitted to the Langmuir model with monolayer adsorption capacity of GACZR 1273 (342.5 mg/g), GAC 383 (312.5 mg/g) for GACOZR 1273 (280.9 mg/g) and GACO 383 (209 mg/g). From the Table 6 it is clear that, the interaction of phenol on the GACZR 1273 is prominent due to chemical activation with zirconium (Zr4+) ions. At the same time nitric acid modification of carbón decreased the adsorption efficiency of GACO 383 and GACOZR 1273 towards phenol.
Adsorption analysis of phenol using Freundlich finds that constant K F (adsorption binding constant) varies in the range of 16.7 - 33.8, and n (adsorption intensity) is in the range of 2.49 - 3.12, confirms favourable adsorption as it lies between 1-10.
Dubinin-Radushkevich parameters q m and ϐ are determined from the intercept and slope of isotherm plot and are given in Table 6. The adsorbed amount (q mí ) is 69.2 mg/g for Zr4+ modified carbón GACZR 1273. It indicates that micropores are developed on GAC 383 during activation after impregnation with Zr 4+ are accessible in solid-liquid adsorption equilibria. Dubinin-Radushkevich adsorption isotherm analysis of solid-gas equilibria of N2 at 77K [Table 4] substantiate the formation and contribution of enough micropores (henee evaluation of micropore volume) towards specific surface área. The result reveáis that GACZR 1273 has micropore surface área SAd-r of 647.9 m2/g, whereas the native carbón GAC 383 has SA D_E of 424.7 m2/g only. This means Zr4+ ions promoted an extra microporosity of 223.2 m2/g. This is further confirmed by the results of t - plot analysis (Table 5), which reveáis SA mi is 863.8 nr2/g for GACZR 1273, whereas SA mi is 588.65 m2/g for GAC 383. Extra porosity due to Zr 4+ activation promotes Irigher phenol adsorption efficiency for the carbons. The mean free energy E calculated is in the range of 0.292 - 0.896 kj/mol shows phenol adsorption follows physisorption process, i.e. adsórbate is bound to the surface of the carbons by relatively weak Van der Waals forces.
Nitric acid modified carbón GACO 383, and its zirconium activated form GACOZR 1273 has a less adsorption efficiency compared to GAC 383 and GACZR 1273 (Table 6). More acidic groups already occupied on the carbón surface make them unfavourable and inacceassible for the approach of phenol molecule. Because, it reduces the electrón density on the basal plañe of the carbón. This further reduces the 𝜋 - 𝜋 * interaction between the phenol aromatic ring and the basal plañe of the carbón. Also, surface acidic functional group COOH ionizes and exist as negative sites (-COO") on the carbón surface. It repels the incoming phenoxide ions reducing the extent of donor-acceptor interaction between the phenolic group and carbón surface (Vinod & Anirudhan, 2002).
4. CONCLUSION
Chemical activation of GAC with ZrOCl2.8H20 brought marked changes in the burn off, pore development, and carbón yield. The nitric acid oxidation of GAC 383 causes changes in the microcrystallinity of the carbón layers as evidenced by distinct changes in La, Le and d 002 values. The nitric acid treatment enhances the proportion of surface oxygen groups on carbón surface. Surface morphological studies using SEM indicate that carbón has a uniform and well developed porous structure. HNO3 acid treatment destroys the nature of thin pore walls existed on GAC 383 surface that leads to the widening of micropores. Activating agent Zr-4ions are randomly distributed deep inside the GAC as evidenced by TEM profile. All the four carbons studied shows Type I isotherm character as per IUPAC classification. The critical evaluation of isotherms and constants by BET and /-plot method revealed that the carbons (GAC 383, GACO 383, GACZR 1273 and GACOZR 1273) are convincingly microporous with average pore width ranges 1.71-1.77 nm. Langmuir and Dubinin-Radushkevich isotherm analysis established that pore volume and specific surface área of zirconium impregnated carbón GACZR 1273 is significantly higher than the native carbons GAC 383 and its prodigy GACO 383. The t-plot Analysis showed that of the total surface área of GACZR 1273 (1217.24 m2/g) only 30% (353.40 m2/g) is contributed by external surface área. This suggests that 70% (863.84 m2/g) of the total surface área is truly contributed by the micropores. Hence Zr-4 activation promotes extra microporosity on the coconut shell based granular activated carbón. Pore size distribution (PSD) showed that the adsorption pore dianreter is in ranges 2.28 - 2.43 nm, and desorption pore width ranges 2.25 - 2.43 nm for the group of activated carbons studied.HNO3 oxidized carbón (GACO 383) has relatively less affinity for the adsorption of phenol. Carbón impregnated and activated with Zr 4+ (GACZR 1273) has a higher phenol uptake capacity (342.5 mg/g). From these observations, it is concluded that higher adsorption performance of the new Zr4+ incorporated carbons are due to the formation of more open pore structures with greater proportions of well defined micropores (< 2 nm), developed during chemical activation.
CONFLICT OF INTEREST
The authors have no confliets of interest to declare.

