


 text in
  English (pdf)
 Article in xml format
 Article references
 Send this article by e-mail
 Cited by SciELO
  Similars in
SciELO
Similars in
SciELO 
 Permalink
1. Introduction
The facade is a constructive element aimed at protecting the building from the external environment and becoming, thus, greatly exposed to factors such as solar radiation, driving rain, and temperature. Such exposure allows a complex degradation process involving agents of different nature that can act in synergy, affecting the performance and useful life of the building components and materials through different degradation mechanisms (Bauer et al., 2021).
The ceramic claddings commonly used on facades are associated with a specific degradation process characterized mainly by tile detachment (Bauer et al., 2015; Pacheco and Vieira, 2017) in addition to cracking, lack of ceramic-substrate adhesion, and expansion of substrates due to humidity or thermal variations (Bezerra et al., 2018). In this case, the layers making up the cladding system have different properties (thermal expansion coefficients, modulus of elasticity, thermal conductivity, etc.) and, thus, the action of agents associated with temperature becomes highly relevant (Gaspar and Brito, 2011).
Additionally, the varying surface temperature of the cladding can cause physical changes in the facade sealing system (Silva, 2000). This degradation mechanism results from the effect of expansion and contraction due to temperature variations and non-homogeneous increments that cause shear stresses, generating a separation tendency at the system interface (Saraiva, 1998). As a result, the detachments and cracks that appear in the ceramic claddings can be intensified by the fatigue caused by thermomechanical efforts derived from temperature variations, in addition to restrictions on deformation (Barbosa, 2013).
The weighted thermal amplitude, represented by the Temperature Intensity Index, as well as solar radiation and thermal shocks are used as a representative value of the thermal amplitude and indicative of a greater degradation. The ITI constitutes an analysis of the thermal amplitude that yields a weighted measurement concerning frequency (Nascimento, 2016) and thermal shock, which are punctual events characterized by a high difference in surface temperature in a short time interval (Zanoni, 2015).
The driving rain acting under the facades is considered a highly relevant agent (Nascimento et al., 2016). This action results from the association between rain and wind and is one of the main sources of water on building facades. Without the action of the wind, the rain would fall vertically without wetting significantly the walls (Zanoni, 2015). However, due to the action of the wind, the rain hits mainly the top and sides of buildings. And, although ceramic claddings suffer less significantly from the precipitation incidence compared to the mortar system (Bauer et al., 2018), it shoul be considered in hygrothermal simulations to understand the degradation process.
The degradation of ceramic cladding systems is mainly characterized by ceramic detachment, even though the degradation process changes for different geographical locations (Souza, 2019). Therefore, it is necessary to study the conditions of exposure to the actions of climatic agents to understand the different conditions triggering the degradation process in different regions.
As a continental country, Brazil has climatic variations throughout its territory. For this reason, ABNT NBR 15220-3 (2005) establishes the Brazilian bioclimatic zoning by classifying 330 cities according to their climate into eight bioclimatic zones. These zones are defined as homogeneous geographic regions regarding climate elements that interfere with the built environment and human comfort relationship. Buildings and their elements located in different zones are subject to different exposure conditions to the climate agents that cause the degradation process.
The objective of the proposed investigation is to analyze the action of degradation agents associated with temperature and driving rain on the facades of buildings located in different Brazilian bioclimatic zones. Therefore, the hygrothermal simulation performed using the WUFI Pro 6.5 software, a useful tool for studying degradation (Bauer et al., 2018; Gonçalvez et al., 2018), allowed to obtain data on incident solar radiation, surface temperature and driving rain on the North facades of a model building subjected to the different climatic conditions of each zone.
2. Methods
2.1 Details of the model building.
In this study, the model building is 20m high with a 63.5% absorbance ceramic cladding system (Dornelles, 2007) corresponding to the dark red color, chosen to highlight the effects of temperature, since dark colors present higher surface temperature when exposed to radiation (Uchôa et al., 2016). This model building is placed in different cities located in the eight Brazilian bioclimatic zones as established in the ABNT NBR 15220-3 (2005). Table 1 shows the chosen cities and the corresponding bioclimatic zone.
2.2 Simulation
The hygrothermal simulation in the WUFI Pro 6.5 software is used to evaluate the action of climatic agents on the facades in each city. The software allows entering data such as simulation period, configuration, orientation and inclination of the construction system, coefficients of driving rain and transfer to the surface, initial conditions of temperature and relative humidity, as well as interior and exterior climatic conditions (Freitas, 2011). The simulation output yields the hourly values of total radiation incident on the facades, surface temperature and precipitation.
The simulation was performed for one year period, between 01/01/2019 and 01/01/2020. The outdoor weather conditions of each city are defined based on the Typical Meteorological Year (TMY) files from the EPW/ANTAC database (Roriz, 2012). Table 2 contains the values adopted for the surface transfer coefficients.
Table 2 Transfer coefficients to the external surface adopted in the simulation.
| Coefficient | Unit | Value |
|---|---|---|
| Thermal Resistance (left side) | m2K/W | 0.058 |
| Absorption (Shortwave Radiation) | - | 0.635 |
| Soil Reflectivity | - | 0.2 |
| Incident rain reduction factor | - | 0.7 |
In the study, because all cities studied are below the equator, we chose to analyze only the North facade of each building, which is critical for the incidence of solar radiation. The simulated construction system consists of ceramic cladding, cementitious plastering mortar, ceramic block, internal mortar, and the main monitoring point on the cladding surface. Figure 1 shows the system launched in the program.
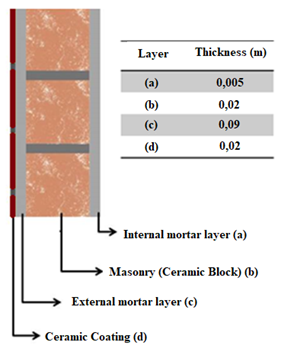
Figure 1 Evaluated constructive system: (a) ceramic tile; (b) external mortar/plaster; (c) ceramic block; (d) internal mortar.
The properties of the materials used in the constructive system layers had already been determined in previous tests conducted by other researchers. The lab tests determined apparent specific mass; porosity; water vapor permeability to calculate the water vapor diffusion resistance factor; water absorption coefficient or capillarity coefficient; and hygroscopic curve. The test results are described in detail in the LEM-UnB Internal Report (Bauer et al., 2015). Table 3 summarizes these results.
Table 3 Summary of material properties.
| Properties | Ceramic Block | Ceramic Tile | Plaster Mortar |
|---|---|---|---|
| Apparent specific mass (kg/m3) | 578 | 1730 | 1830 |
| Porosity (m3/m3) | 0.486 | 0.29 | 0.2604 |
| Permeability to water vapor (kg/(m.s.Pa)) | 8.38. 10-12 | 1.66. 10-12 | 7.9. 10-12 |
| Water absorption coefficient (kg/m2.√s) | 0.09 | 0.001 | 0.089 |
2.3 Degradation agents associated with temperature.
2.3.1 Total radiation, maximum and minimum surface temperature and maximum thermal amplitude.
Equation 1 uses surface temperature data to determine the maximum and minimum temperatures, as well as the daily thermal amplitudes over the simulation period. Furthermore, the daily solar radiation data observed on each facade are added to determine the solar radiation accumulated on the facade over the simulation period.
Where
2.3.2 Thermal shock
Thermal shock is also analyzed in the study of the effects associated with temperature (Zanoni, 2015). For this purpose, the occurrence frequency of the events called full and attenuated thermal shock is determined for all facades during the simulation year. Full thermal shock is defined by a surface temperature difference greater than 8 °C in a 1-hour interval, whereas attenuated thermal shock consists of the same temperature difference verified in a 2-hour interval. The equations for full (2) and attenuated (3) thermal shock are:
The results are shown in graphs of annual occurrence frequency (%) calculated from the relationship between the total number of occurrences of thermal shocks and the number of hours in a year.
2.3.3 Weighted Thermal Amplitude
To analyze the effects associated with temperature, the weighted thermal amplitude expressed as IIT is calculated for all facades, considering the effects of cycles and surface temperature values reached in the systems (Nascimento, 2016). The ITI is established based on temperature variations and their frequency of occurrence in a given pre-established interval. To do so, the variation range of thermal amplitude is divided into four equal intervals, represented by average amplitude values. The ITI is calculated as a weighted average from the frequency values verified for the climate of Brasilia in the given time interval of one year in this study.
Table 4 shows the ranges of the thermal amplitude variation distributed in four equal intervals (Nascimento, 2016) as follows: below 11.5°C (range 1) to greater than 27.7°C (range 4). Finally, ITI is calculated as shown in (4).
Table 4 Thermal amplitude ranges considered for calculating IIT.
| Range | ∆T(°C) | ∆T mean (°C) |
|---|---|---|
| 4 | >27.7 | 31.8 |
| 3 | 19.7 a 27.7 | 23.7 |
| 2 | 11.5 a 19.6 | 15.6 |
| 1 | < 11.5 | 7.5 |
Where
2.3.4 Driving rain
The driving rain is studied using the WUFI software, in which hourly values of precipitation, wind speed and direction are obtained for a total of 8760 hours and used as input data in the computer simulations (Zanoni, 2015). From this, the intensity of driving rainfall is calculated using equation (5).
Where
In the WUFI quantification methodology, the value of
3. Results
3.1 Total radiation, maximum surface temperature and maximum thermal amplitude.
The results of the total incident radiation and the absolute maximum surface thermal amplitudes on the North facades of the eight zones are shown in Figure 2. It is noted that the highest values occur in Z6 ( 38.15°C) followed by Z2 (37.5°C) and Z1 (37.15°C), whereas the lowest value is found in Z8 (22.64°C) and intermediate values were observed in the other zones. The highest solar radiation incidence is observed in Z4 (1,014,409 W/m²) followed by Z6 (995,347 W/m²) while Z8 has the lowest value (743,527 W/m²). Additionally, the solar radiation incidence is associated with the temperature gain on each facade, especially in the Z8 and Z6 zones, except for Z4, which had the highest radiation incidence and the third lowest thermal amplitude.
Total radiation is critical in Z4 and Z6, whereas exposure conditions are milder in Z8, despite being close to the equator and represented by Belém, in PA. This result is because the solar radiation incident on the facade is only a portion of the horizontal global solar radiation (consisting of the direct, diffuse and reflected components) (Silva, 2011) dependent, therefore, on facade orientation and slope.
The surface temperature and the thermal amplitude at the surface result from the interaction between solar radiation and the rise in air temperature throughout the day, thus being better indicators of hygrothermal variations than the total incident solar irradiation (Zanoni, 2015). In this case, Z6 and Z7 are critical zones, as they have a higher thermal amplitude (Figure 2) and higher surface temperature (Figure 3) throughout the year, respectively.

The annual maximum and minimum temperatures for each of the studied facades are shown in Figure 3. It is noted that the lowest temperatures, measured when there is no incident radiation on the facade, vary greatly in the studied buildings. The lowest temperatures of 2.99°C, 5.48°C and 6.98°C were measured for Z2, Z1 and Z3, respectively. Meanwhile, Z8, despite having a lower incidence of total radiation on the facade, has a higher minimum (22.07°C) and a lower maximum (46.16°C) temperature, which is consistent with reduced thermal amplitudes, as shown in Figure 2. In this case, it is emphasized that the surface temperature is linked not only to the incidence of radiation on the facade but also to the air temperature (ASHRAE, 2009; Lamberts et al.,2011).

3.2 Thermal shock.
Figure 4 shows the occurrence frequency of full thermal shocks on all facades. The highest frequency is observed in Z6, in which 1.59% of the measurements are characterized as full thermal shocks, followed by Z1 (0.92%) and Z4 (0.79%). Zones Z5 and Z7 had the lowest frequencies 0.16% and 0.19%, respectively.

The full thermal shock peaks are more frequent between May and July, according to Table 6. The monthly distribution of the number of shocks over a year indicates the month with the highest frequency of thermal shocks for each zone. Thus, the data show that the occurrence frequency of full thermal shocks peaked in zones Z1 and Z5 in July; Z3, Z4, Z6 and Z7 in June; and Z2 and Z8 in May. In zones 1 to 7, thermal shocks decreased from October to March, reaching zero in one or more months during this period except for Z8, where thermal shock events are better distributed throughout the year.
Table 6 Number of monthly full thermal shock events during one simulation year.
| Full thermal shock | |||||||||||||
|---|---|---|---|---|---|---|---|---|---|---|---|---|---|
| Jan | Feb | Mar | Apr | May | Jun | Jul | Aug | Sept | Oct | Nov | Dec | sum | |
| Z1 | 1 | 1 | 1 | 9 | 14 | 18 | 25 | 9 | 1 | 1 | 0 | 1 | 81 |
| Z2 | 0 | 1 | 0 | 4 | 21 | 10 | 7 | 12 | 7 | 0 | 0 | 2 | 64 |
| Z3 | 1 | 0 | 0 | 1 | 6 | 25 | 14 | 0 | 0 | 0 | 0 | 0 | 47 |
| Z4 | 1 | 1 | 0 | 4 | 17 | 23 | 19 | 0 | 0 | 1 | 0 | 3 | 69 |
| Z5 | 0 | 0 | 0 | 0 | 1 | 5 | 6 | 1 | 1 | 0 | 0 | 0 | 14 |
| Z6 | 4 | 1 | 3 | 10 | 13 | 53 | 38 | 12 | 0 | 0 | 1 | 4 | 139 |
| Z7 | 0 | 1 | 3 | 3 | 2 | 6 | 2 | 0 | 0 | 0 | 0 | 0 | 17 |
| Z8 | 5 | 5 | 6 | 7 | 10 | 5 | 2 | 3 | 1 | 4 | 5 | 8 | 61 |
The frequency of attenuated shocks is shown in Figure 5. the highest frequency of 13.65% is observed in Z6, followed by Z4 with 10.88%. Z8, Z5 and Z2 have the lowest frequency values of 2.84%, 3.35% and 4.95%, respectively. It is noteworthy that Z6 has approximately 5 times more attenuated shocks than Z8. The frequency is also high in Z4 and Z1 (10.88% and 10.31%, respectively) followed by Z3 and Z7 (8.75% and 8.60%).

The annual distribution shows higher occurrence from May to August, as observed in Table 6. Only Z5 has two months without the occurrence of thermal shocks (November and December). The occurrence peaked in Z2 and Z8 in May; Z4 and Z6 in June; Z1, Z5 and Z7 in July; and Z3 in August. The occurrences in Z8 are better distributed throughout the year, varying from 12 in September to 32 in May. Meanwhile, in other areas, variation between the months of lowest and highest occurrence is greater, such as in Z6, where it varied from 14 events in November to 211 events in June.
Table 7 Monthly frequency of attenuated thermal shock events over a simulation year.
| Attenuated Thermal Shock | |||||||||||||
|---|---|---|---|---|---|---|---|---|---|---|---|---|---|
| Jan | Feb | Mar | Apr | May | Jun | Jul | Aug | Sept | Oct | Nov | Dec | sum | |
| Z1 | 13 | 24 | 64 | 112 | 146 | 103 | 190 | 114 | 78 | 46 | 4 | 9 | 903 |
| Z2 | 6 | 14 | 39 | 65 | 85 | 38 | 50 | 62 | 44 | 27 | 1 | 3 | 434 |
| Z3 | 6 | 25 | 72 | 106 | 127 | 115 | 76 | 128 | 73 | 28 | 5 | 5 | 766 |
| Z4 | 6 | 18 | 52 | 120 | 148 | 182 | 177 | 143 | 71 | 16 | 10 | 10 | 953 |
| Z5 | 2 | 1 | 5 | 32 | 46 | 56 | 82 | 44 | 22 | 3 | 0 | 0 | 293 |
| Z6 | 27 | 33 | 76 | 121 | 175 | 211 | 207 | 170 | 84 | 56 | 14 | 22 | 1196 |
| Z7 | 10 | 11 | 32 | 80 | 155 | 145 | 157 | 114 | 40 | 3 | 2 | 4 | 753 |
| Z8 | 18 | 15 | 22 | 29 | 32 | 20 | 29 | 19 | 12 | 18 | 14 | 21 | 249 |
The results show that zones with critical exposure have the highest frequency of thermal shock and those exposed to milder conditions have the lowest frequency. Zone Z6 stands out since it presented the highest frequency for both full and attenuated thermal shocks. Finally, Z5 had a reduced frequency of both thermal shocks considered while Z8 had a lower frequency of attenuated shocks.
3.3 Weighted Thermal Amplitude.
Figure 6 shows the IIT results for all facades in each bioclimatic zone. The results take into account the temperature gradient during one year of simulation. As noted in the results of maximum thermal amplitude and thermal shock, Z6 presents critical values (22.55) regarding the action of temperature agents. Also, Z8 and Z5 have the lowest IIT values (16.53 and 16.55) whereas Z2, Z4 and Z7 present high values, and zones Z3 and Z1 present intermediate values.

Thermal variations on the facades cause deformations in the cladding system and induce fatigue stresses as a result of its cyclic nature. Thus, thermal variations are related to anomalies in facade cladding, especially concerning ceramic detachment and cracking (Silva, 2014; Souza, 2016). IIT is considered a reference value for comparing degradation levels between cities that demonstrates the severity of exposure to the thermal degradation agent. Therefore, higher values indicate greater exposure and greater potential for degradation and decreasing useful life.
The IIT is considered adequate to correlate the degradation of facades (Nascimento, 2016), and, based on these index values, we ranked the facades regarding exposure to temperature, according to severity. Then, in descending order, the areas of greatest severity were: Z6-Z2-Z4-Z7-Z1-Z3-Z5-Z8.
3.4 Driving rain.
Figure 7 shows the incidence of total annual rainfall (l/m²) on the same North-facing facades to complete the analysis of the degradation agents. Note that Z8 has a critical total annual rainfall (113.15 l/m²), the value is about 6 times higher than the lower incidence observed in Z5 (18.2 l/m²), in contrast to the previous results. Rainfall is also high in Z4 (100.12 l/m²) and Z3 (71.72 l/m²) compared to the others. Finally, Z1 (52.19 l/m²) and Z6 (59.67 l/m²) present intermediate values while Z2 (35.57 l/m²) and Z7 (30.57 l/m²) have a lower incidence of rain.

It is noteworthy that driving rain results from the action of winds on the precipitation (Freitas, 2011; Zanoni, 2015), therefore, it depends on wind speed and direction. The Northern rainfall incidence is highest in Brasilia and Goiania (Zanoni et al., 2014; Zanoni et al., 2018; Andrade et al., 2021; Melo and Carasek, 2011). The Eastern rainfall incidence is highest in Curitiba (Batista et al., 2017) while the Southern rainfall is most common in Florianópolis (Giango et al., 2010; Giongo, 2007). In this case, the results presented do not necessarily represent the orientation of critical exposure to moisture from the rain, but the orientation adopted as a reference, North.
4. Conclusion
This study investigated the action of degradation agents associated with temperature driving rain on the facades of buildings located in Brazilian cities from different bioclimatic zones. In this context, it was possible to identify areas that are critical regarding the exposure to degradation agents as a way of contributing to the knowledge of the different conditions that trigger the degradation process in Brazil. The results allowed us to identify the following patterns:
Zone Z6 represented by Goiânia-GO had the most critical response to the exposure conditions regarding thermal amplitude, attenuated and full thermal shock, and temperature intensity index;
Zone Z8 represented by Belém-PA, despite exhibiting a milder response to exposure conditions to the agents associated with temperature (solar radiation, thermal amplitude, attenuated thermal shock and temperature intensity index) is critical for exposure to the driving rain.
Zones Z1, Z2, Z3, Z5 and Z7 represented by Curitiba-PR, Santa Maria-RS, Florianópolis-SC, Niterói-RJ and Picos-PI, respectively, presented similar values of total annual radiation incidence on the North facade. However, zones Z1 and Z2 present higher thermal amplitudes compared to the others.
Regarding driving rain and considering the annual precipitation values, the North facades in Z8 (Belem-PA) and Z4 (Brasília-DF) presented higher exposure while Z5 had the mildest exposure.
It is concluded that the North facades analyzed in the 8 Brazilian bioclimatic zones have different exposure conditions to agents associated with temperature and driving rain. These parameters affect building durability since the synergy between degradation agents acting on the facades accelerates the degradation, compromising building performance and affecting useful life. In addition, as a contribution, the study ranks the studied regions regarding the severity of exposure to temperature and, therefore, with greater potential for degradation and decreasing useful life. In descending order, the most exposed zones are: Z6-Z2-Z4-Z7-Z1-Z3-Z5-Z8 represented by the cities Goiânia-Santa Maria-Brasília-Picos-Curitiba-Florianópolis-Niterói-Belém.

